
Integrating PVS-Studio Analysis Results into SonarQube
- Watch, don't read (YouTube)
- System requirements
- PVS-Studio plugins and how to install them
- Integrating PVS-Studio with the SonarQube Docker image
- Maintaining repository compatibility when upgrading to new SonarCXX plugin version
- Creating and setting up a Quality Profile
- Code analysis and importing results into SonarQube
- Matching PVS-Studio warning certainty levels with SonarQube Severity levels
- For software security specialists
- Additional features of the PVS-Studio plugin
- Customizing the analyzer before analysis
- Automatic updates of PVS-Studio plugins
- Notifying of analysis results
- Recommendations and limitations
Integration of PVS-Studio with the SonarQube platform is available only under the PVS-Studio Enterprise license. You can request the trial Enterprise license here.
SonarQube is an open-source platform developed by SonarSource for continuous inspection of code quality to perform automatic reviews with static analysis of code to detect bugs, code smells, and security vulnerabilities on 20+ programming languages. SonarQube offers reports on duplicated code, coding standards, unit tests, code coverage, code complexity, comments, bugs, and security vulnerabilities. SonarQube can record metrics history and provides evolution graphs.
SonarQube's capabilities are shown here.
To import analysis results into SonarQube, PVS-Studio provides a special plugin, which allows you to add messages produced by PVS-Studio to the message base of the SonarQube server. SonarQube's Web interface allows you to filter the messages, navigate the code to examine bugs, assign tasks to developers and keep track of the progress, analyze bug amount dynamics, and measure the code quality of your projects.
Watch, don't read (YouTube)
System requirements
- Operating system: Windows, Linux, macOS;
- Java 8 or higher;
- SonarQube 7.9 or higher;
- PVS-Studio analyzer for C++ or Java.
- PVS-Studio Enterprise-license.
PVS-Studio plugins and how to install them
Important: Starting from version 9.5, the SonarQube Plugin API version no longer matches the actual SonarQube version. This API determines whether the PVS-Studio plugin is compatible with SonarQube. You can see the SonarQube Plugin API version mapping in the Compatibility section on GitHub. You can also find out the SonarQube Plugin API version from the file at the sonarqube-VERSION/lib/sonar-application-VERSION.jar/sonar-api-version.txt path, where sonarqube-VERSION is the SonarQube installation folder.
Additionally, when uploading the PVS-Studio analyzer report to SonarQube, the log will display a message with the current SonarQube Plugin API version.
For example:
INFO Edition: COMMUNITY, SonarQube Plugin API Version: 10.1.0.809The following plugins for SonarQube are available for PVS-Studio users:
sonar-pvs-studio-plugin.jaris a plugin for importing PVS-Studio analysis results into a project on the SonarQube server. Depending on the SonarQube version, use a specific plugin file:- SonarQube versions 7.9 - 10.1 -
sonar-pvs-studio-plugin-old-versions-before-10.2 .jarfor SonarQube (all editions) versions 7.9–10.1 (up to and including SonarQube Plugin API 9.17.0.587);sonar-pvs-studio-plugin.jarfor SonarQube Community Build and SonarQube Server version 10.2 and higher (starting from SonarQube Plugin API 10.1.0.809 and later). Starting from version 10.7, the SonarQube edition versioning scheme has changed. New version format for SonarQube Community:YY.M.0.BUILDNumber. The example: SonarQube Community Build 25.1.0.102122. New version format for SonarQube Developer/Enterprise/Data Center:YYYY.RELEASENumber.PATCHNumber.BUILDNumber. The example: SonarQube Developer 2025.1.0.102418).
sonar-pvs-studio-lang-plugin.jaris a plugin that allows you to create a quality profile for C/C++/C#. It ensures compatibility when transitioning PVS-Studio plugins from older SonarQube versions while preserving previously collected metrics and statistics. Support for this plugin may be discontinued in future releases. If you create a new project, use a profile with one of the standard languages (C++, C#, or Java).
Once the SonarQube server is installed, copy the plugin (sonar-pvs-studio-plugin.jar) to this directory:
SONARQUBE_HOME/extensions/pluginsDepending on what language the analysis results refer to, install the corresponding plugins from the list below (some of them may be installed by default, depending on the SonarQube edition in use):
- SonarCXX plugin (GitHub)
- SonarC# plugin (Marketplace)
- SonarJava plugin (Marketplace)
- SonarCFamily (Marketplace). This plugin is for SonarQube Developer Edition only.
Restart the SonarQube server.
Integrating PVS-Studio with the SonarQube Docker image
The easiest and fastest way to deploy a SonarQube server is to use the SonarQube image from Dockerhub.
To upload PVS-Studio analyzer reports to SonarQube, the latest version of the PVS-Studio plugin for SonarQube should be installed (you can download it here). One of the C/C++ plugins should also be installed if these languages are used in the projects you are analyzing.
Below is a sample Docker file, it creates an image with SonarQube Community Edition and all required plugins:
# To use SonarQube Enterprise Edition, replace "lts-community" with "lts"
# in the tag of the base docker image.
FROM sonarqube:lts-community
USER root

# Installing the curl utility
RUN apk add curl || (apt-get update && apt-get install -y curl)

# Use the latest version of the plugin.
# You can find it at:
# https://pvs-studio.com/en/pvs-studio/download-all/
ARG PVS_VER=7.27.75620.2023

# Installing the PVS-Studio plugin for SonarQube.
RUN curl -Lo \
/opt/sonarqube/extensions/plugins/sonar-pvs-studio-plugin-$PVS_VER.jar \
https://files.pvs-studio.com/sonar-pvs-studio-plugin-$PVS_VER.jar

# If you want to use a different version of the plugin,
# you can change it here.
ARG C_VER=cxx-2.1.1
ARG C_JAR=sonar-cxx-plugin-2.1.1.488.jar

# Installing the SonarCXX plugin (it is required to work with C/C++ projects)
RUN curl -Lo \
/opt/sonarqube/extensions/plugins/$C_JAR \
https://github.com/SonarOpenCommunity/sonar-cxx/releases/download/$C_VER/$C_JAR

# Changing the account that will be used in the container
USER sonarqube
Once you have created the file, use the command to build the Docker image:
docker build -f dockerfile -t sonarqube-pvs-studio ./To run the SonarQube container from a pre-built image, use the following command:
docker run -p 9000:9000 sonarqube-pvs-studioNote: to avoid losing data from SonarQube when removing the container, mount directories using the paths that are defined in the SonarQube container instructions in DockerHub. Here is an example of a command to start a container with mounted directories:
docker run -v /path/to/data:/opt/sonarqube/data
           -v /path/to/logs:/opt/sonarqube/logs
           -v /path/to/extentions:/opt/sonarqube/extensions
           -p 9000:9000 sonarqube-pvs-studio
To see SonarQube running in a Docker container in your browser, follow the link: http://localhost:9000/.
To log in, enter the default SonarQube administrator login and password:
Login: admin
Password: admin
Set a new password for the administrator account after logging in.
Maintaining repository compatibility when upgrading to new SonarCXX plugin version
Note: If you immediately use the updated version of SonarCXX (2.0.+) for your project, then the information below is irrelevant for you.
Developers made numerous changes to SonarCXX 2.0.+, taking into account the experience of previous versions. One of the profound changes is renaming the language key from C++ to CXX. As a result, the PVS-Studio plugin now generates different unrelated repositories for these languages by default. If you update the SonarCXX plugin without prior configuration and then download the PVS-Studio report, all the pre-existing PVS-Studio Issues are considered deleted. All Issues from the report are considered new.
If you need to update SonarCXX and maintain the Issues history from PVS-Studio (for example, keep the statuses like Won't Fix or False Positive with all comments), follow these instructions:
- if you use Quality Profile for C++ that you have been configuring for a long time, backup its copy and replace
<language>c++</language>with</language>cxx<language>in the saved file; - stop the SonarQube server;
- in the configuration file of the SonarQube server on the
SonarQubeFolder/conf/sonar.propertiespath, add thesonar.pvs-studio.enableCompatibilitySonarCXXRepositories=trueline; - replace the Sonar CXX plugin file in the
SonarQubeFolder/extentions/plugins/folder with the new plugin version (2.0.+); - run the SonarQube server (
SonarQubeFolder/bin/windows-x86-64/StartSonar.bat); - restore the pre-saved Quality Profile or create a new one for the CXX language;
- if necessary, enable the rules from the PVS-Studio repository in the Quality Profile for the CXX language;
- set the pre-saved/created Quality Profile as the default profile (Set as Default).
At this point, you can use the restored Quality Profile for the CXX language and upload PVS-Studio reports for projects.
Important: If you previously uploaded the PVS-Studio reports with the new Sonar CXX plugin (2.0.+) and did not add a line from the instructions to the SonarQubeFolder/conf/sonar.properties file, then all Issues that were previously uploaded will change their status to Removed and disappear over time (by default, 30 days).
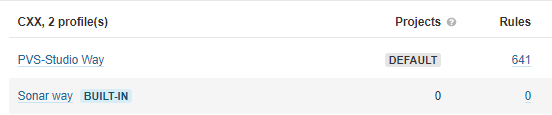
Creating and setting up a Quality Profile
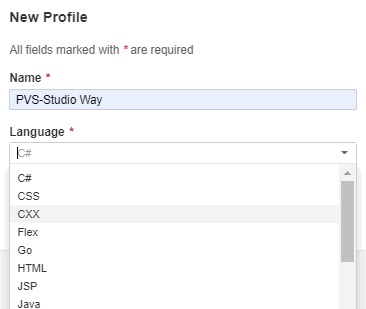
Note. Below you can see the Quality Profile setting with pre-installed PVS-Studio and Sonar C++ Community (v2.0.4) plugins. Please, note that if you use Sonar C++ Community plugin version lower than 2.0+, then instead of the CXX language, there will be C++ (Community) / C(Community).
A Quality Profile is a collection of diagnostic rules to apply during an analysis. You can include PVS-Studio diagnostic rules into existing profiles or create a new profile. Every profile is bound to a particular programming language, but you can create several profiles with different rule sets. The ability to perform any action on quality profiles is granted to members of the sonar-administrators group.
A new profile is created using the menu command Quality Profiles > Create:
To include PVS-Studio diagnostic rules into the active profile, select the desired repository through Rules > Repository:
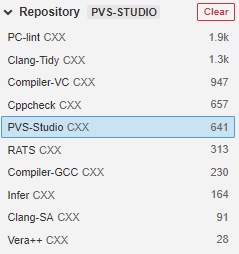
After that, click on the Bulk Change button to add all of the diagnostic rules to your profile, or select the required diagnostic rules manually.
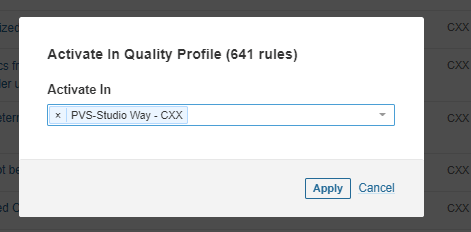
Diagnostic rules activation window:
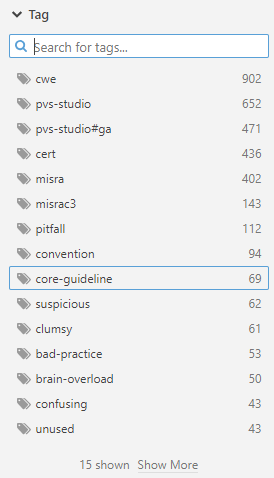
You can also filter diagnostic rules by tags before selecting them for your profile:
After creating/tweaking your profiles, set one of them as the default profile:
The default profile is started automatically for source files written in the specified language. You do not necessarily have to group your profiles based on the utilities used. You can create a single profile for your project and add diagnostic rules from different utilities to it.
Since in SonarQube each extension of the analyzed file must be uniquely assigned to one programming language, Sonar C++ Community plugin version 2.0+ does not define file extensions by default. It helps to avoid conflicts with other language plugins. You need to define them yourself:

When a new PVS-Studio version releases, new diagnostic rules may appear, so you will have to update the plugin on the SonarQube server and add the new rules to the Quality Profile that uses PVS-Studio diagnostic rules. One of the sections below describes how to set up automatic updates.
Code analysis and importing results into SonarQube
Analysis results can be imported into SonarQube using the SonarQube Scanner utility. It requires a configuration file named sonar-project.properties and stored in the project's root directory. This file contains analysis parameters for the current project, and you can pass all or some of these settings as launch parameters of the SonarQube Scanner utility.
Before running the analysis, enter the PVS-Studio license. To learn how to do this, please consult the documentation.
Below we will discuss the standard scanner launch scenarios for importing PVS-Studio analysis results into SonarQube on different platforms. SonarQube Scanner will automatically pick up the configuration file sonar-project.properties in the current launch directory.
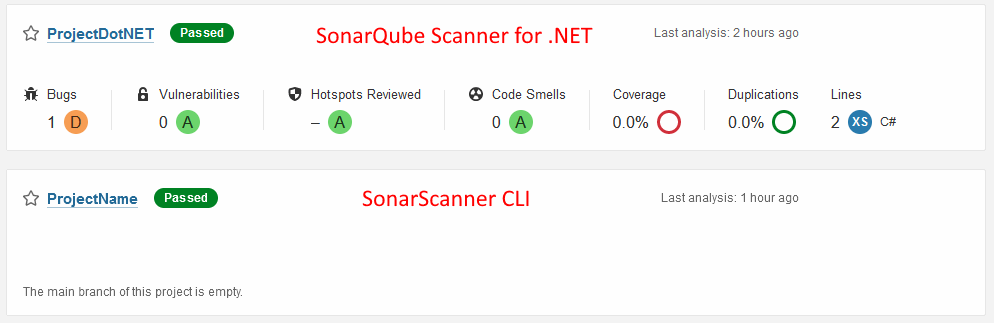
SonarScanner for .NET for C# projects
There are two SonarScanner versions available for C# projects:
- SonarQube Scanner (
sonar-project.propertiesis required); - SonarQube Scanner for .NET (
sonar-project.propertiesis not required).
The difference between the two is that SonarQube Scanner for .NET has a narrower focus. Compared to SonarQube Scanner, it shows more statistics provided by SonarQube for a C# project. For example, for a report loaded by SonarQube Scanner, the tab with the list of projects (project preview) in SonarQube does not display brief project statistics, unlike for a report loaded using SonarQube Scanner for .NET:
Windows: C, C++, C#
MSBuild projects are checked with the PVS-Studio_Cmd.exe utility.
Option 1
By launching the PVS-Studio_Cmd once, you can get both an analysis report and the configuration file sonar-project.properties:
PVS-Studio_Cmd.exe ... -o Project.plog --sonarqubedata ...This is what the scanner launch command looks like:
sonar-scanner.bat ^
  -Dsonar.projectKey=ProjectKey ^
  -Dsonar.projectName=ProjectName ^
  -Dsonar.projectVersion=1.0 ^
  -Dsonar.pvs-studio.reportPath=Project.plog ^
  -Dsonar.login=admin ^
  -Dsonar.password=NEW_ADMIN_PASSWORD
Option 2
When working with SonarQube Scanner for .NET for C# projects, use a special set of commands. You do not need to create the sonar-project.properties file (the --sonarqubedata argument from PVS-Studio_Cmd.exe) when starting the analysis.
- SonarQube Scanner for .NET Framework:
SonarScanner.MSBuild.exe begin ... /d:sonar.pvs-studio.reportPath=Project.plog

MSBuild.exe Project.sln /t:Rebuild ...

PVS-Studio_Cmd.exe -t Project.sln ... -o Project.plog

SonarScanner.MSBuild.exe end- SonarQube Scanner for .NET:
dotnet <path to SonarScanner.MSBuild.dll>
       begin /d:sonar.pvs-studio.reportPath=Project.plog

dotnet build Project.sln /t:Rebuild ...

PVS-Studio_Cmd.exe -t Project.sln ... -o Project.plog

dotnet <path to SonarScanner.MSBuild.dll>
end
Windows, Linux, macOS: Java
Add the following lines to the Java project under analysis (depending on the project type):
Maven
<outputType>json</outputType>
<outputFile>output.json</outputFile>
<sonarQubeData>sonar-project.properties</sonarQubeData>
Gradle
outputType = 'json'
outputFile = 'output.json'
sonarQubeData='sonar-project.properties'
Java analyzer core
Windows:
java -jar pvs-studio.jar ^
     -s ./ ^
     --ext-file /path/to/file/with/classpath/entries ^
     -o output.json ^
     --output-type json ^
     --sonarqubedata sonar-project.properties
Linux/macOS:
java -jar pvs-studio.jar \
     -s ./ \
     --ext-file /path/to/file/with/classpath/entries \
     -o output.json \
     --output-type json \
     --sonarqubedata sonar-project.properties
Just like in the previous case, the configuration file will be created automatically once the Java analyzer has finished the check.
The scanner launch command will look like this:
Windows:
sonar-scanner.bat ^
  -Dsonar.projectKey=ProjectKey ^
  -Dsonar.projectName=ProjectName ^
  -Dsonar.projectVersion=1.0 ^
  -Dsonar.pvs-studio.reportPath=output.json ^
  -Dsonar.login=admin ^
  -Dsonar.password=NEW_ADMIN_PASSWORD
Linux/macOS:
sonar-scanner \
  -Dsonar.projectKey=ProjectKey \
  -Dsonar.projectName=ProjectName \
  -Dsonar.projectVersion=1.0 \
  -Dsonar.pvs-studio.reportPath=output.json \
  -Dsonar.login=admin \
  -Dsonar.password=NEW_ADMIN_PASSWORD
Linux, macOS: C, C++, C#
If you work with a C/C++ project, you need to create the configuration file manually. For example, it may include the following contents:
sonar.projectKey=my:project
sonar.projectName=My project
sonar.projectVersion=1.0
sonar.pvs-studio.reportPath=report.json
sonar.sources=path/to/directory/with/project/sources
Option 1
If you have a C# project, you can get the analyzer report along with the configuration file with the help of the following command:
pvs-studio-dotnet .... -o report.json –sonarqubedataYou can run the scanner with this command:
sonar-scanner\
  -Dsonar.projectKey=ProjectKey \
  -Dsonar.projectName=ProjectName \
  -Dsonar.projectVersion=1.0 \
  -Dsonar.pvs-studio.reportPath=report.json \
  -Dsonar.login=admin \
  -Dsonar.password=NEW_ADMIN_PASSWORD
Option 2
When working with SonarQube Scanner for .NET for C# projects, use a special set of commands. You do not need to create the sonar-project.properties file (the --sonarqubedata argument from pvs-studio-dotnet) when starting the analysis:
dotnet <path to SonarScanner.MSBuild.dll>
       begin /d:sonar.pvs-studio.reportPath=report.json

dotnet build Project.sln /t:Rebuild ...

pvs-studio-dotnet .... -o report.json

dotnet <path to SonarScanner.MSBuild.dll> end
Since SonarQube 2025.1 the -Dsonar.password property has been removed, so instead of it you should use -Dsonar.token.
The command in this case will look like this:
-Dsonar.projectKey=ProjectKey ^
  -Dsonar.projectName=ProjectName ^
  -Dsonar.projectVersion=1.0 ^
  -Dsonar.pvs-studio.reportPath=Project.plog ^
  -Dsonar.token=TOKEN
sonar-project.properties
To fine-tune the analysis further, you can compose the configuration file manually from the following settings (or edit the automatically created file when checking MSBuild and Java projects):
sonar.pvs-studio.reportPathis the path to the analyzer report in the .plog (for MSBuild projects) or .json format;sonar.pvs-studio.licensePathis the path to the PVS-Studio license file (when checking an MSBuild project, you can pass this parameter usingsonar.pvs-studio.settingsPath). Default path on Linux and macOS~/.config/PVS-Studio/PVS-Studio.lic;sonar.pvs-studio.sourceTreeRootis the path to the project directory on the current computer for cases when the report was generated on another computer, Docker container, etc. This parameter enables you to pass reports containing relative paths tosonar.pvs-studio.reportPath(when checking an MSBuild project, you can pass this parameter usingsonar.pvs-studio.settingsPath);sonar.pvs-studio.settingsPathis the path to the Settings.xml file for MSBuild projects checked on Windows. This file already contains information aboutlicencePathandsourceTreeRoot, so you don't have to specify them explicitly. Default path:%AppData%\PVS-Studio\Settings.xml. File is used on Windows only;sonar.pvs-studio.cwespecifies if CWE IDs are added to analyzer warnings. This option is off by default. Use theactivevalue to enable;sonar.pvs-studio.misraspecifies if MISRA IDs are added to analyzer warnings. This option is off by default. Use theactivevalue to enable;sonar.pvs-studio.languageactivates the C/C++/C# language plugin. This option is off by default. Use the value active to turn it on. Enable this option if you are using a profile with the C/C++/C# languages added through a separate PVS-Studio plugin. This plugin is provided for compatibility of PVS-Studio plugins when moving from older versions of SonarQube to newer ones. It allows you to keep the metrics/statistics obtained earlier and will probably be discarded in future releases.
The other standard scanner configuration parameters are described in the general documentation on SonarQube.
Uploading a report when using the SonarCFamily plugin
When using the PVS-Studio plugin together with the SonarCFamily plugin, you need to additionally use SonarSource Build Wrapper or Compilation Database (since SonarQube 9.1) when uploading PVS-Studio report. Detailed instructions on how to use them can be found on the SonarQube website.
When uploading the report, you need to specify the property sonar.cfamily.build-wrapper-output or sonar.cfamily.compile-commands as an argument when launching sonar-scanner (e.g. -Dsonar.cfamily.build-wrapper-output=directory_with_Build_Wrapper_results) or add the property to the sonar-project.properties file.
Multi-module project
When subproject directories are located at different levels, it becomes impossible to upload the results of several subprojects to SonarQube in one project with standard settings. This is because this sub-project structure requires additional adjustment of the indexer in the SonarScanner utility.
You can set up such a project correctly by using modules where each module is configured for one subproject:
sonar.projectKey=org.mycompany.myproject
sonar.projectName=My Project
sonar.projectVersion=1.0
sonar.sources=src

sonar.modules=module1,module2

module1.sonar.projectName=Module 1
module1.sonar.projectBaseDir=modules/mod1

module2.sonar.projectName=Module 2
module2.sonar.projectBaseDir=modules/mod2
There are two ways to specify the path to the PVS-Studio analysis file.
The first way
Specify different reports for modules:
....
sonar.modules=module1,module2

module1.sonar.projectName=Module 1
module1.sonar.projectBaseDir=modules/mod1
module1.sonar.pvs-studio.reportPath=/path/to/report1.plog

module2.sonar.projectName=Module 2
module2.sonar.projectBaseDir=modules/mod2
module2.sonar.pvs-studio.reportPath=/path/to/report2.plog
The second way
Specify one report at the project level:
sonar.projectKey=org.mycompany.myproject
sonar.projectName=My Project
sonar.projectVersion=1.0
sonar.sources=src
sonar.pvs-studio.reportPath=/path/to/report.plog

sonar.modules=module1,module2
....
In this case, each module will download only warnings relevant to it from the report. Unfortunately, a warning (WARN) will be issued for the files from other modules, indicating the absence of files in the SonarScanner utility output, but all analysis results will be downloaded correctly.
Matching PVS-Studio warning certainty levels with SonarQube Severity levels
In PVS-Studio analyzer reports, each warning has a certainty level:
- High (1): High probability of an error in the code;
- Medium (2): Medium probability of an error in the code;
- Low (3): Low probability of an error in the code;
- Fails (0): A special category that includes internal analyzer messages reporting operational issues.
In SonarQube, Issues have similar levels called Severity. SonarQube has five Severity levels, PVS-Studio has four. In addition, the SonarQube server at a certain point began to support two modes, in which the display of Severity levels on the Issues tab differs:
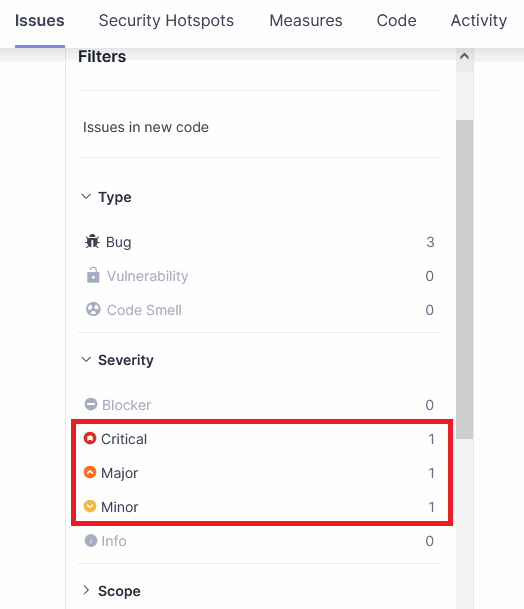
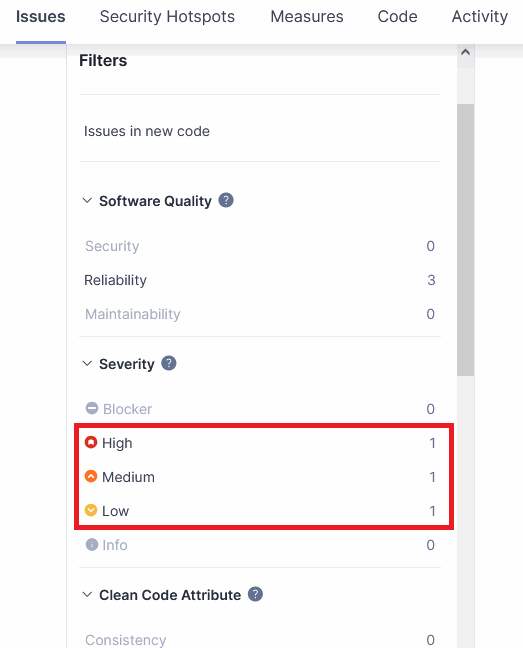
The following table outlines the correspondence between PVS-Studio certainty levels and SonarQube Severity levels
sonar.pvs-studio.treatPVSWarningsAsVulnerabilities=activeFor the changes to be applied, you need to restart the SonarQube server. Once you have done this, the rules with the CWE ID or included in the OWASP Top 10 will have the :
|
PVS-Studio Warning |
Standard Experience Mode |
Multi-Quality Rule Mode |
|---|---|---|
|
Fails (0) |
Info |
Info |
|
High (1) |
Critical |
High |
|
Medium (2) |
Major |
Medium |
|
Low (3) |
Minor |
Low |
|
- |
Blocker |
Blocker |
For software security specialists
PVS-Studio's capabilities of detecting potential vulnerabilities are described on the page PVS-Studio SAST (Static Application Security Testing).
Security-related information on the code under analysis provided by PVS-Studio is additionally highlighted by SonarQube in the imported analysis results.
Cwe, cert, misra, sec tags
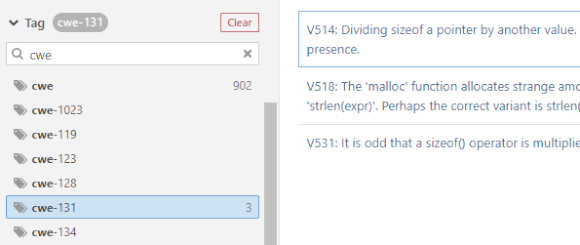
PVS-Studio warnings can be grouped based on different security standards through Issues > Tag or Rules > Tag:
- misra
- cert
- cwe
- sec
You can also select a particular CWE ID if available (when a warning falls into several CWE IDs at once, it will be marked with a single cwe tag; use prefixes in the warning text to filter by IDs):
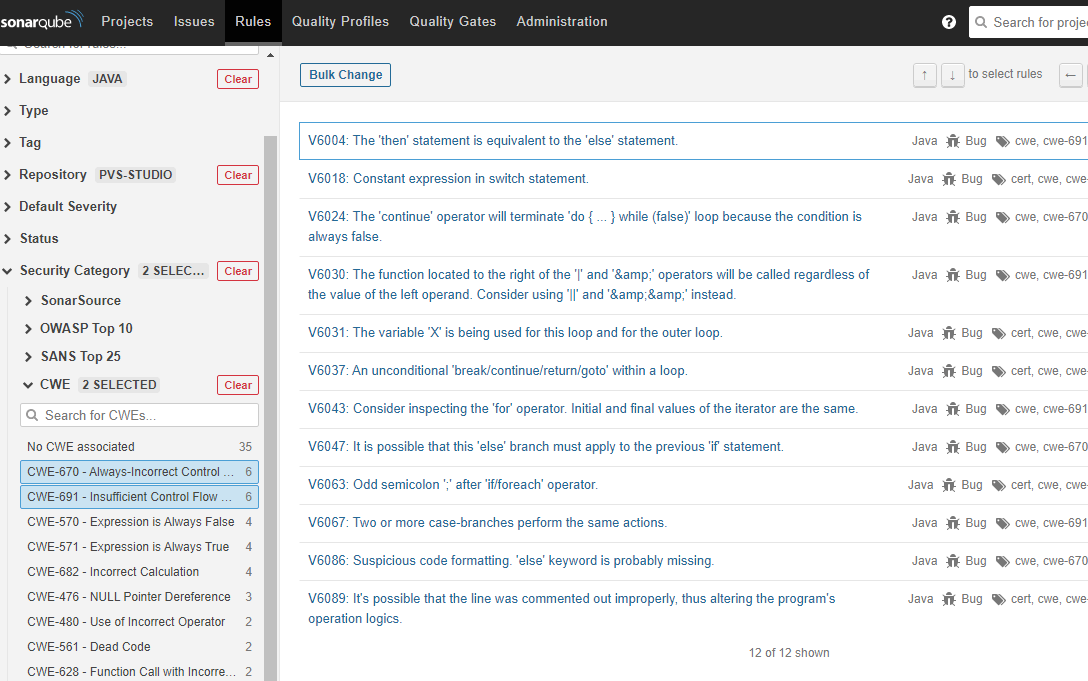
Security Category
In SonarQube 7.8 and 8.4, a new filter by security categories is available on Issues and Rules pages. Using this filter, SonarQube lets to classify rules according to security standards, such as:
- Sans Top 25
- OWASP Top 10
- CWE
Rules and issues from PVS-Studio mapped with CWE ID can also be grouped in the following menu (Security Category > CWE):
Note. Starting from the SonarQube 8.5 version, only Issues/Rules related to security of the Vulnerability or Security Hotspot type will be able to get to the Security Category tab.
PVS-Studio warnings as potential vulnerabilities
All the rules in PVS-Studio are of the Bug type by default. If you need to change the Bug rule type for Vulnerability when having a CWE ID or if the rule is included in the OWASP Top 10, then you need to add the following line in the $SONARQUBE_HOME\conf\sonar.properties server configuration file:
Vulnerability type, and the new generated issues will already take this change into account.
Note. If you had old issues before, this change will not affect them. You need to manually change the type of these issues.
CWE and MISRA prefixes in warnings
The sonar-project.properties configuration file provides the following options:
sonar.pvs-studio.cwe=active
sonar.pvs-studio.misra=active
They are used to enable the inclusion of CWE and MISRA IDs into analyzer warnings:
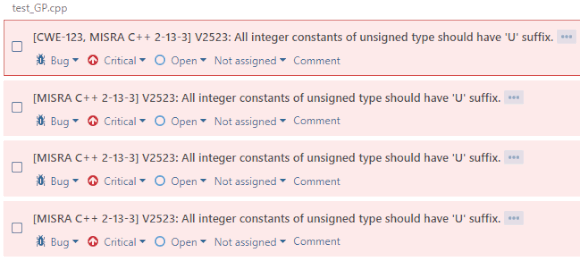
Warnings can be filtered by tags anytime, regardless of the specified options.
Statistics on detected CWE and MISRA problems
The Projects > Your Project > Measures tab shows various code metrics calculated each time a check is launched. All collected information can be visualized as graphs. The Security section allows you to track the number of warnings with CWE and MISRA tags for the current project:
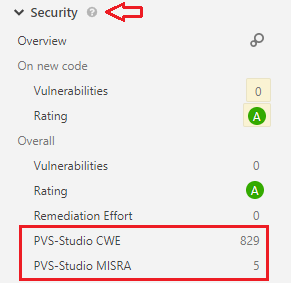
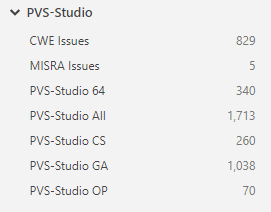
The other, general, metrics of PVS-Studio warnings can be viewed in a separate section, PVS-Studio.
Additional features of the PVS-Studio plugin
Most actions available to SonarQube users are standard for this platform. These actions include viewing and sorting analysis results, changing warning status, and so on. For this reason, this section will focus only on the additional features that come with the PVS-Studio plugin.
Sorting warnings by groups
PVS-Studio warnings are divided into several groups, some of which may be irrelevant to the current project. That's why we added an option allowing you to filter diagnostic rules by the following tags when creating a profile or viewing the analysis results:
|
PVS-Studio diagnostic rules group |
SonarQube tag |
|---|---|
|
General analysis |
cwe |
|
CERT |
cert |
|
MISRA |
misra |
|
Security Related Issues |
sec, sec-* |
These are the standard tags used in PVS-Studio warnings:
1. You can have less "noise" in the analyzer's output by using the No Noise option. It allows you to completely turn off messages of the Low Certainty level (which is the third level). After restarting the analysis, all messages of this level will disappear from the analyzer's output. To enable this option, use the settings window "Specific Analyzer Settings" in Windows or refer to the general documentation for Linux and macOS.
2. You can speed up the check by excluding external libraries, test code, etc. from analysis. To add files and directories to the exceptions list, use the
Code quality control standards
Unlike the pvs-studio# tag group, the standard SonarQube tags may include, depending on the active quality profile, messages from other tools in addition to those from PVS-Studio.
Viewing code metrics
The Projects > Your Project > Measures tab shows various code metrics calculated each time a check is launched. When installing the analyzer plugin, a new section, PVS-Studio, is also added, where you can find useful information on your project and have graphs plotted:
Customizing the analyzer before analysis
When working with a large code base, the analyzer will inevitably generate a lot of messages, and it's usually impossible to address them all at once. In order to focus on the most important warnings and keep the statistics "uncluttered", you can do some tweaking of the analyzer settings and log filtering before launching SonarQube Scanner. There are several ways to do this.
1. You can have less "noise" in the analyzer's output by using the No Noise option. It allows you to completely turn off messages of the Low Certainty level (which is the third level). After restarting the analysis, all messages of this level will disappear from the analyzer's output. To enable this option, use the settings window Specific Analyzer Settings in Windows or refer to the general documentation for Linux and macOS.
2. You can speed up the check by excluding external libraries, test code, etc. from analysis. To add files and directories to the exceptions list, use the Don't Check Files settings window in Windows or refer to the general documentation for Linux and macOS.
3. If you need additional control over the output, for example, message filtering by level or error code, use the message filtering and conversion utility (Plog Converter) for the current platform.
4. If you need to change a warning's level, you can do so in the settings of the analyzer itself rather than in SonarQube. PVS-Studio has the following certainty levels: High, Medium, Low, and Fails. The respective levels in SonarQube are Critical, Major, Minor, and Info. See the page "Additional diagnostics configuration" on how to change warnings' levels.
Automatic updates of PVS-Studio plugins
The update procedure can be automated with SonarQube Web Api. Suppose you have set up an automatic PVS-Studio update system on your build server (as described in the article "Unattended deployment of PVS-Studio"). To update the PVS-Studio plugins and add the new diagnostic rules to the Quality Profile without using the Web interface, perform the following steps (the example below is for Windows; the same algorithm applies to other operating systems):
- Copy the
sonar-pvs-studio-plugin.jarfile from the PVS-Studio installation directory to$SONARQUBE_HOME\extensions\plugins. - Restart the SonarQube server.
Suppose your SonarQube server is installed in C:\Sonarqube\ and is running as a service; PVS-Studio is installed in C:\Program Files (x86)\PVS-Studio\. The script which will automatically update the PVS-Studio distribution and sonar-pvs-studio-plugin will then look like this:
set PVS-Studio_Dir="C:\Program Files (x86)\PVS-Studio"
set SQDir="C:\Sonarqube\extensions\plugins\"

rem Update PVS-Studio
cd /d "C:\temp\"
xcopy %PVS-Studio_Dir%\PVS-Studio-Updater.exe . /Y
call PVS-Studio-Updater.exe /VERYSILENT /SUPPRESSMSGBOXES
del PVS-Studio-Updater.exe

rem Stop the SonarQube server
sc stop SonarQube

rem Wait until the server is stopped
ping -n 60 127.0.0.1 >nul

xcopy %PVS-Studio_Dir%\sonar-pvs-studio-plugin.jar %SQDir% /Y

sc start SonarQube

rem Wait until the server is started
ping -n 60 127.0.0.1 >nul- Specify the key for the Quality Profile where you want the new diagnostic rules activated. This key can be retrieved through the GET request api/qualityprofiles/search, for example (in one line):
curl http://localhost:9000/api/qualityprofiles/search
-v -u admin:admin
The server's response will be as follows:
{
  "profiles": [
    {
     "key":"c++-sonar-way-90129",
     "name":"Sonar way",
     "language":"c++",
     "languageName":"c++",
     "isInherited":false,
     "isDefault":true,
     "activeRuleCount":674,
     "rulesUpdatedAt":"2016-07-28T12:50:55+0000"
    },
    {
     "key":"c-c++-c-pvs-studio-60287",
     "name":"PVS-Studio",
     "language":"c/c++/c#",
     "languageName":"c/c++/c#",
     "isInherited":false,
     "isDefault":true,
     "activeRuleCount":347,
     "rulesUpdatedAt":"2016-08-05T09:02:21+0000"
    }
  ]
}
Suppose you want the new diagnostic rules to be added to your PVS-Studio profile for the languages c/c++/c#. The key for this profile is the c-c++-c-pvs-studio-60287 value.
- Run the POST request
api/qualityprofiles/activate_rulesand specify theprofile_key(obligatory) parameters and tags. Theprofile_keyobligatory parameter specifies the key for the SonarQube profile where the diagnostic rules will be activated. In our example, this parameter has thec-c++-c-pvs-studio-60287value.
Note: A profile key may contain special characters, so the URL characters need to be escaped when passing the key in the POST request. In our example, the c-c++-c-pvs-studio-60287 must be converted into c-c%2B%2B-c-pvs-studio-60287 profile key.
The tags parameter is used to pass the tags of the diagnostic rules you want activated in your profile. To activate all PVS-Studio diagnostic rules, pass the pvs-studio tag.
The request for adding all diagnostic rules to a PVS-Studio profile will look like this (in one line):
curl --request POST -v -u admin:admin -data
"profile_key=c-c%2B%2B-c-pvs-studio-60287&tags=pvs-studio"
http://localhost:9000/api/qualityprofiles/activate_rules
Notifying of analysis results
You can set up sending notifications of analysis results in a few steps. First, you need to configure the email address that will be used to send notifications. After that, each user can select the required notifications.
To configure the email address, the Administrator should navigate to Administration > Configuration > General settings.
After that, fill in the parameters:
SMTP host(email.smtp_host.secured): An SMTP server to send notifications;SMTP port(email.smtp_port.secured): A port number to send emails;SMTP username(email.smtp_username.secured): A username to authorize;SMTP password(email.smtp_password.secured): A user password to authorize;From address(email.from): A sender's email address;From name(email.fromName): A sender's name;Email prefix(email.prefix): An outgoing email prefix.
Note: For the Server base URL (sonar.core.serverBaseURL), specify the IP address where SonarQube is located. This is necessary to ensure that hyperlinks in the email refer to the correct server; by default, they will always direct to localhost.
You can set these parameters in the SonarQube server settings file located at sonarqube\conf\sonar.properties.
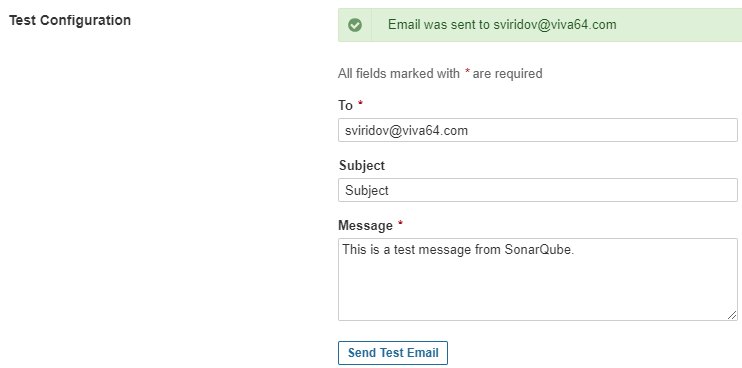
To test the mail connection, you can send a test email in the Test Configuration section.
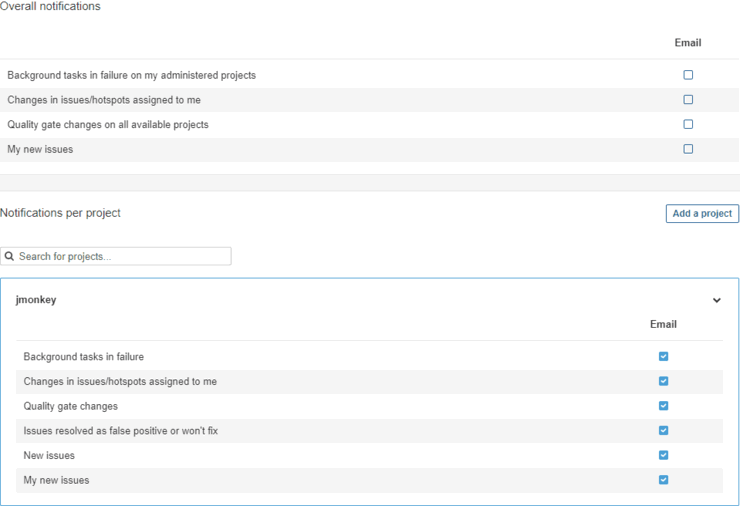
After setting up the sender, each user can select the required notifications. To do this, go to My Account > Notifications. There are various types of notifications that users can choose from, and you can select notifications for each project individually.
Recommendations and limitations
- The SonarQube server deletes closed issues older than 30 days by default. We recommend that you disable this option so that you could keep track of the number of warnings addressed over a long time period (say, a year);
- If you have modules specified in the
sonar-project.propertiesfile and you have a separate analyzer report for each of them, you need to merge these reports using the PlogConverter utility and specify the resulting report once insonar.pvs-studio.reportPath. - The developers of SonarQube recommend using SonarQube Scanner for MSBuild to analyze MSBuild projects. This scanner is a wrapper around the standard SonarQube scanner .It makes the creation of the
sonar-project.propertiesconfiguration file easier by automatically adding modules (projects of a solution) to it and specifying the paths to the source files to be analyzed. However, we faced some limitations that lead to creating incorrect configuration files when working with complex projects. Because of that, we recommend using the standard SonarQube scanner to import PVS-Studio analysis results. - All source files that you want analyzed must be stored on the same disk. This limitation is imposed by the SonarQube platform. Source files stored on disks other than that specified in the
sonar.projectBaseDirproperty will not be indexed, and the messages generated for those files will be ignored.
Was this page helpful?