
Our website uses cookies to enhance your browsing experience.
While handling the large number of messages (and the first-time verification of large-scale projects, when filters have not been set yet and false positives haven't been marked, the number of generated messages can come close to tens of thousands), it is reasonable to use the navigational, searching and filtering mechanisms integrated into PVS-Studio output window.
If you are new to the static analysis tool and would like to know what it can do, you can use the Best Warnings mechanism. This mechanism will show you the most important and reliable warnings.
To check out the analyzer's most interesting warnings, click on the 'Best' button, as shown in the screenshot below:
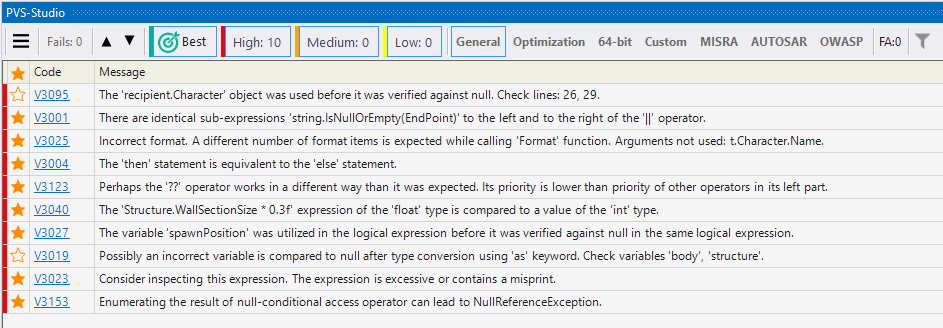
After that, the table with the results of the analysis will show maximum of ten of the most critical warnings of the analyzer.
The main purpose of PVS-Studio output window is to simplify the analyzed project's source code navigation and reviewing of potentially dangerous fragments in it. Double-clicking any of the messages in the list will automatically open the file corresponding to this message in the code editor, will place the cursor on the desired line and highlight it. The quick navigation buttons (see figure 1) allow for an easy review of the potentially dangerous fragments in the source code without the need of constant IDE windows switching.
Figure 1 — Quick navigation buttons
To present the analysis results, PVS-Studio output window utilizes a virtual grid, which is capable of fast rendering and sorting of generated messages even for huge large-scale projects (virtual grid allows you to handle a list containing hundreds of thousands of messages without any considerable hits to performance). The far left grid column can be used to mark messages you deem interesting, for instance the ones you wish to review later. This column allows sorting as well, so it won't be a problem to locate all the messages marked this way. The "Show columns" context menu item can be used to configure the column display in the grid (figure 2):
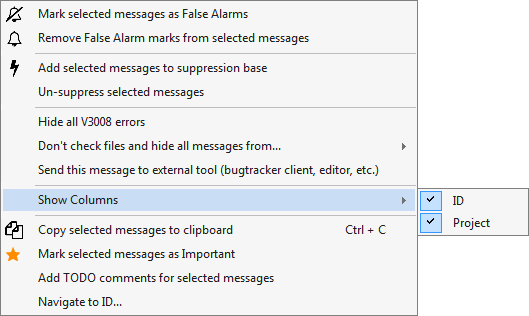
Figure 2 — Configuring the output window grid
The grid supports multiline selection with standard Ctrl and Shift hotkeys, while the line selection persists even after the grid is resorted on any column. The "Copy selected messages to clipboard" context menu item (or Ctrl+C hotkey) allows you to copy the contents of all selected lines to a system clipboard.
PVS-Studio output window filtering mechanisms make it possible to quickly find and display either a single diagnostic message or the whole groups of these messages. The window's toolstrip contains several toggle buttons which can be used to turn the display of their corresponding message groups on or off (figure 3).
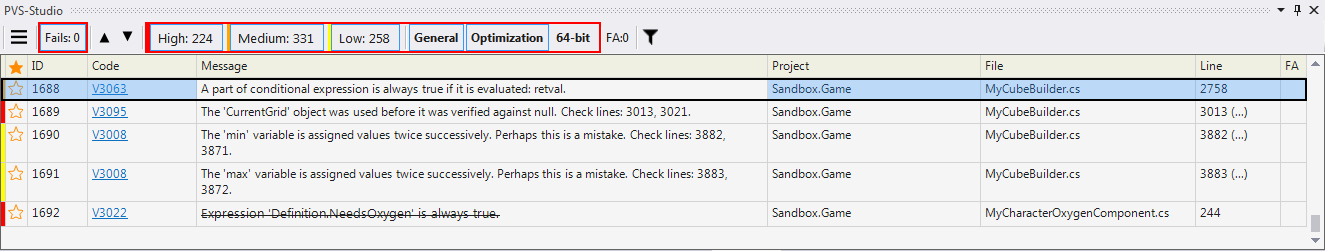
Figure 3 — Message filtration groups
All of these switches could be subdivided into 3 sets: filters corresponding to the message certainty, filters corresponding to type of message diagnostics rule set, and filters corresponding to False Alarm markings within the source code. Turning these filters off will momentarily hide all of their corresponding messages inside the output list.
Detailed description of the levels of certainty and sets of diagnostic rules is given in the documentation section "Getting acquainted with the PVS-Studio static code analyzer".
The quick filtering mechanism (quick filters) allows you to filter the analysis report by the keywords that you can specify. The quick filtering panel could be opened with the "Quick Filters" button on the output window's toolstrip (figure 4).
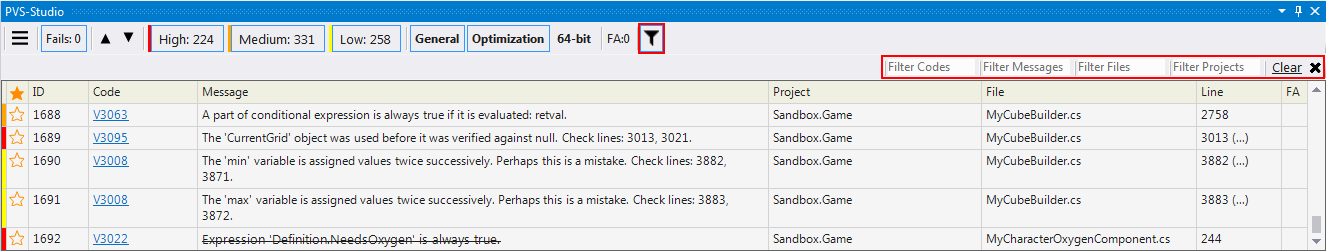
Figure 4— Quick filtering panel
Quick filtering allows the display of messages according to the filters by 3 keywords: by the message's code, by the message's text and by the file containing this message. For example, it is possible to display all the messages containing the word 'odd' from the 'command.cpp' file. Changes to the output list are applied momentarily after the keyword edit box loses focus. The 'Reset Filters' button will erase all of the currently applied filtering keywords.
All of the filtering mechanisms described above could be combined together, for example filtering the level of displayed messages and the file which should contain them at the same time, while simultaneously excluding all the messages marked as false positives.
In case there is a need to navigate to an individual message in the grid, it is possible to use the quick jumping dialog, which can be accessed through the "Navigate to ID..." context menu item (figure 5):
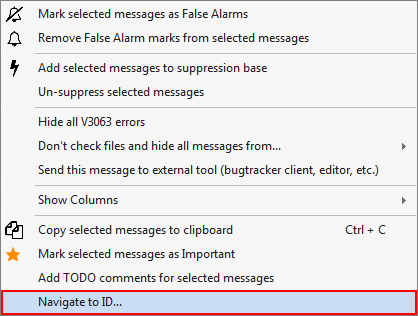
Figure 5 - evoking of the quick jumping dialog
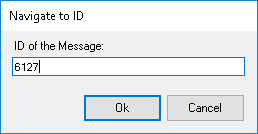
Figure 6 - Navigate to ID dialog
Each of the messages in PVS-Studio output list possesses a unique identifier — the serial number under which this message was added into the grid, which itself is displayed in the ID column. The quick navigation dialog allows you to select and auto-focus the message with the designated ID, regardless of current grid's selection and sorting. You also may note that the IDs of the messages contained within the grid are not necessarily strictly sequential, as a fraction them could be hidden by the filtering mechanism, so navigation to such messages is impossible.
The large-scale projects are often developed by a distributed team, so a single person isn't able to judge every message static analyzer generates for false-positives, and even more so, is unable to correct the corresponding sections of the source code. In this case it makes sense to delegate such messages to a developer who is directly responsible for the code fragment in question.
PVS-Studio allows you to automatically generate the special TODO comment containing all the information required to analyze the code fragment marked by it, and to insert it into the source code. Such comment will immediately appear inside the Visual Studio Task List window (in Visual Studio 2010 the comments' parsing should be enabled in the settings: Tools->Options->Text Editor->C++->Formatting->Enumerate Comment Tasks->true) on condition that the ' Tools->Options->Environment->Task List->Tokens' list does contain the corresponding TODO token (it is present there by default). The comment could be inserted using the 'Add TODO comments for selected messages' command of the context menu (figure 7):
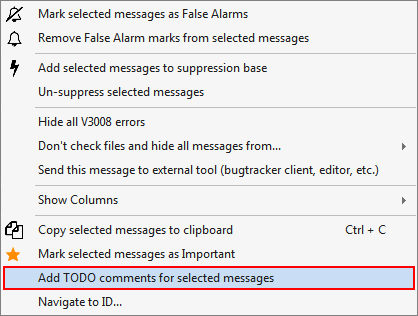
Figure 7 - Inserting the TODO comment
The TODO comment will be inserted into the line which is responsible for generation of analyzer's message and will contain the error's code, analyzer message itself and a link to the online documentation for this type of error. Such a comment could be easily located by anyone possessing an access to the sources thanks to the Visual Studio Task List. And with the help of the comment's text itself the potential issue could be detected and corrected even by the developer who does not have PVS-Studio installed or does not possess the analyzer's report for the full project (figure 8).
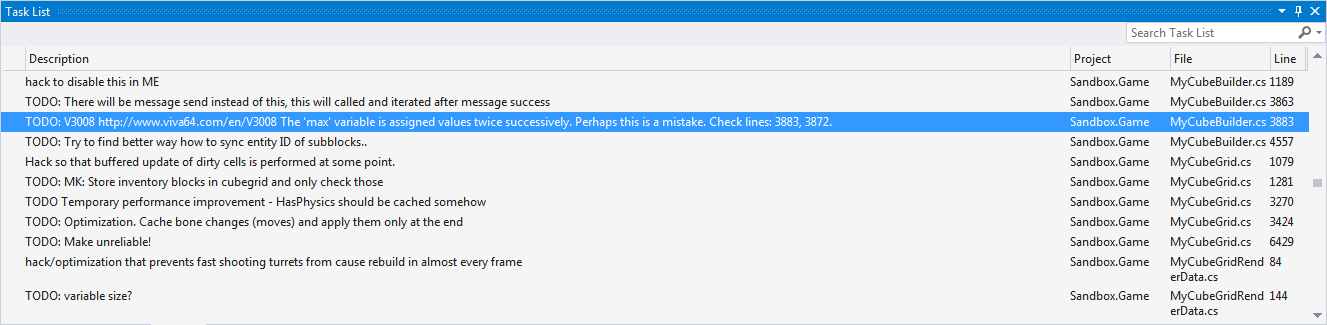
Figure 8 —Visual Studio Task List
The Task List Window could be accessed through the View->Other Windows->Task List menu. The TODO comments are displayed in the 'Comments' section of the window.
Was this page helpful?