
Get started with PVS-Studio in Visual Studio
- Watch, don't read (YouTube)
- Installing the plugin from Visual Studio Marketplace
- Entering a license
- Plugin settings
- Running PVS-Studio analysis
- Handling analysis results
- Keyboard shortcuts in the PVS-Studio plugin for Visual Studio
- Integration with Qt VS Tools plugin
- Useful links
The PVS-Studio plugin for Microsoft Visual Studio provides a user-friendly interface and static analysis capabilities. It has a wide range of additional features to handle analyzer warnings.
You can install the plugin from the official plugin repository or with the help of our installer for Windows. It is available on the download page.
Watch, don't read (YouTube)
Installing the plugin from Visual Studio Marketplace
To install the PVS-Studio plugin for Visual Studio from Marketplace, you need to open Manage Extensions via Extensions -> Manage Extensions and enter PVS-Studio in the search bar. The search results contain the needed plugin:

After you click Download, the PVS-Studio installer for Windows automatically starts. It contains the plugin, the analyzer core, and additional tools.
The installer asks to close all active processes in the available IDEs and offers to choose plugins for all installed IDEs:

Entering a license
You need to enter the license after installation. See the documentation for more information about entering the license in Visual Studio.
Plugin settings
Besides Registration, PVS-Studio has other settings – let's discuss them in detail.
Common Analyzer Settings
The first option in the list is Common Analyzer Settings:
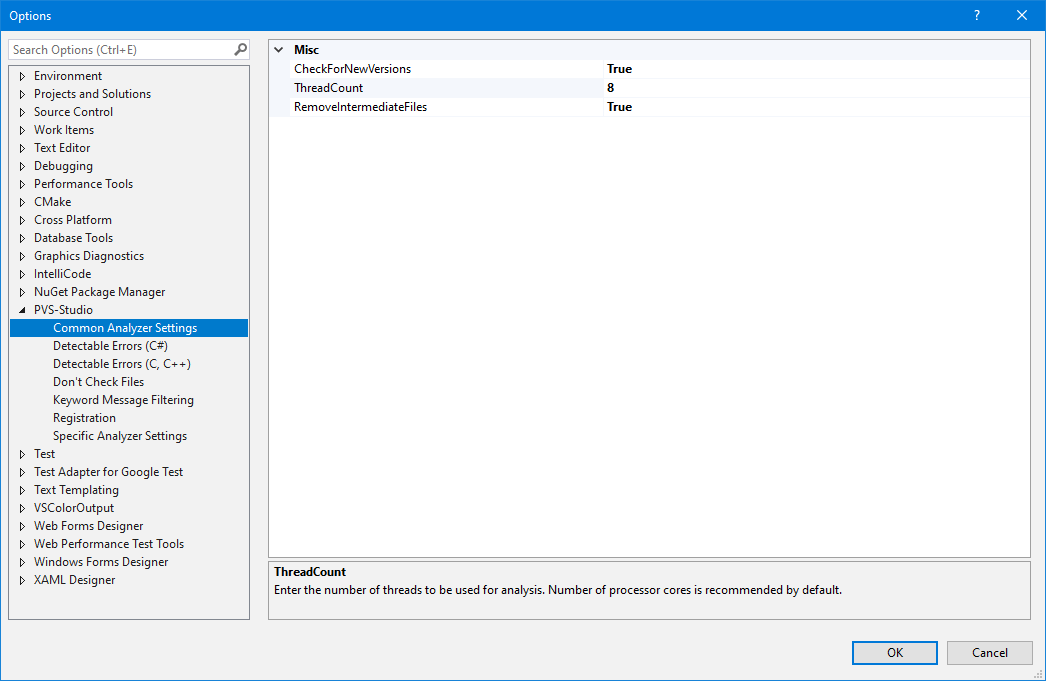
By default, optimal settings are set in this section. ThreadCount (the number of threads) is equal to the number of cores on the used processor.
If some issue is detected in the analyzer work, and you need to report us about it, use RemoveIntermediateFiles. If you select false, artifacts remain after the analysis, (preprocessed files and configuration files). They help to detect the issue.
Detectable Errors
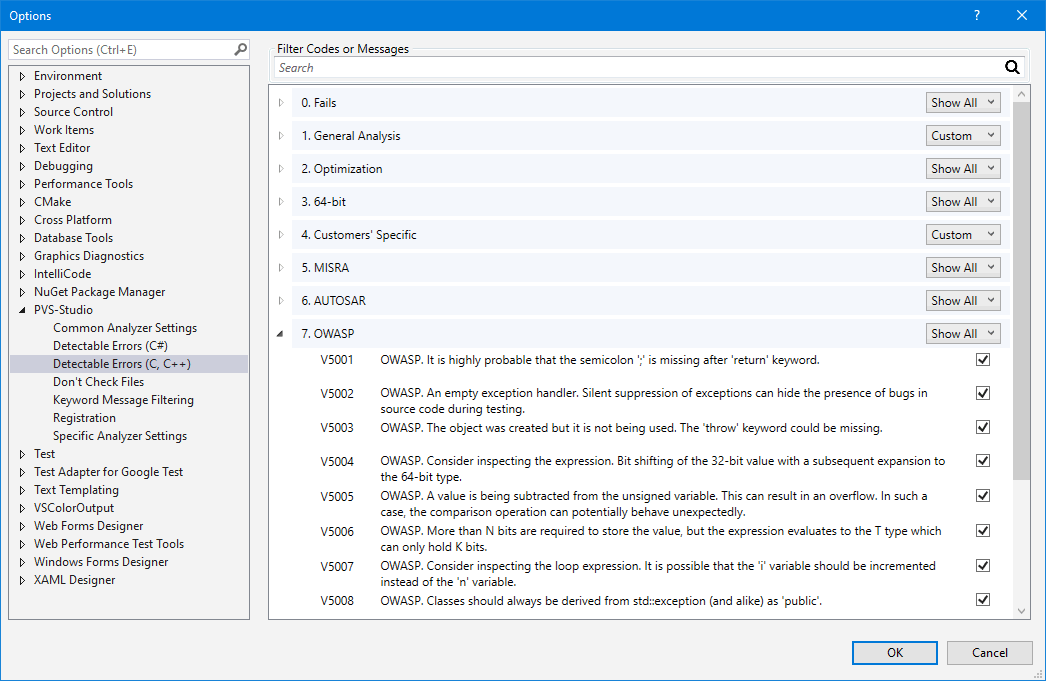
This option allows you to choose the warnings you want to receive. You can hide or show certain warnings or entire classes of diagnostics:
Don't Check Files
An extremely useful option. It helps to improve the quality and speed of analysis by excluding unnecessary files that, for example, do not directly relate to the project:
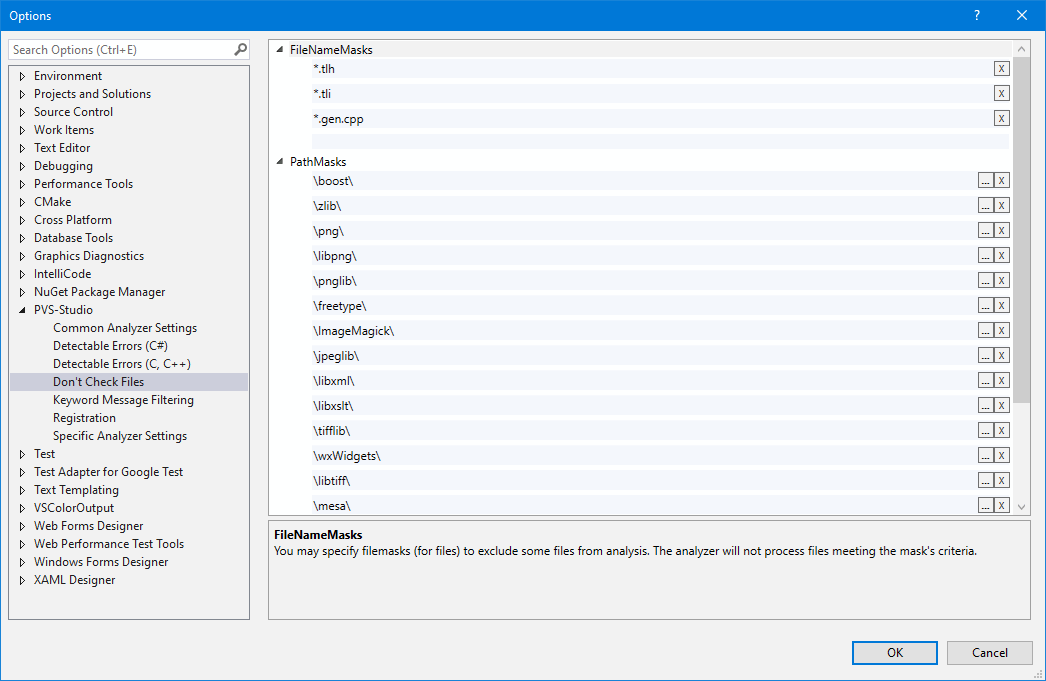
The most common excluded directories and extensions are specified by default. If you have, for example, warnings for third-party code, then you should add it to PathMasks.
For more information about Don't Check Files, see the corresponding documentation section.
Keyword Message Filtering
Using Keyword Message Filtering, you can specify keywords that you want to exclude from the analysis results:
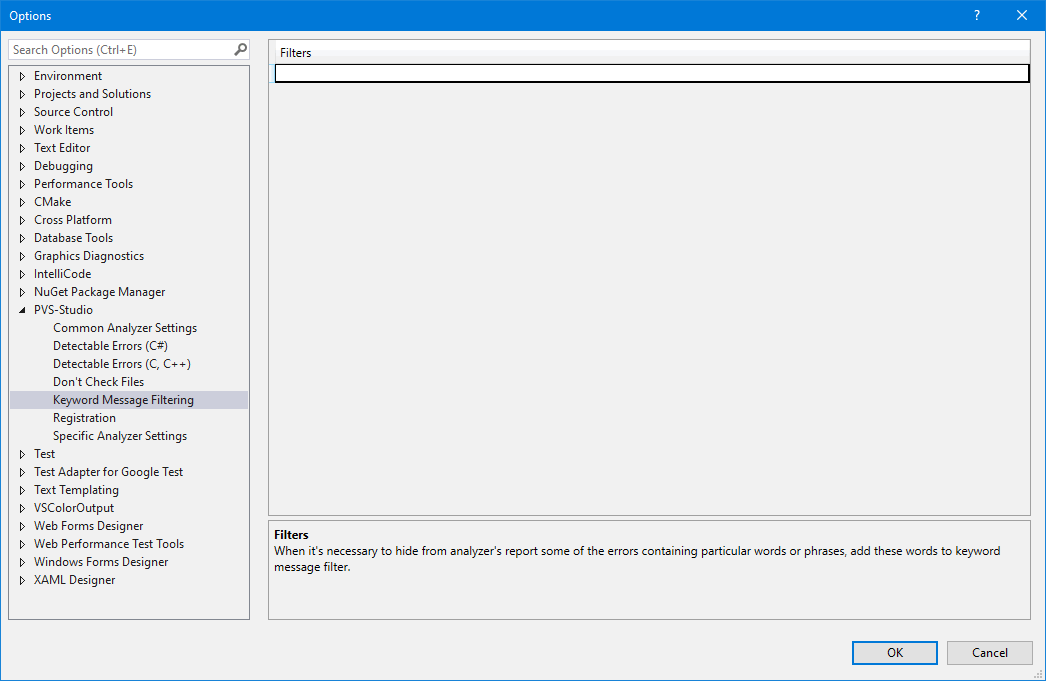
For example, you have error warnings related to printf, but you think that your code cannot contain such errors. In this case, add the printf keyword. Warnings containing the specified value are filtered immediately without rerunning the analysis.
Specific Analyzer Settings
By default, the plugin is configured to work in the most common conditions. However, if the project has specific features, you can additionally configure the analyzer with the help of Specific Analyzer Settings:

The additional settings are described in detail in a special documentation section.
Running PVS-Studio analysis
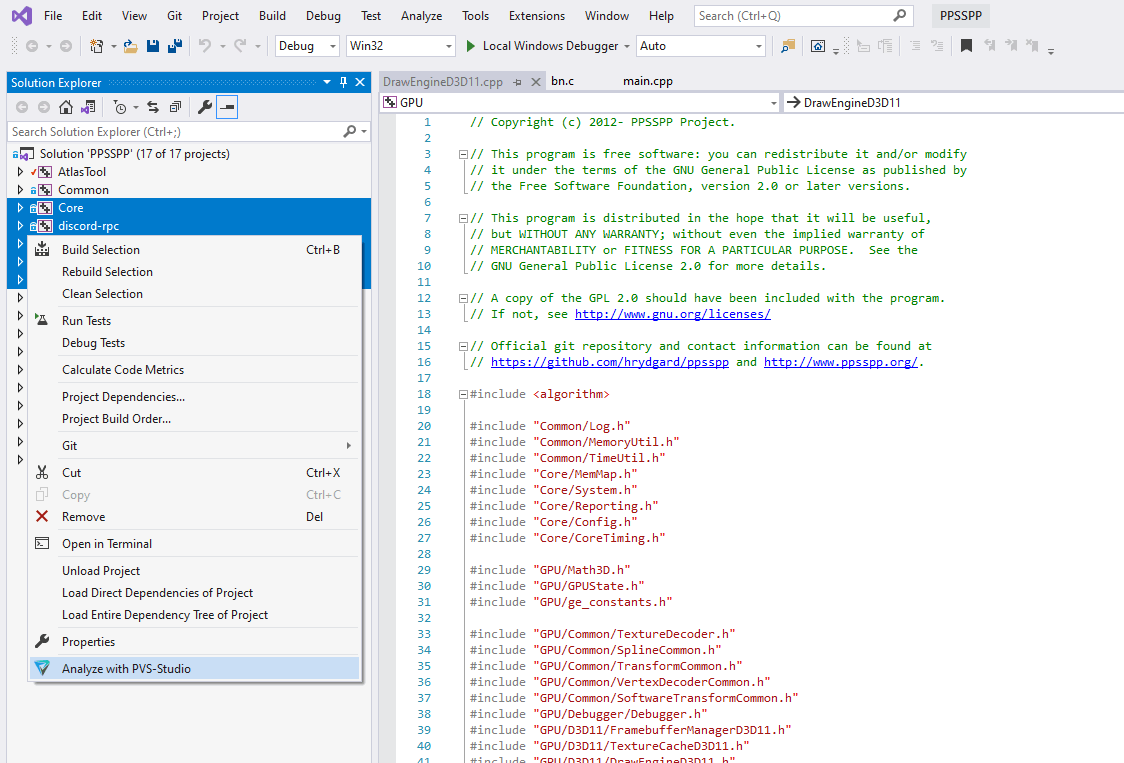
The PVS-Studio plugin supports the analysis of the entire solution and individual projects and files. To start the analysis, you can select needed files and projects and run the analysis via the context menu:
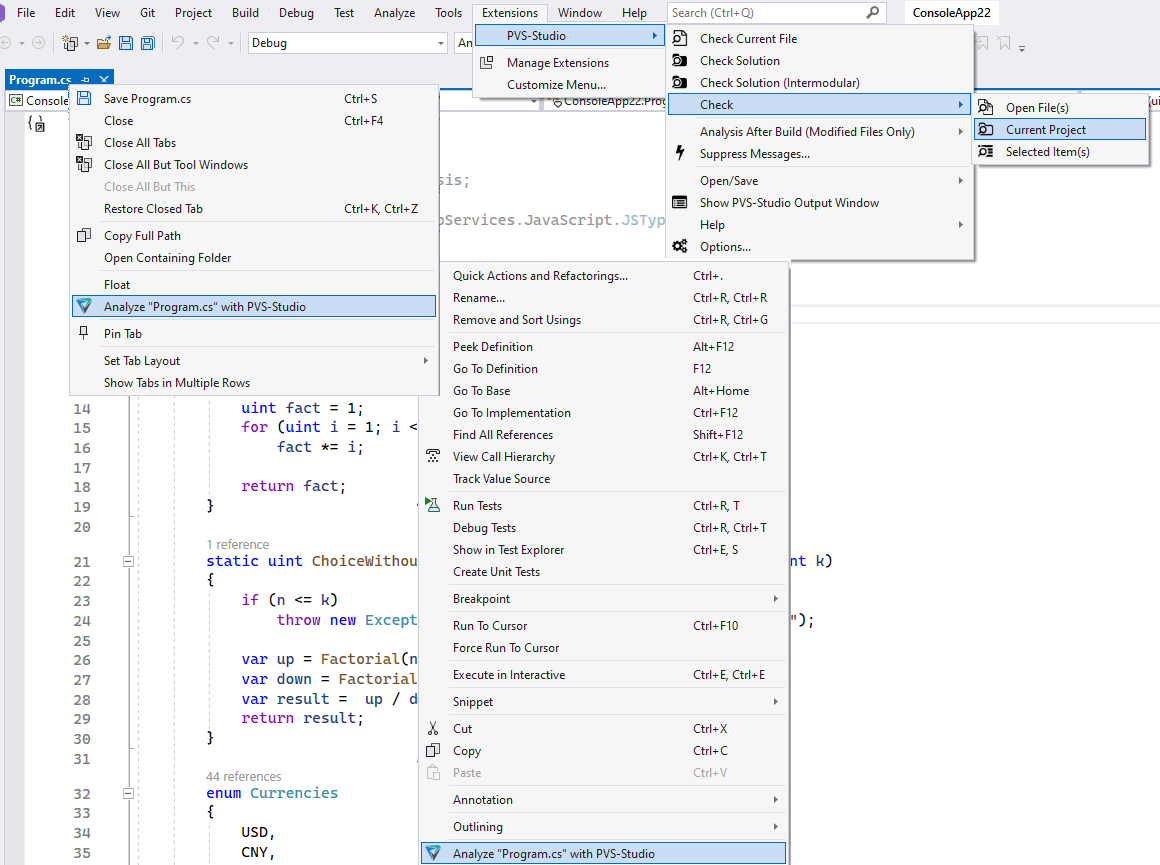
You can also run the analysis on the current file from:
- the PVS-Studio plugin menu;
- the context menu of the file;
- the context menu of the file header in the file editor.
Additionally, the "Check" menu item has several menu items for more specific analysis options:
The PVS-Studio plugin for Visual Studio allows checking projects and source files for C, C++, and C# languages. For C++, PVS-Studio can check standard Visual C++ projects that use MSBuild.
To check specific projects, such as, for example, NMake projects, you can use the compiler monitoring system.
Handling analysis results
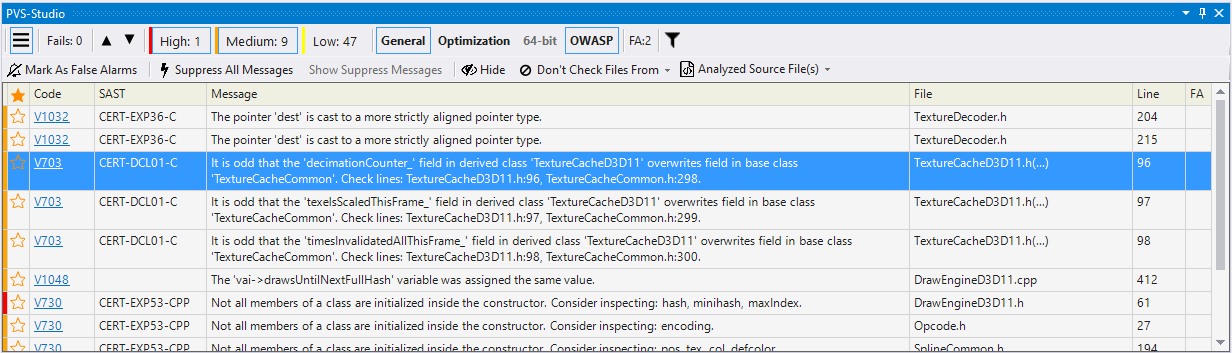
After the analysis, analysis results appear in the IDE:
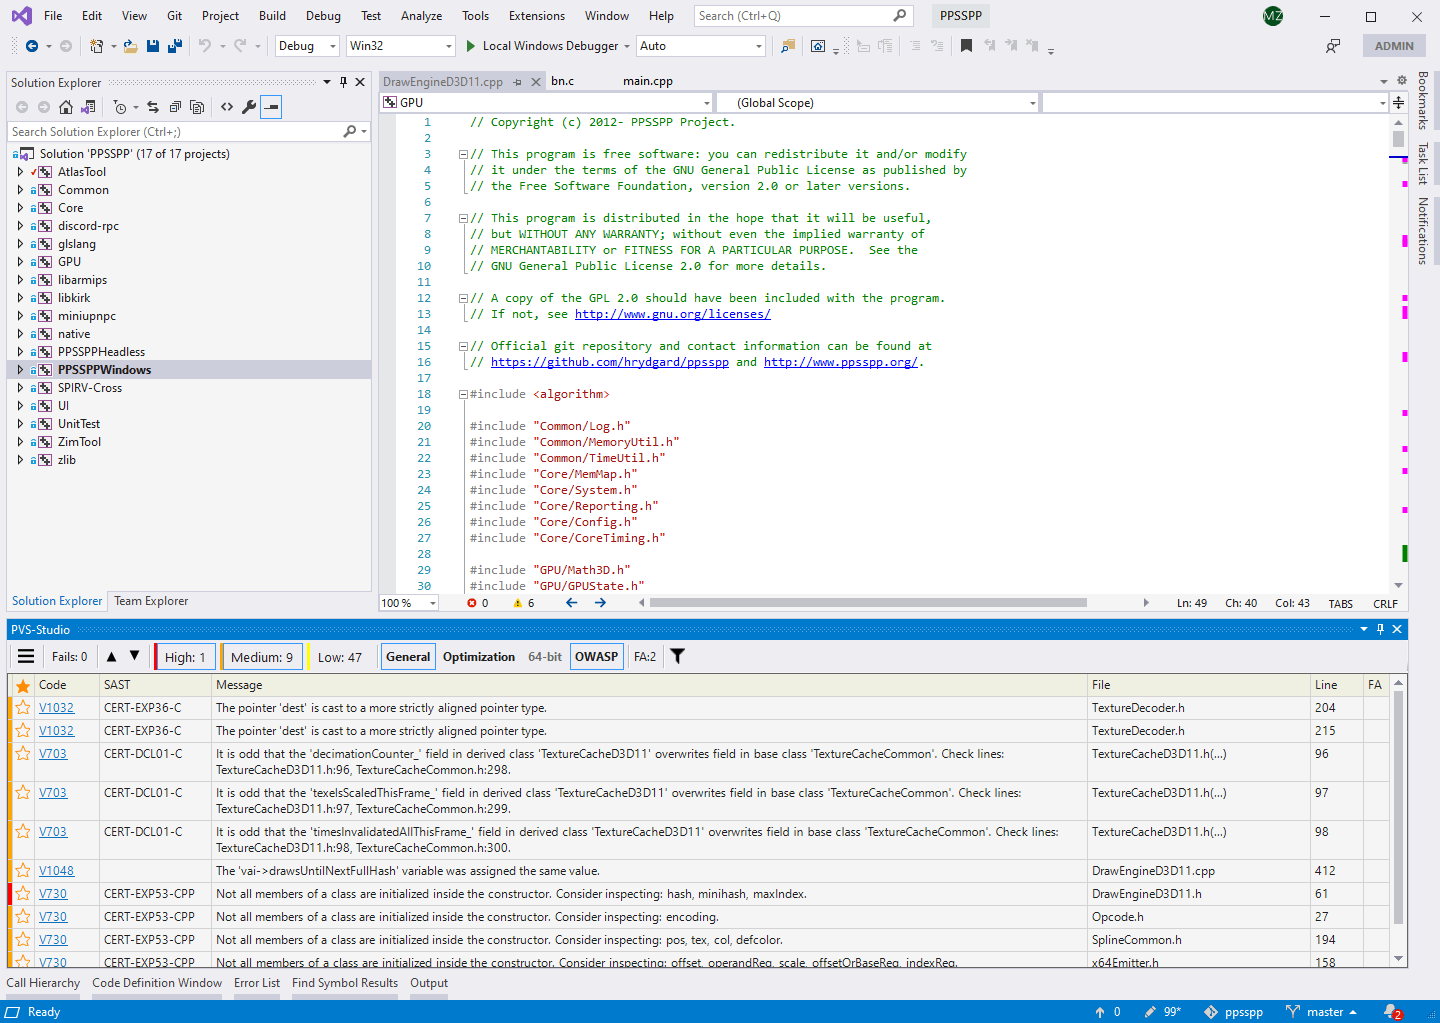
Here you can mark the warnings that interest you, suppress false positives, sort them into different categories, select certainty levels, open the documentation for diagnostics, and perform many other actions with warnings.
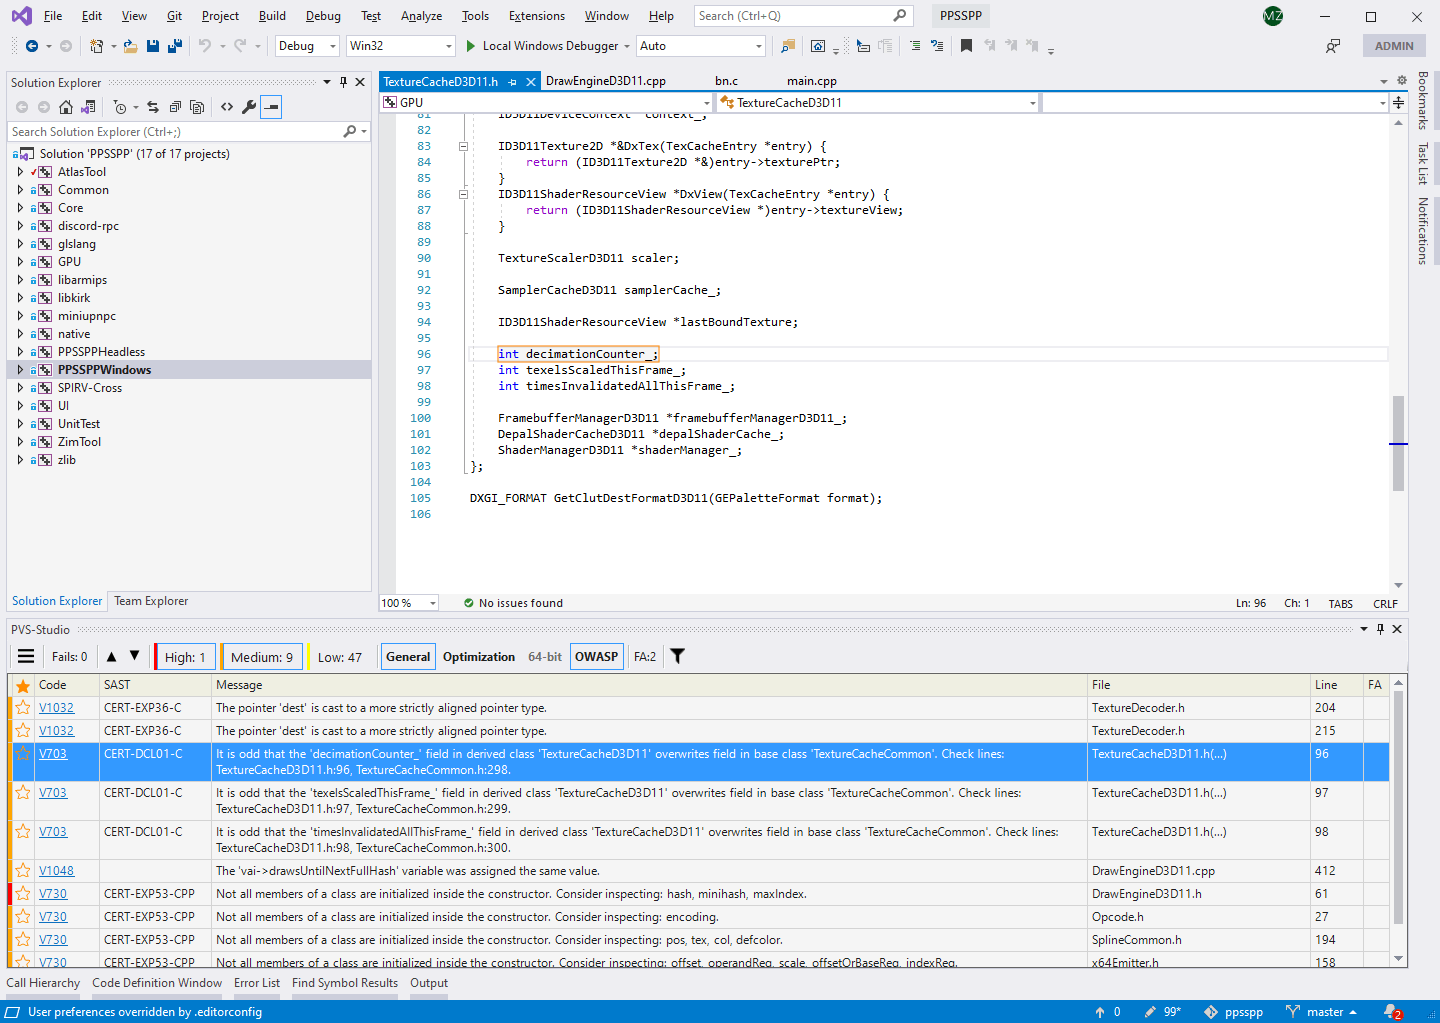
Double-clicking on a line allows you to view code fragment containing a suspicious place:
When you click on the hamburger button, an additional menu of the PVS-Studio panel opens:
For more information about handling the diagnostic messages, see the documentation.
Suppression of analyzer warnings in legacy code
Running the analyzer for the first time on a large project, you may receive lots of warnings. You definitely should write down the most exciting ones, and you can hide the rest of them with the help of suppression mechanism. After all, your code has already been tested and works correctly. It's unlikely that you find critical issues among issued warnings (however, this may also happen).
To suppress all warnings, select Suppress All Messages in the plugin's additional panel:
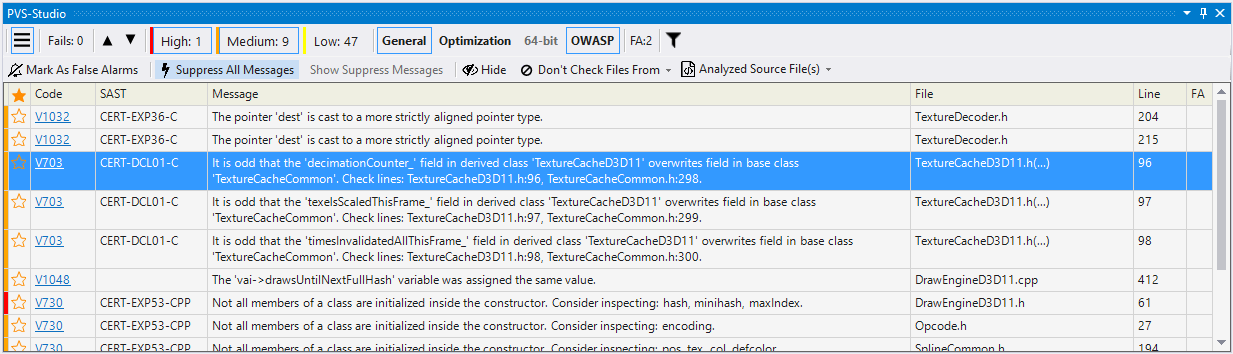
Then, they are added to special *.suppress files. The suppression mechanism takes into account neighboring lines. So, when code lines are moved, messages do not appear again. However, if you fix some place in the code next to the warning, then it is shown when the analysis runs again.
You can see a detailed description of the suppression mechanism and *.suppress in the documentation: Baselining analysis results (suppressing warnings for existing code).
You can also read the "How to introduce a static code analyzer in a legacy project and not to discourage the team" article.
Handling false positives
False positives may appear during the analysis. PVS-Studio provides a special suppression and filtering mechanism for such cases.
To mark a message as false, right-click on a warning line and select Mark selected messages as False Alarms:
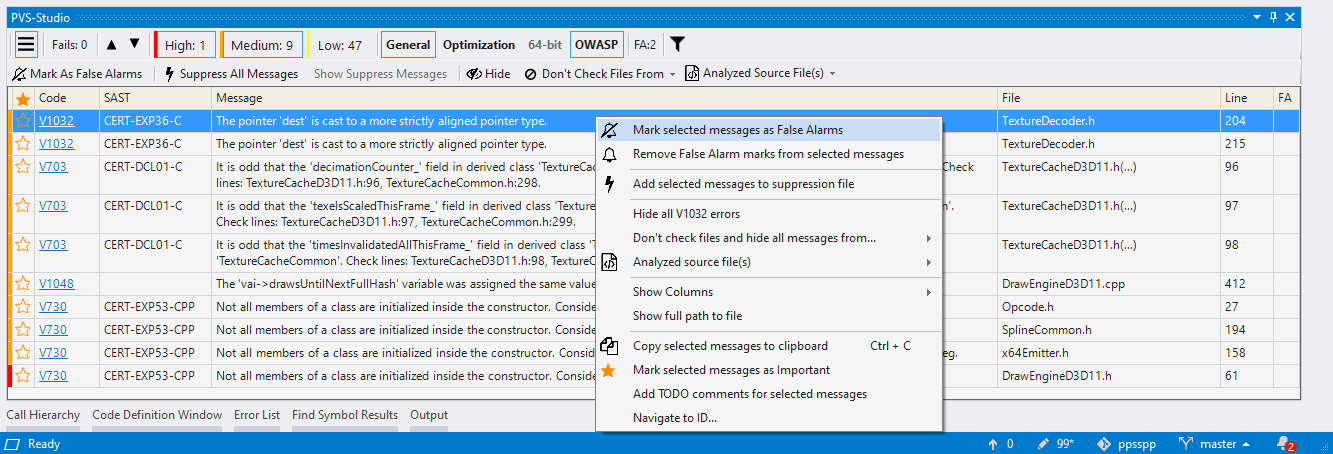
Then, a comment of the //-Vxxx type is added to a warning line. Here xxx is the number of the PVS-Studio diagnostic rule. You can also add such a comment to the code manually. The Remove False Alarm marks from selected messages command in the context menu helps you to remove the false alarm mark from selected messages.
If you don't want to add comments to the code, then you can use the suppression mechanism and add a warning to the *.suppress file. To do this, select the Add selected messages to suppression file option in the context menu:
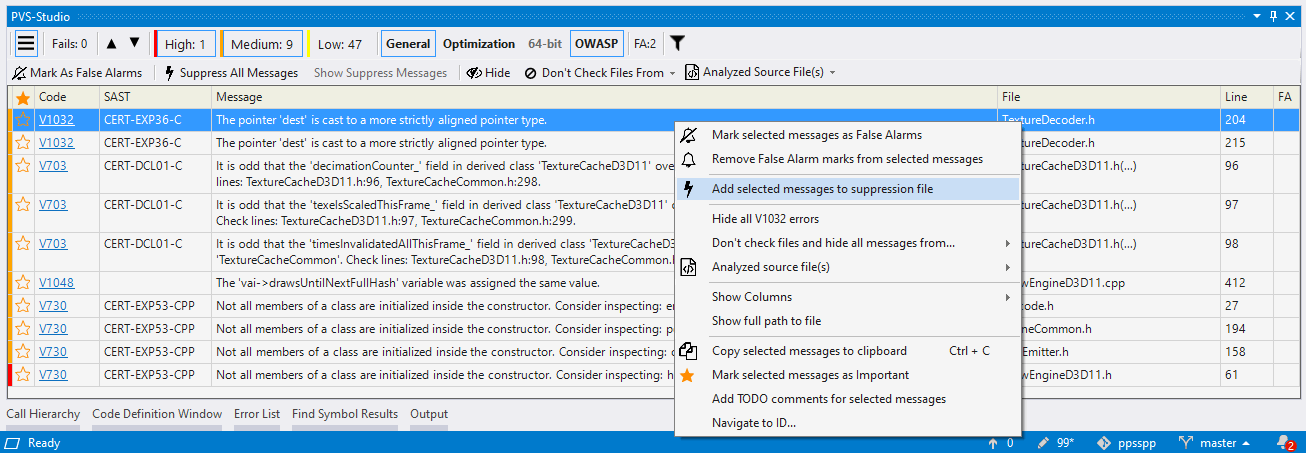
For more details about the suppression of false positive warnings, see the documentation: Suppression of false positive warnings.
View the analyzer's most interesting warnings
If you are new to the static analysis tool and would like to know what it can do, you can use the Best Warnings mechanism. This mechanism will show you the most important and reliable warnings.
To check out the analyzer's most interesting warnings, click on the 'Best' button, as shown in the screenshot below:
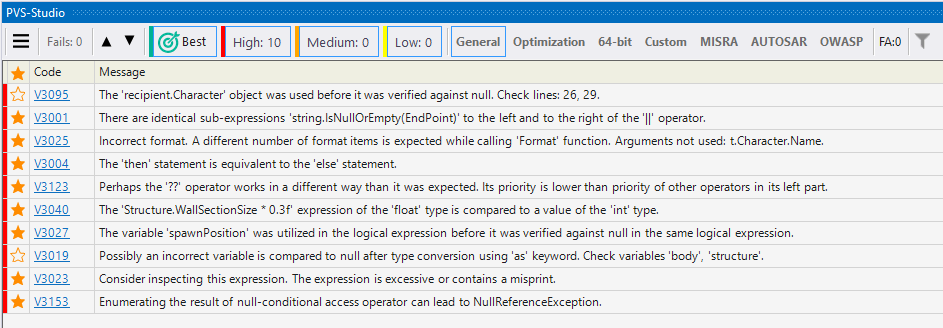
After that, the table with the results of the analysis will show maximum of ten of the most critical warnings of the analyzer.
Keyboard shortcuts in the PVS-Studio plugin for Visual Studio
The PVS-Studio plugin for Visual Studio has the analysis result window. This window has a dropdown menu that appears when you right-click on the analysis result window:

Some of these actions have keyboard shortcuts. Thus, you can perform them without using a mouse.
The arrow keys for navigating the analyzer's warnings also have shortcuts:
- move to the next message: Alt + [;
- move to the previous message: Alt + ].
Using shortcuts is helpful, since they speed up the analysis result processing. You can set and customize the shortcuts in settings: Tools -> Options -> Keyboard. To find shortcuts faster, enter 'PVS-Studio' in the search field of the Keyboard window.
Integration with Qt VS Tools plugin
At the moment, when analyzing projects built using the Qt VS Tools plugin, it is necessary to manually specify the paths to the Qt header files in the project properties. Otherwise, the analysis will not complete successfully, since the analyzer currently has no way to obtain information about the header files from the Qt VS Tools plugin.
The path to the header files can be obtained by taking the path to the installed Qt from Qt Version (Extensions → Qt VS Tools → Qt Versions) and appending \include to it. The resulting path must be added to the project property Additional Includes.
Useful links
- Incremental analysis mode in PVS-Studio
- Baselining analysis results (suppressing warnings for existing code)
- Suppression of false positive warnings
- How to display Best Warnings
Was this page helpful?