
Getting acquainted with the PVS-Studio static code analyzer on Windows
- Pros of using a static analyzer
- A brief overview PVS-Studio's capabilities
- System requirements and installation of PVS-Studio
- The basics of using PVS-Studio
- Work with a list of diagnostic messages
- Is it necessary to fix all the potential errors the analyzer informs about?
PVS-Studio is a static analyzer for C, C++, C# and Java code designed to assist programmers in searching for and fixing a number of software errors of different patterns. The analyzer can be used in Windows, Linux and macOS.
Working under Windows, the analyzer integrates into Visual Studio as a plugin, providing a convenient user interface for easy code navigation and error search. There is also a C and C++ Compiler Monitoring UI (Standalone.exe) available which is used independently of Visual Studio and allows analyzing files compiled with, besides Visual C++, such compilers as GCC (MinGW) and Clang. Command line utility PVS-Studio_Cmd.exe will allow to perform analysis of MSBuild / Visual Studio projects without a run of IDE or Compiler Monitoring UI, that will let, for instance, use the analyzer as a part of CI process.
PVS-Studio for Linux is a console application.
This document describes the basics of using PVS-Studio on Windows. To get information about working in Linux environment refer to articles "Installing and updating PVS-Studio on Linux" and "How to run PVS-Studio on Linux and macOS".
Pros of using a static analyzer
A static analyzer does not substitute other bug searching tools - it just complements them. Integrating a static analysis tool with the development process helps to eliminate plenty of errors at the moment when they are only "born", thus saving your time and resources on their subsequent elimination. As everyone knows, the earlier a bug is found, the easier it is to fix it. What follows from this is the idea that a static analyzer should be used regularly, for it is the only best way to get most of it.
A brief overview PVS-Studio's capabilities
Warning levels and diagnostic rule sets
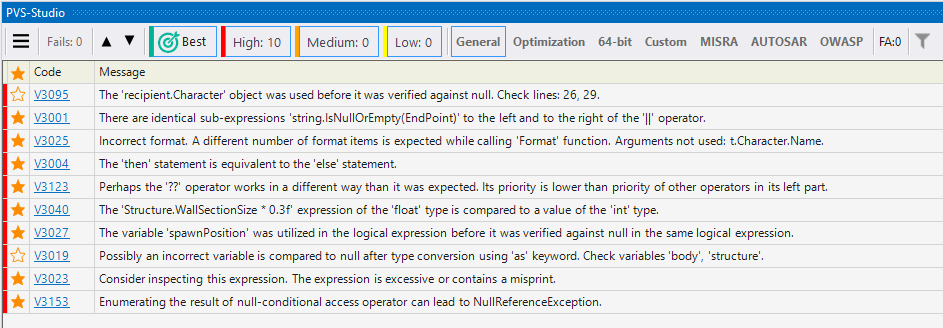
PVS-Studio divides all the warnings into 3 levels of certainty: High, Medium and Low. Some warnings refer to a special Fails category. Let's consider these levels in more detail:
- High(1) - warnings with the maximum level of certainty. Such warnings often indicate errors, requiring immediate correction.
- Medium(2) - errors with lower degree of certainty, which are still worth paying attention to.
- Low(3) - warnings with a minimum level of certainty, pointing to minor flaws in the code. Warnings of this level usually have a high percentage of false positives.
- Fails - internal warnings of the analyzer informing of some problems during the work. These are warnings of the analyzer errors (for example, messages V001, V003 ans so on) and any unprocessed output of utilities, used by the analyzer itself during the analysis (a preprocessor, a command preprocessor cmd), displayed in stdout/stderr. For example, Fails messages can be the message of a preprocessor about preprocessing errors of the source code, errors of access to files (a file doesn't exist, or it is blocked by an anti-virus) and so on.
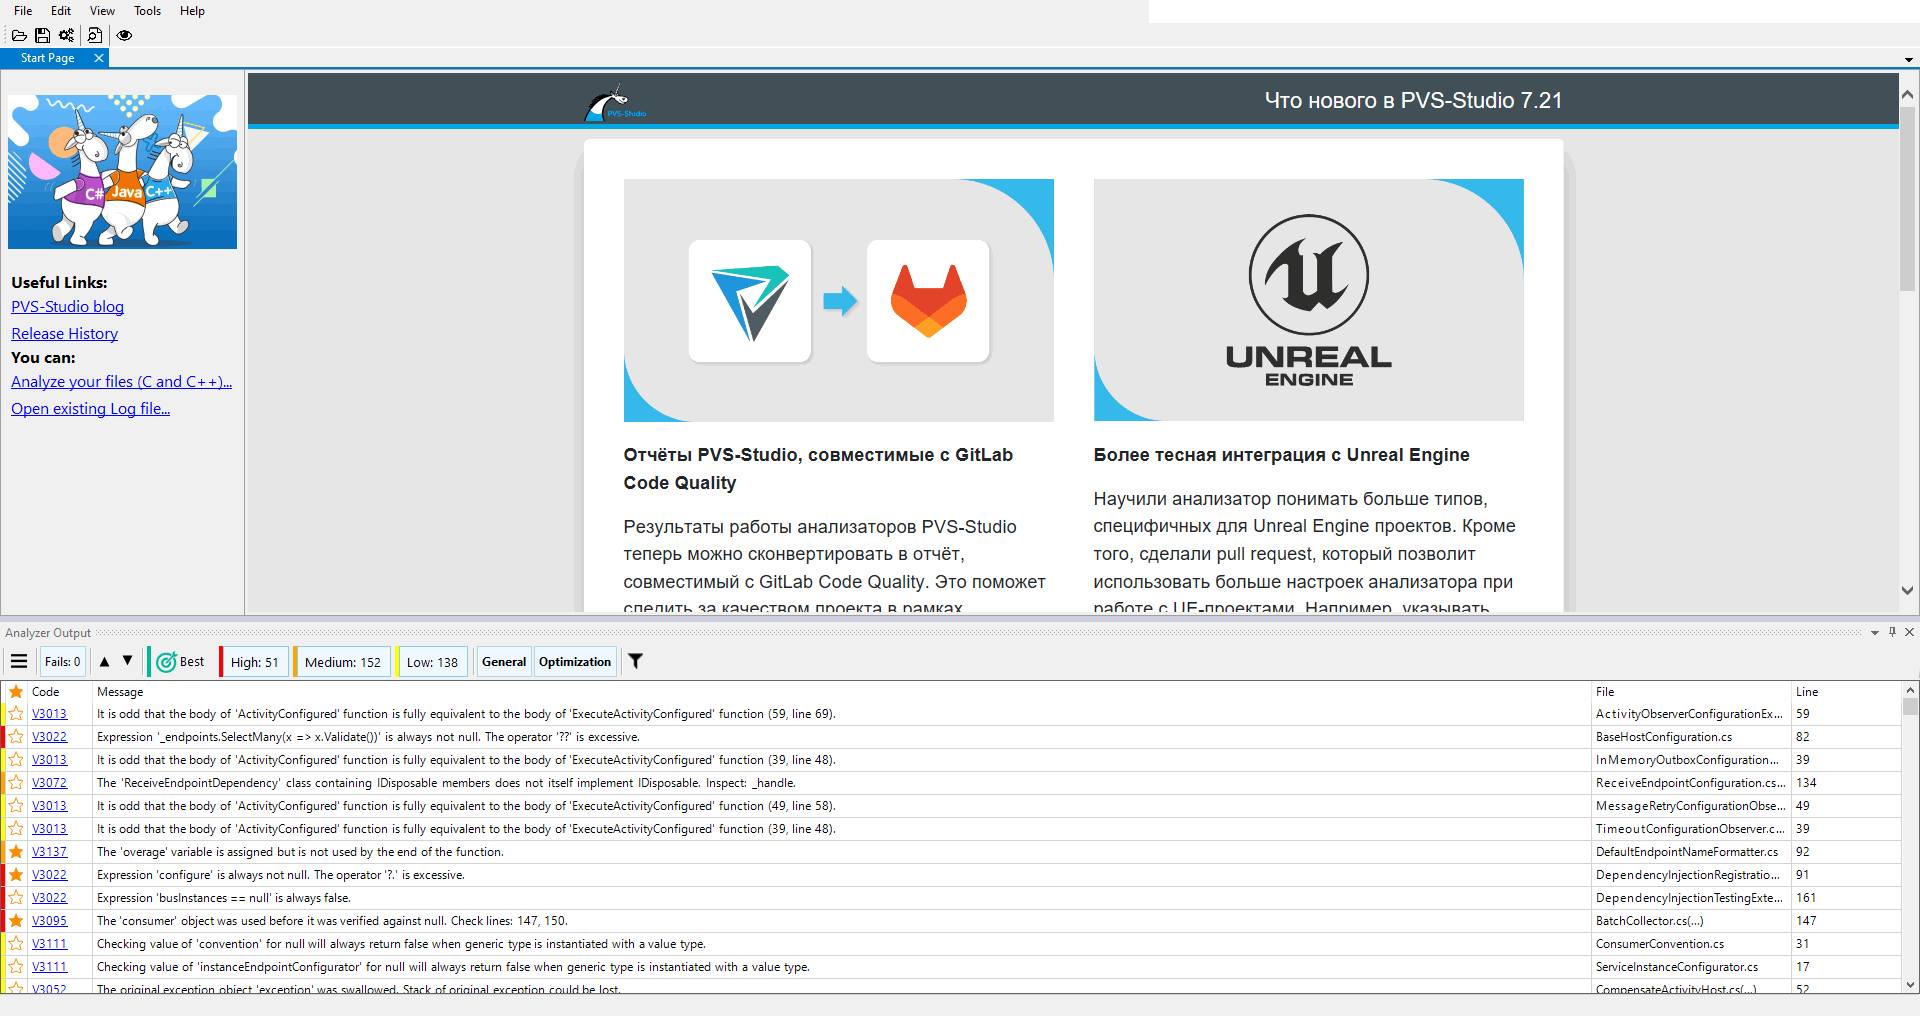
It should be borne in mind that a certain code of the error does not necessarily bind it to a particular level of certainty, and the distribution across the levels highly depends on the context, where they were generated. The output window of diagnostic messages in the plugin for Microsoft Visual Studio and the Compiler Monitoring UI has buttons of the levels, allowing to sort the warnings as needed.
You can make your work with the analyzer report even easier by using a mechanism that displays the most interesting warnings.
The analyzer has 5 types of diagnostic rules:
- General (GA) - General Analysis diagnostics. This is the main set of diagnostic rules in PVS-Studio.
- Optimization (OP) - Diagnostics of micro-optimization. These are tips concerning the improvement of efficiency and safety of the code.
- 64-bit (64) - diagnostics, allowing to detect specific errors, related to the development of 64-bit applications and migrating the code from a 32-bit platform to a 64-bit one.
- Customers' Specific (CS) - highly specialized diagnostics, developed by user requests. By default, this set of diagnostics is disabled.
- MISRA - a set of diagnostics, developed according to the MISRA standard (Motor Industry Software Reliability Association). This set of diagnostics is disabled by default.
Short description of the diagnostic groups (GA, OP, 64, CS, MISRA) with the numbers of certainty levels (1, 2, 3) are used for the shorthand notation, for example in the command line parameters. Example: GA: 1,2.
Switching a certain group of diagnostics rules set shows or hides the corresponding messages.
You may find the detailed list of diagnostic rules in the corresponding section of the documentation.
Analyzer messages can be grouped and filtered by various criteria To get more detailed information about a work with a list of analyzer warnings, please, refer to the article "Handling the diagnostic messages list".
PVS-Studio and Microsoft Visual Studio
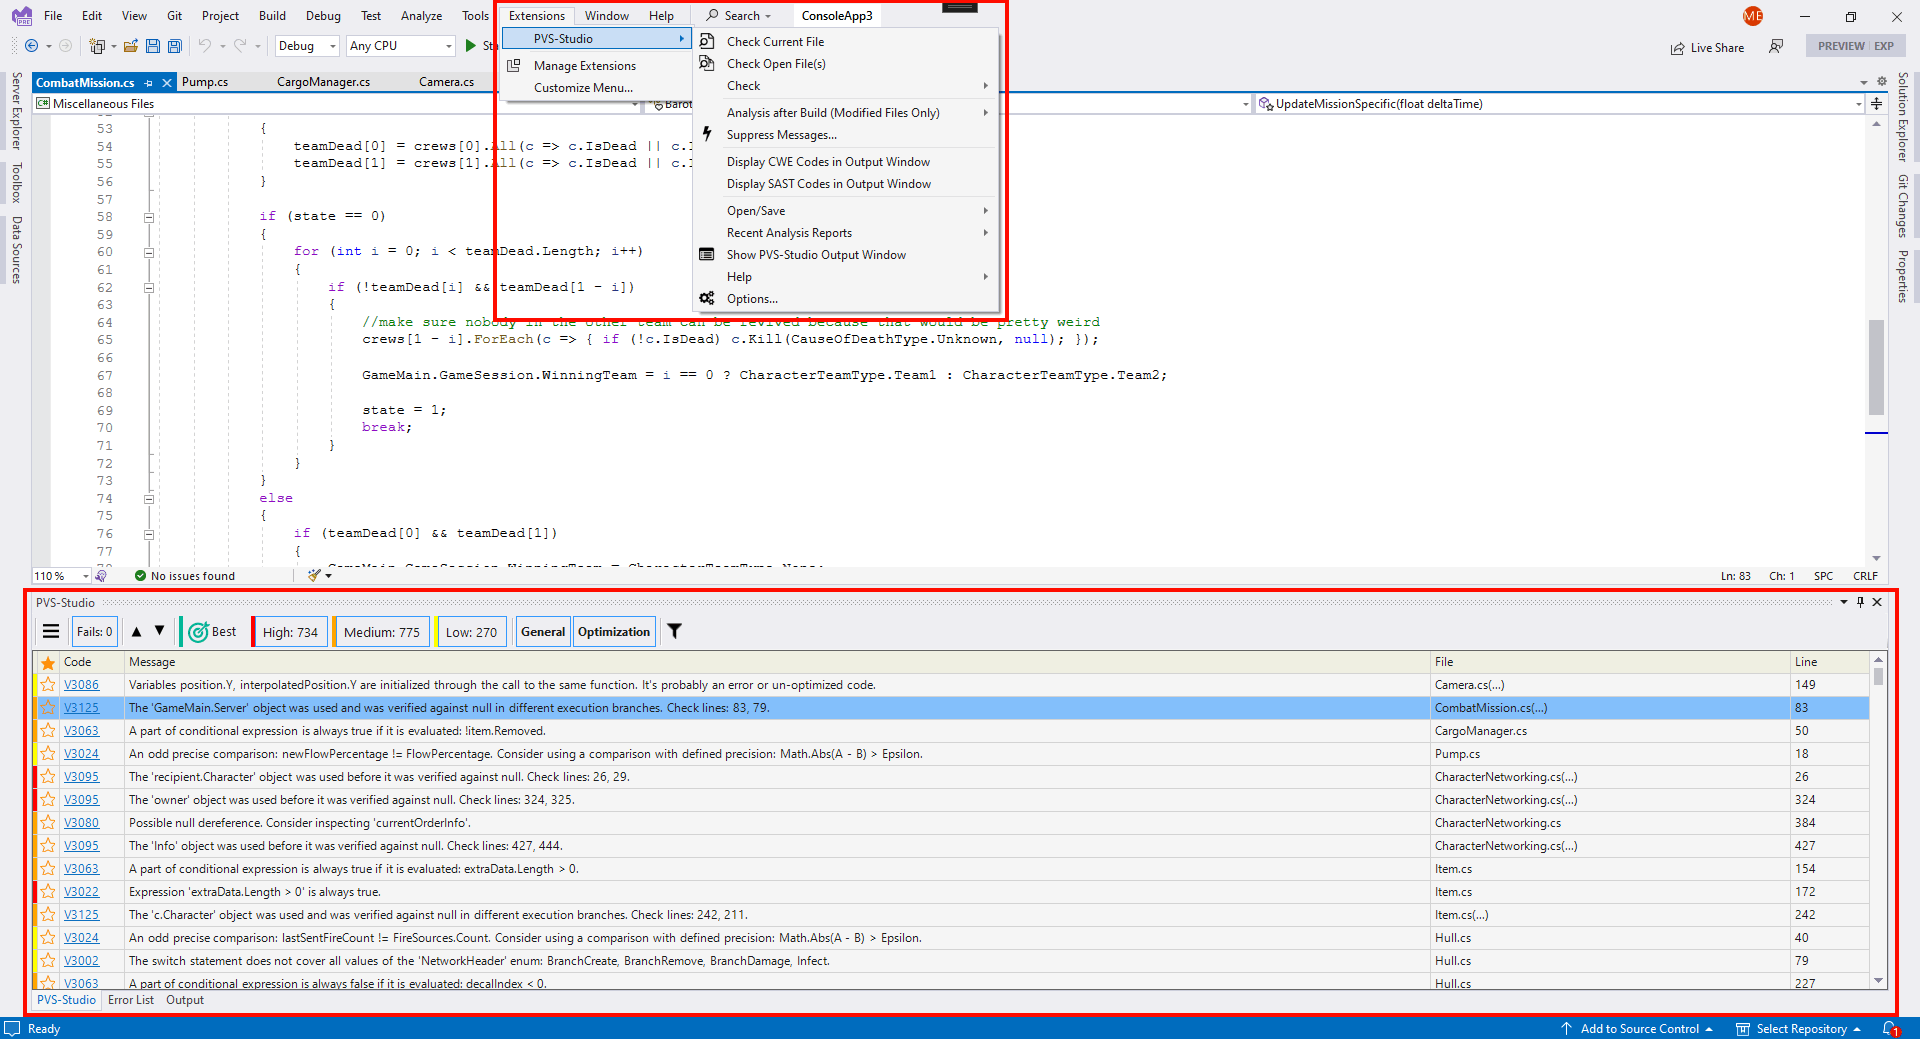
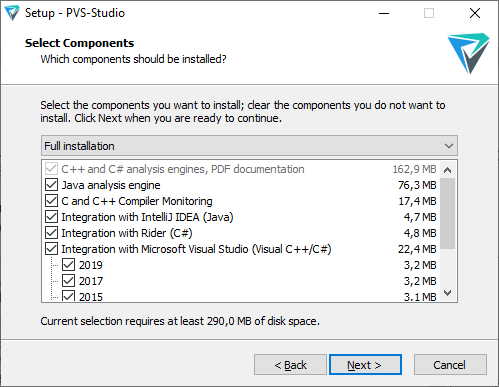
When installing PVS-Studio, you can choose which versions of the Microsoft Visual Studio IDE the analyzer should integrate with.
After deciding on all the necessary options and completing the setup, PVS-Studio will integrate into the IDE's menu. In the figure, you can see that the corresponding command has appeared in Visual Studio's menu, as well as the message output window.
In the settings menu, you can customize PVS-Studio as you need to make it most convenient to work with. For example, it provides the following options:
- Preprocessor selection;
- Exclusion of files and folders from analysis;
- Selection of the diagnostic message types to be displayed during the analysis;
- Plenty of other settings.
Most likely, you won't need any of those at your first encounter with PVS-Studio, but later, they will help you optimize your work with the tool.
The detailed description of the plugin features for the Visual Studio you can find in the documentation section "Get started with PVS-Studio in Visual Studio".
PVS-Studio and IntelliJ IDEA
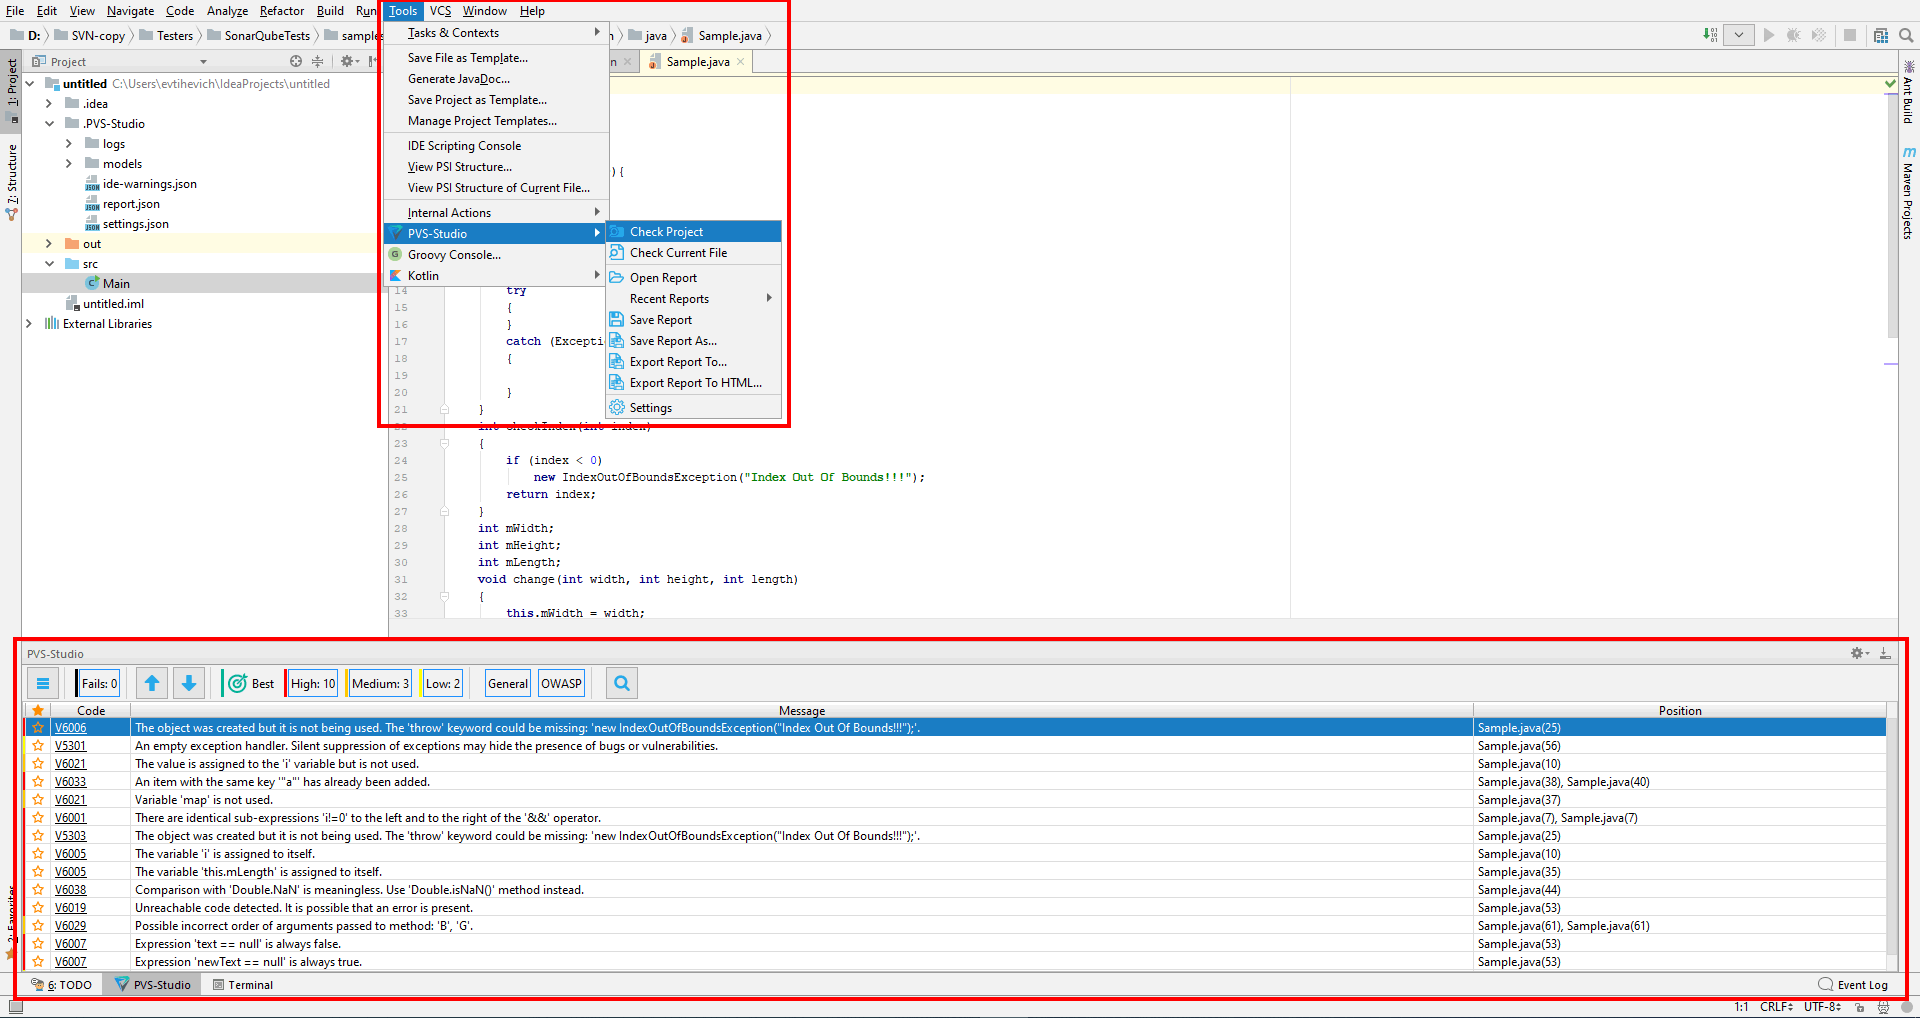
When installing the analyzer, it is possible to integrate the PVS-Studio plugin into the IntelliJ IDEA, which allows performing the analysis and handling analyzer reports right from the IDE.
After the installation, the plugin will be available in the menu 'Tools' ('Tools' > 'PVS-Studio'). The screenshot of IntelliJ IDEA with integrated PVS-Studio plugin is given below.
In the settings menu, is possible the disable diagnostic rules, exclude files / directories from the analysis, etc.
The documentation section "Direct use of Java analyzer from command line" describes operating features of the Java analyzer. It also provides alternative installation options, including installation of plugins for Maven, Gradle.
PVS-Studio and JetBrains Rider
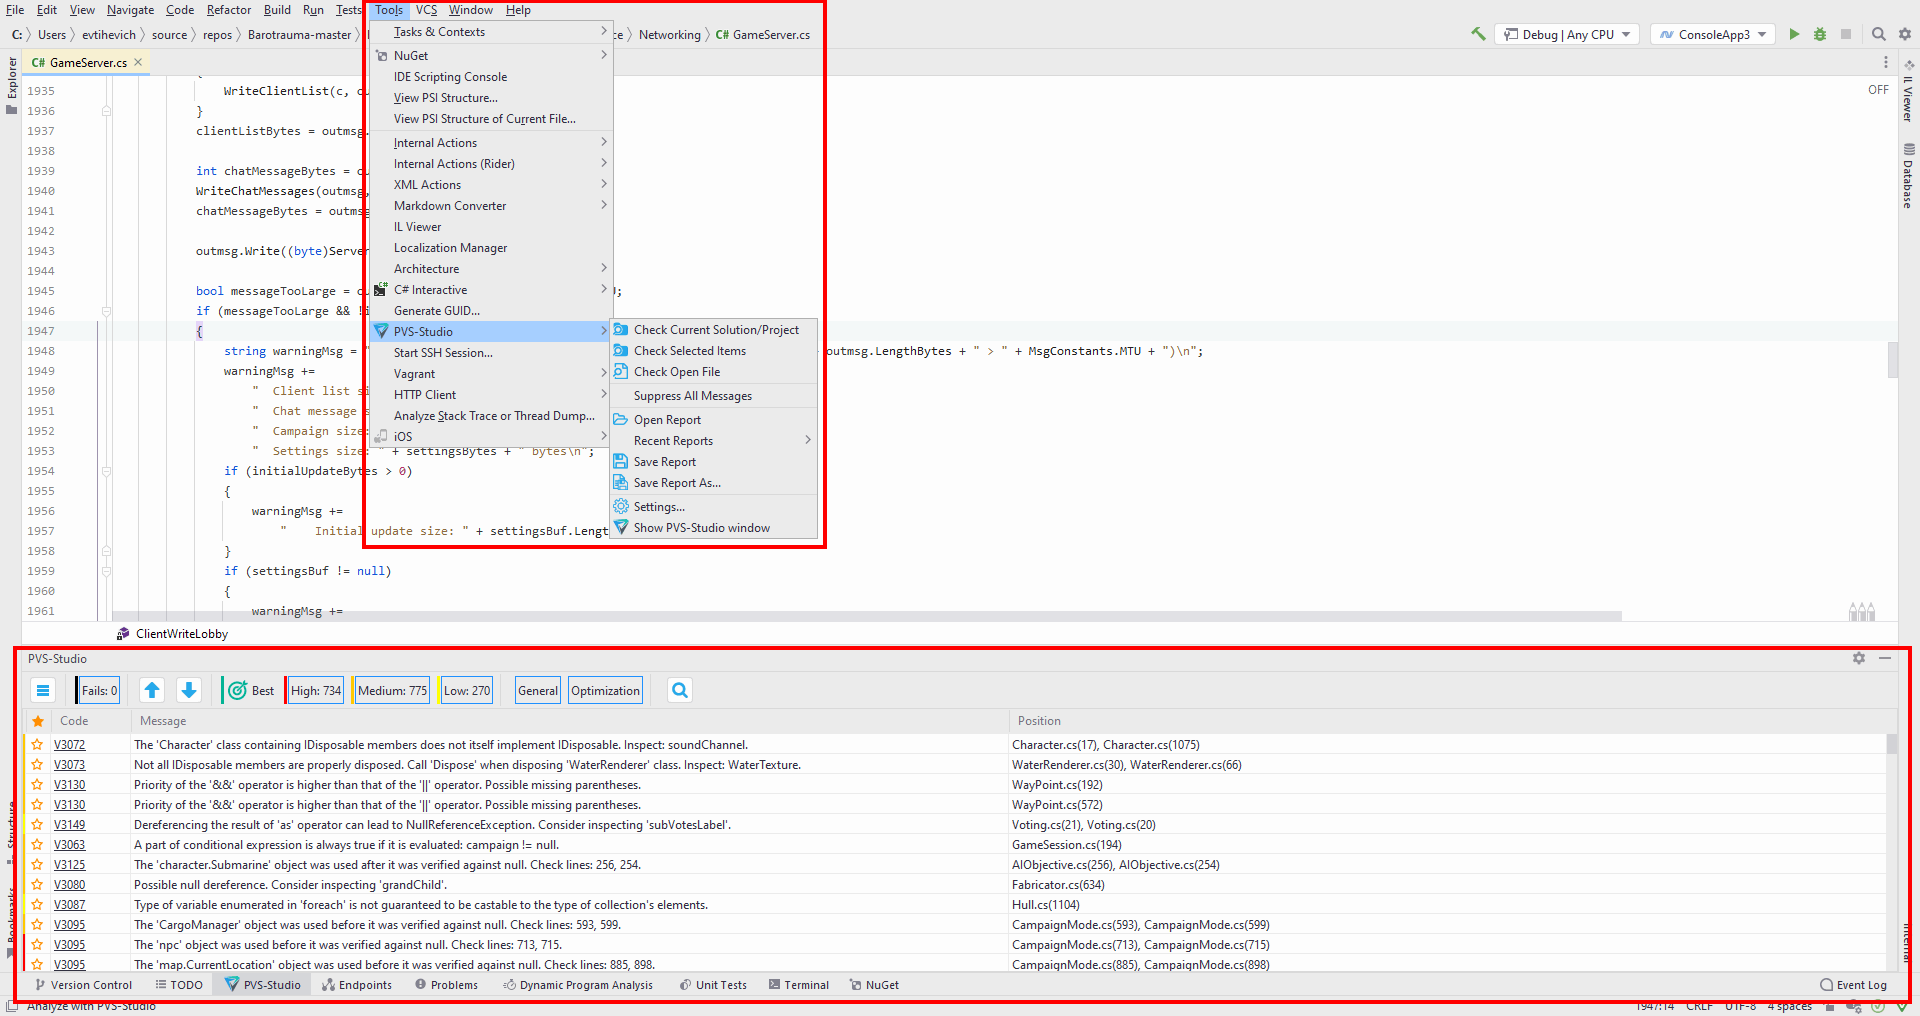
When installing the analyzer, it is possible to integrate the PVS-Studio plugin into the JetBrains Rider, which allows performing the analysis and handling analyzer reports right from the IDE.
The plugin is available in the 'Tools' menu after its installation. Current solution / project analysis can be done the following way: 'Tools' > 'PVS-Studio' > 'Check Current Solution/Project'.
The screenshot of JetBrains Rider with integrated PVS-Studio plugin is given below.
You can learn more about PVS-Studio plugin for IDE JetBrains Rider in the following documentation section: "Using PVS-Studio with JetBrains Rider".
C and C++ Compiler Monitoring UI (Standalone.exe)
PVS-Studio can be used independently of the Microsoft Visual Studio IDE. The Compiler Monitoring UI allows analyzing projects while building them. It also supports code navigation through clicking on the diagnostic messages, and search for code fragments and definitions of macros and data types. To learn more about how to work with the Compiler Monitoring UI, see the article "Viewing analysis results with C and C++ Compiler Monitoring UI".
PVS-Studio_Cmd.exe
PVS-Studio_Cmd.exe is a tool, which enables the analysis of Visual Studio solutions (.sln), as well as Visual C++ and Visual C# projects (.vcxproj, .csproj) from the command line. This can be useful, for example, in the case of a need to integrate static analysis on the build server. PVS-Studio_Cmd.exe allows to perform as a full analysis of the target project, and incremental (analysis of files that have changed since the last build). View of return code of the utility work as a bitmask enables you to get detailed information on the results of the analysis and identify the problems, in case of their occurrence. Thus, using the PVS-Studio_Cmd.exe utility you can configure a scenario of static code analysis 'subtly' enough and embed it into the CI process. Using of PVS-Studio_Cmd.exe module is described in more detail in the section "Analyzing Visual C++ (.vcxproj) and Visual C# (.csproj) projects from the command line".
Help system and technical support
PVS-Studio provides an extensive help system on its diagnostic messages. This message database is accessible both from PVS-Studio's interface and at the official site. The message descriptions are accompanied by code samples with error examples, the error description, and available fixing solutions.
To open a diagnostic description, just click with the left mouse button on the diagnostic number in the message output window. These numbers are implemented as hyperlinks.
Technical support for PVS-Studio is carried out via e-mail. Since our technical support is delivered by the tool developers themselves, our users can promptly get responses to a wide variety of questions.
System requirements and installation of PVS-Studio
PVS-Studio integrates into Microsoft Visual Studio 2022, 2019, 2017, 2015, 2013, 2012, 2010 development environments. You may learn about the system requirements for the analyzer in the corresponding section of the documentation.
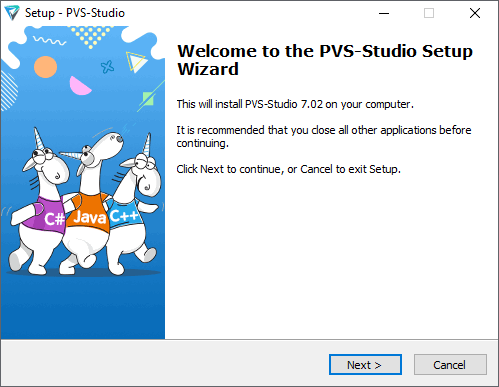
After you obtain the PVS-Studio installation package, you may start installing the program.
After approval of the license agreement, integration options will be presented for various supported versions of Microsoft Visual Studio. Integration options which are unavailable on a particular system will be greyed-out. In case different versions of the IDE or several IDEs are present on the system, it is possible to integrate the analyzer into every version available.
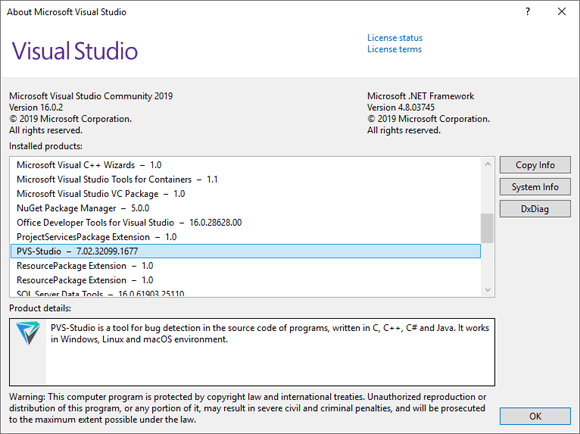
To make sure that the PVS-Studio tool was correctly installed, you may open the About window (Help/About menu item). The PVS-Studio analyzer must be present in the list of installed components.
The basics of using PVS-Studio
When working in the Visual Studio IDE, you can run different types of the analysis - at the solution, project file, the selected items, etc. For example, the analysis solutions run is executed as follows: "PVS-Studio -> Check -> Solution".
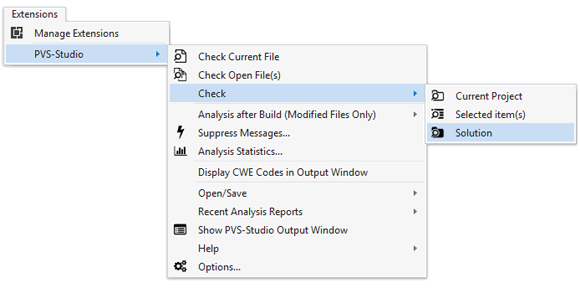
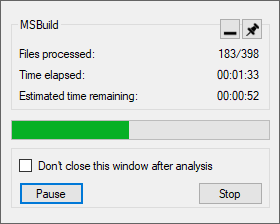
After launching the verification, the progress bar will appear with the buttons Pause (to pause the analysis) and Stop (to terminate the analysis). Potentially dangerous constructs will be displayed in the list of detected errors during the analysis procedure.
The term "a potentially dangerous construct" means that the analyzer considers a particular code line a defect. Whether this line is a real defect in an application or not is determined only by the programmer who knows the application. You must correctly understand this principle of working with code analyzers: no tool can completely replace a programmer when solving the task of fixing errors in programs. Only the programmer who relies on his knowledge can do this. But the tool can and must help him with it. That is why the main task of the code analyzer is to reduce the number of code fragments the programmer must look through and decide what to do with them.
Work with a list of diagnostic messages
in real large projects, there will be not dozens but hundreds or even thousands of diagnostic messages and it will be a hard task to review them all. To make it easier, the PVS-Studio analyzer provides several mechanisms. The first mechanism is filtering by the error code. The second is filtering by the contents of the diagnostic messages' text. The third is filtering by file paths. Let's examine examples of using filtering systems.
Suppose you are sure that the diagnostic messages with the code V112 (using magic numbers) are never real errors in your application. In this case you may turn off the display of these diagnostic warnings in the analyzer's settings:
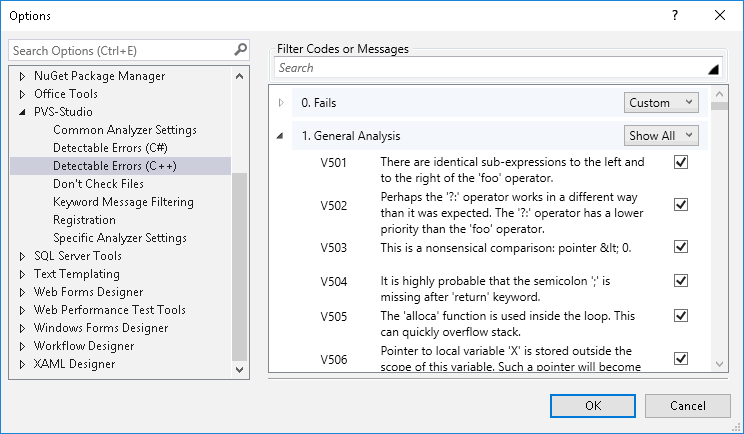
After that, all the diagnostic warnings with the code V112 will disappear from the error list. Note that you do not need to restart the analyzer. If you turn on these messages again, they will appear in the list without relaunching the analysis as well.
Now let's look at another option - a text-based diagnostic messages filtering. Let's look at an example of analyzer warning and code on which it was issued:
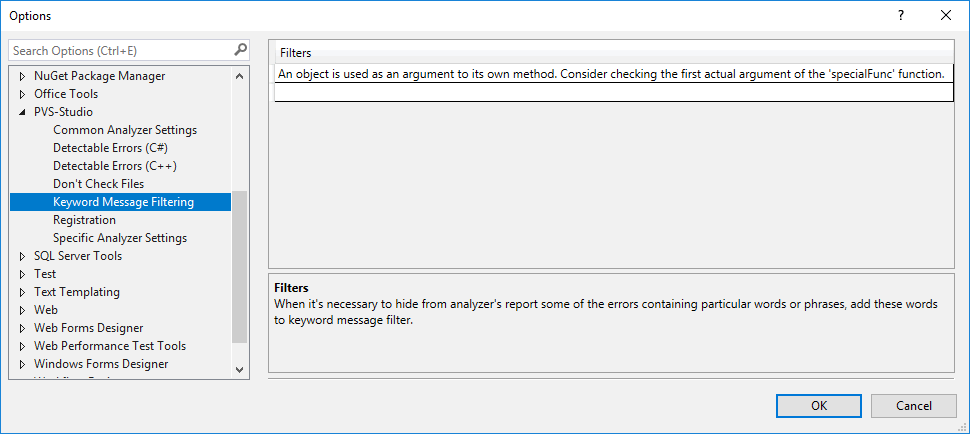
obj.specialFunc(obj);Analyzer warning: V678 An object is used as an argument to its own method. Consider checking the first actual argument of the 'specialFunc' function.
The analyzer found it suspicious that the same object is passed as an argument to from which this method is called. A programmer, as opposed to the analyzer may be aware of what usage of this method is acceptable. Therefore, you might need to filter out all such warnings. You can do this by adding the related filter in settings "Keyword Message Filtering".
After that, all the diagnostic messages whose text contains that expression will disappear from the error list, without the necessity of restarting the code analyzer. You may get turn them on back by simply deleting the expression from the filter.
The last mechanism of reducing the number of diagnostic messages is filtering by masks of project files' names and file paths.
Suppose your project employs the Boost library. The analyzer will certainly inform you about potential issues in this library. But if you are sure that these messages are not relevant for your project, you may simply add the path to the folder with Boost on the page "Don't check files":
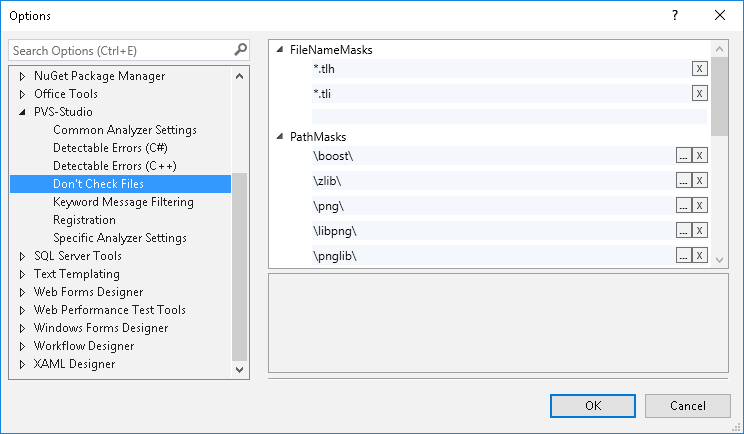
After that diagnostic messages related to files in this folder will not be displayed.
Also, PVS-Studio has the "Mark as False Alarm" function. It enables you to mark those lines in your source code which cause the analyzer to generate false alarms. After marking the code, the analyzer will not produce diagnostic warnings on this code. This function makes it more convenient to use the analyzer permanently during the software development process when verifying newly written code.
Thus, in the following example, we turned off the diagnostic messages with the code V640:
for (int i = 0; i < m; ++i)
  for (int j = 0; j < n; ++j)
    matrix[i][j] = Square(i) + 2*Square(j);
  cout << "Matrix initialization." << endl; //-V640
....
This function is described in more detail in the section "Suppression of False Alarms".
There are also some other methods to influence the display of diagnostic messages by changing the code analyzer's settings but they are beyond the scope of this article. We recommend you to refer to the documentation on the code analyzer's settings.
Is it necessary to fix all the potential errors the analyzer informs about?
When you have reviewed all the messages generated by the code analyzer, you will find both real errors and constructs which are not errors. The point is that the analyzer cannot detect 100% exactly all the errors in programs without producing the so called "false alarms". Only the programmer who knows and understands the program can determine if there is an error in each particular case. The code analyzer just significantly reduces the number of code fragments the developer needs to review.
So, there is certainly no reason for correcting all the potential issues the code analyzer refers to.
Suppression mechanisms of individual warnings and mass analyzer messages suppression are described in the articles "Suppression of False Alarms" and "Mass suppression of analyzer messages".
Was this page helpful?