
Build-system independent analysis (C and C++)
- Introduction
- Working principles
- Getting started with CLMonitor.exe
- Saving compilation monitoring dump and running analysis from this dump
- Using the compilation monitoring system in Visual Studio Code on Windows
- Using compiler monitoring from UI client (Standalone.exe)
- Compiler monitoring from Visual Studio
- Specifics of the CLMonitor.exe use with Incredibuild
- Specifics of monitoring a build process of IAR Embedded Workbench for ARM
- Incremental analysis
- Intermodular analysis mode
- Specification of individual files for analysis
- Wrap Compilers interception mode
- Conclusion
To learn about the monitoring process on Linux, click here (the "Any project (only for Linux)" section).
Introduction
The PVS-Studio compiler monitoring system (CLMonitoring) was designed for "seamless" integration of the PVS-Studio static analyzer into any build system under Windows that employs one of the preprocessors supported by the PVS-Studio.exe command-line analyzer (Visual C++, GCC, Clang, Keil MDK ARM Compiler 5/6, IAR C/C++ Compiler for ARM) for compilation.
To perform correct analysis of the source C/C++ files, the PVS-Studio.exe analyzer needs intermediate .i files which are actually the output of the preprocessor containing all the headers included into the source files and expanded macros. This requirement defines why one can't "just take and check" the source files on the disk - besides these files themselves, the analyzer will also need some information necessary for generating those .i files. Note that PVS-Studio doesn't include a preprocessor itself, so it has to rely on an external preprocessor in its work.
As the name suggests, the compiler monitoring system is based on "monitoring" compiler launches when building a project, which allows the analyzer to gather all the information essential for analysis (that is, necessary to generate the preprocessed .i files) of the source files being built. In its turn, it allows the user to check the project by simply rebuilding it, without having to modify his build scripts in any way.
This monitoring system consists of a compiler monitoring server (the command-line utility CLMonitor.exe) and UI client (Standalone.exe), and it is responsible for launching the analysis (CLMonitor.exe can be also used as a client when launched from the command line).
In the default mode, the system doesn't analyze the hierarchy of the running processes; instead, it just monitors all the running processes in the system. It means that it will also know if a number of projects are being built in parallel and monitor them.
CLMonitor.exe can monitor only compiler runs, that have been generated by the specified (by PID) parent process. Such operational mode is provided for the case, when several projects are simultaneously built, but you need to monitor compiler runs only for a specific project or solution. Child processes monitoring mode will be described below.
Working principles
CLMonitor.exe server monitors launches of processes corresponding to the target compiler (for example cl.exe for Visual C++ and g++.exe for GCC) and collects information about the environment of these processes. Monitoring server will intercept compiler invocations only for the same user it was itself launched under. This information is essential for a correct launch of static analysis to follow and includes the following data:
- the process main folder
- the full process launch string (i.e. the name and all the launch arguments of the exe file)
- the full path to the process exe file
- the process environment system variables
Once the project is built, the CLMonitor.exe server must send a signal to stop monitoring. It can be done either from CLMonitor.exe itself (if it was launched as a client) or from Standalone's interface.
When the server stops monitoring, it will use the collected information about the processes to generate the corresponding intermediate files for the compiled files. And only then the PVS-Studio.exe analyzer itself is launched to carry out the analysis of those intermediate files and output a standard PVS-Studio's report you can work with both from the Standalone version and any of the PVS-Studio IDE plugins.
Getting started with CLMonitor.exe
Note: in this section, we will discuss how to use CLMonitor.exe to integrate the analysis into an automated build system. If you only to check some of your projects manually, consider using the UI version of C and C++ Compiler Monitoring (Standalone.exe) as described below.
CLMonitor.exe is a monitoring server directly responsible for monitoring compiler launches. It must be launched prior to the project build process. After launching the server in monitoring mode, it will trace the invocations of supported compilers.
The supported compilers are:
- Microsoft Visual C++ (cl.exe) compilers
- C/C++ compilers from GNU Compiler Collection (gcc.exe, g++.exe) and its derivatives
- Clang (clang.exe) compiler and its derivatives
- Borland C++
- QCC
- Keil MDK ARM Compiler 5/6
- IAR C/C++ Compiler for ARM
- Texas Instruments ARM Compiler
- GNU Arm Embedded Toolchain
Note: when working with Cygwin, it is not possible to intercept compiler calls due to the specifics of this tool. In this case, we recommend using MinGW as an alternative.
But if you want the analysis to be integrated directly into your build system (or a continuous integration system and the like), you can't "just" launch the monitoring server because its process blocks the flow of the build process while active. That's why you need to launch CLMonitor.exe with the monitor argument in this case:
CLMonitor.exe monitorIn this mode, CLMonitor will launch itself in the monitoring mode and then terminate, while the build system will be able to continue its work. At the same time, the second CLMonitor process (launched from the first one) will stay running and monitoring the build process.
Since there are no consoles attached to the CLMonitor process in this mode, the monitoring server will - in addition to the standard stdin\stdout streams - output its messages into a Windows event log (Event Logs -> Windows Logs -> Application).
Also you can monitor only compiler runs that have been generated by a specific process specified by PID. To do this, you need to run CLMonitor.exe in the monitoring mode with arguments trace and --parentProcessID ('-p' short version). The argument --parentProcessID as a parameter has to obtain the process PID, which is supposed to be the parent of the compiler processes to run. The CLMonitor.exe command line might look as follows in this case:
CLMonitor.exe trace –-parentProcessID 10256If you perform the build from the console and you want CLMonitor.exe to monitor only the build, launched from that very console, you can run CLMonitor.exe with the argument --attach (-a):
CLMonitor.exe monitor –-attachIn this operational mode, the program will monitor only those compiler instances which are child processes of the console process, from which the build was run.
We need to take into account, that the MSBuild build system leaves some MSBuild.exe processes from the previous builds running. In this case, CLMonitor.exe monitoring child processes, won't be able to track compiler runs, generated by those remaining MSBuild.exe processes. That is so because these MSBuild.exe processes, most likely, aren't included in the hierarchy of the process specified by the argument --parentProcessID. Thus, before running CLMonitor.exe in the mode of monitoring child processes, we recommend terminating MSBuild.exe processes remaining in the system from the previous build.
Note: for the monitoring server to run correctly, it must be launched with the same privileges as the compiler processes themselves.
To ensure correct logging of messages in the system event logs, you need to launch the CLMonitor.exe process with elevated (administrative) privileges at least once. If it has never been launched with such privileges, it will not be allowed to write the error messages into the system log.
Notice that the server only records messages about its own runtime errors (handled exceptions) into the system logs, not the analyzer-generated diagnostic messages!
Once the build is finished, run CLMonitor.exe in the client mode so that it can generate the preprocessed files and call the static analyzer itself:
CLMonitor.exe analyze -l "d:\test.plog"As the '-l' argument, the full path to the analyzer's log file must be passed.
When running as a client, CLMonitor.exe will connect to the already running server and start generating the preprocessed files. The client will receive the information on all of the compiler invocations that were detected and then the server will terminate. The client, in its turn, will launch preprocessing and PVS-Studio.exe analyzer for all the source files which have been monitored.
When finished, CLMonitor.exe will save a log file (D:\ptest.plog) which can be viewed in Visual Studio PVS-Studio IDE plugin or Compiler Monitoring UI client (Standalone.exe, PVS-Studio|Open/Save|Open Analysis Report).
You can also use the analyzer message suppression mechanism with CLMonitor through the '-u' argument:
CLMonitor.exe analyze -l "d:\ptest.plog" -u "d:\ptest.suppress" -sThe '-u' argument specifies a full path to the suppress file, generated through the 'Message Suppression' dialog in Compiler Monitoring UI client (Standalone.exe, Tools|Message Suppression...). The optional '-s' argument allows you to append the suppress file specified through the -u with newly generated messages from the current analysis run.
You can also run CLMonitor.exe in the client mode so that it can generate the preprocessed files and call the analyzer in intermodular analysis mode:
CLMonitor.exe analyze -l "d:\ptest.plog" --intermodularThe --intermodular flag enables intermodular analysis mode. In this mode, the analyzer performs a deeper code analysis by increasing the analysis time.
For setting additional display parameters and messages filtration you can pass the path to the file of diagnostics configuration (.pvsconfig) using the argument '-c':
CLMonitor.exe analyze -l "d:\ptest.plog" -c "d:\filter.pvsconfig"If you need to finish monitoring without running the analysis, use the abortTrace:
CLMonitor.exe abortTraceSaving compilation monitoring dump and running analysis from this dump
CLMonitor.exe allows you to save information it gathered from monitoring a compilation process in a dump file. This will make possible re-running the analysis without the need to re-build a project and monitor this build. To save a dump you will first need to run monitoring in a regular way with either trace or monitor commands, as described above. After the build is finished, you can stop monitoring and save dump file. For this, run CLMonitor.exe with the saveDump command:
CLMonitor.exe saveDump -d d:\monitoring.zipYou can also finish monitoring, save dump file and run the analysis on the files that the monitoring have caught. For this, specify a path to the dump file to the CLMonitor.exe analyze command:
CLMonitor.exe analyze -l "d:\ptest.plog" -d d:\monitoring.zipRunning the analysis from the pre-generated dump file is possible with the following command:
CLMonitor.exe analyzeFromDump -l "d:\ptest.plog"
-d d:\monitoring.zip
Compilation monitoring dump file is a simple zip archive, containing a list of parameters from compiler processes that CLMonitor had caught (such as process command line arguments, environment variables, current working directory and so on) in an XML format. The analyzeFromDump command supports running the analysis form both the zipped dump file and an un-zipped XML. If you are using an unzipped xml file, make sure that it has the xml extension.
Dump analysis also supports the ability to run analysis in the intermodular mode. To do this, pass the --intermodular flag, just like in the analysis mode:
CLMonitor.exe analyzeFromDump -l "d:\ptest.plog"
-d d:\monitoring.zip --intermodular
Using the compilation monitoring system in Visual Studio Code on Windows
The extension for Visual Studio Code enables manual analysis of individual projects via CLMonitor, which provides convenient browsing and filtering of results in your IDE.
After installing the extension, the PVS-Studio window appears as a tab at the bottom of the Visual Studio Code interface. If the window is hidden, you can display it again using the PVS-Studio: Show window command in the command palette (Ctrl + Shift + P).
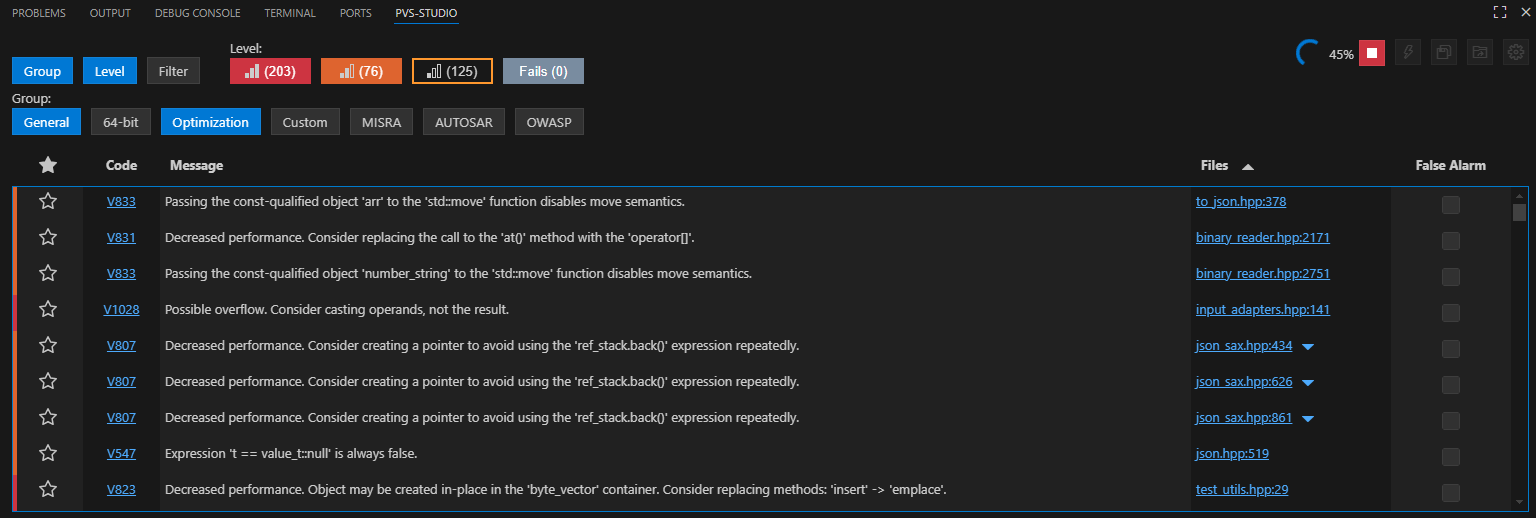
Open the command palette (Ctrl + Shift + P) and run PVS-Studio: Run Compiler Monitoring for C and C++ to start monitoring C and C++ compilers. This command opens the PVS-Studio window (if it was hidden), displaying a table of analyzer warnings, warning filters located in the upper-left corner above the table, and buttons for the following actions located in the upper-right corner:
- managing analysis and monitoring;
- suppressing warnings to
.suppressfiles; - saving or loading analyzer reports;
- opening the extension setting panel.

To analyze the entire project, a full recompilation is required. In this case, compiler calls for all source files in the project will be monitored and then analyzed. Only those files that have been rebuilt will be analyzed during the rebuilding of a project part.
If only modified files are rebuilt (build systems can compile only new or modified files and cache the results for the rest), then only these files will be analyzed when the analysis is run from monitoring. This is called incremental analysis.
After the first compiler run is monitored, a green button with an arrow that starts the analysis from monitoring appears to the left of the existing ones (a red button that cancels monitoring without starting the analysis). To the left of the green button is the number of the compiler runs that are currently being monitored.
After rebuilding the project, start the analysis by clicking the analysis start button in the monitoring window (a green button with an arrow) or execute the PVS-Studio: Stop monitoring and start analysis command in the command palette (Ctrl + Shift + P).
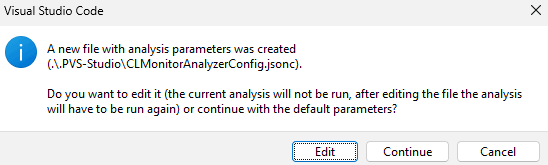
If you run the project monitoring for the first time, a notification will appear indicating that a file has been created at [workspace folder]/.PVS-Studio/CLMonitorAnalyzerConfig.jsonc, where you can specify some analysis settings similar to the ones in the analyze and analyzeFromDump modes of the CLMonitor console version:
- The path to a monitoring dump file. By default, the following path is set when creating a file with this setting:
[workspace folder]/.PVS-Studio/lastMonitoring.zip. - The path to the
.pvsconfigfile or directory from which the.pvsconfigfiles will be used.
Next, you will be prompted to select the analysis mode in the command palette:
- regular analysis is much faster than the intermodular one;
- intermodular analysis takes longer but provides better results.
Once you have selected a mode, the analysis will begin based on the monitored C and C++ compiler runs.
Note. If the project is rebuilt with administrator rights, VS Code must also be run with the same rights to enable monitoring of compiler runs executed as administrator.
If the project's source files and build configuration have not changed, you can save a compilation monitoring dump and run the analysis directly from it. To do this, in the compilationDump field of the [workspace folder]/.PVS-Studio/CLMonitorAnalyzerConfig.jsonc file, specify the path where the compilation monitoring dump will be saved before starting the analysis from the monitoring system. To run the analysis from the compilation dump, execute the PVS-Studio: Start analysis from compiler monitoring dump file command in the command palette (Ctrl + Shift + P).
Note. It is necessary to regenerate the compilation monitoring dump whenever you add, modify, delete source code files, or change the project build configuration. This ensures that the analysis covers all project files after any changes.
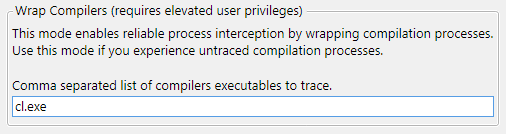
If C and C++ compiler runs are skipped during monitoring, open the PVS-Studio extension settings using the PVS-Studio: Show settings command. On the Monitoring (C and C++) tab, enter the names of compiler files to monitor in the Wrap compilers field, separating each name with a comma.

Then, restart VS Code with administrator rights and start monitoring. The Wrap compiler mode ensures stable monitoring of all compiler runs specified in the corresponding setting when monitoring in VS Code. For more details on this mode, refer to the relevant section of the documentation.
Using compiler monitoring from UI client (Standalone.exe)
For the "manual" check of individual projects with CLMonitor, you can use the interface of the Compiler Monitoring UI client (Standalone.exe) which can be launched from the Start menu.
To start monitoring, open the dialog box: Tools -> Analyze Your Files... (Figure 1):
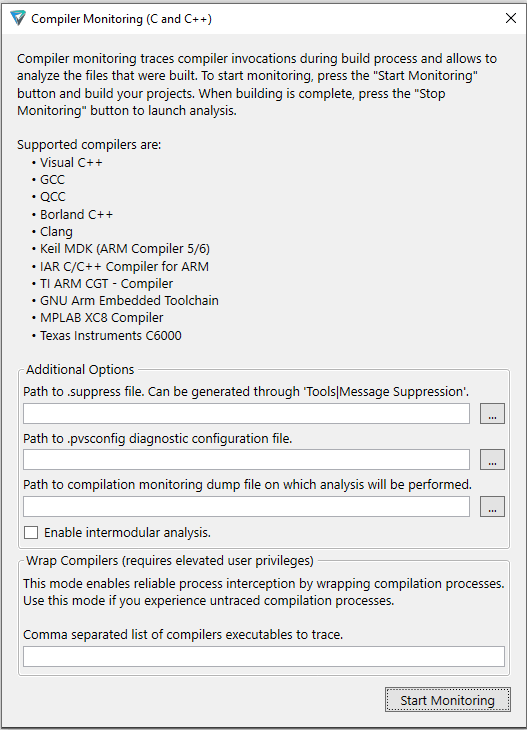
Figure 1 - The compiler monitoring start dialog box
Click "Start Monitoring" button. CLMonitor.exe process will be launched and the environment main window will be minimized.
Start building your project, and when it's done, click the "Stop Monitoring" button in the bottom right-hand corner of the window (Figure 2):
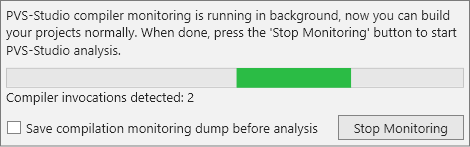
Figure 2 - The monitoring management dialog box
If the monitoring server has successfully tracked all the compiler launches, the preprocessed files will be generated first and then they will be analyzed. When the analysis is finished, you will see a standard PVS-Studio's report (Figure 3):

Figure 3 - The resulting output of the monitoring server and the analyzer
The report can be saved as an XML file (a .plog file): File -> Save PVS-Studio Log As...
Compiler monitoring from Visual Studio
A convenient navigation for analyzer messages and source code navigation is available in Visual Studio IDE through PVS-Studio extension. If the project to be analyzed can be opened inside this IDE, but the 'regular' analysis by PVS-Studio (i.e. PVS-Studio|Check|Solution) is not available (for example, for makefile Visual Studio projects), it is still possible to have all the benefits of Visual Studio by loading the analysis results (plog file) into PVS-Studio by the ' PVS-Studio|Open/Save|Open Analysis Report...' command. This action can also be automated, through the use of Visual Studio automation mechanism, by tying it, and also the analysis itself, to the project build event. As an example, let's review the integration of PVS-Studio analysis through compiler monitoring into a makefile project. Such type of projects is used, for instance, by the build system of Unreal Engine projects under Windows.
As a command to run the build of our makefile project, let's specify the run.bat file:

Figure 4 – configuring makefile project
The contents of the run.bat file are the following:
set slnPath=%1
set plogPath="%~2test.plog"
"%ProgramFiles(X86)%\PVS-Studio\CLMonitor.exe" monitor
waitfor aaa /t 10 2> NUL
nmake
"%ProgramFiles(X86)%\PVS-Studio\CLMonitor.exe" analyze -l %plogPath%
cscript LoadPlog.vbs %slnPath% %plogPath%
As arguments to run.bat, we pass the paths to solution and project. Compiler monitoring is first launched with CLMonitor.exe. The 'waitfor' command is used as a delay between launching the monitoring and building the project – without it, monitoring might not catch the first compiler invocations. Next step is the build command itself – nmake. After build is finished, we run the analysis, and after this is complete (the analysis results are saved along the project file), we load the results into Visual Studio with the 'LoadPlog.vbs' script. Here is this script:
Set objArgs = Wscript.Arguments
Dim objSln
Set objSln = GetObject(objArgs(0))
Call objSln.DTE.ExecuteCommand("PVSStudio.OpenAnalysisReport",
    objArgs(1))
Here we use the DTE.ExecuteCommand function from the Visual Studio automation to access our running Visual Studio (in which our solution is currently open) instance directly from the command line. Running this command is virtually identical to clicking the 'PVS-Studio|Open/Save|Open Analysis Report...' menu item in the UI.
To find a running Visual Studio instance, we use the GetObject method. Please take a note that this method uses the solution path to identify the running Visual Studio instance. Therefore, when using it, opening the same solution in several instances of Visual Studio is inadvisable – the method could potentially "miss" and analysis results will be opened inside the wrong IDE instance – not the one that was used to run the build\analysis.
Specifics of the CLMonitor.exe use with Incredibuild
Incredibuild significantly (several times) reduces the project analysis time distributing the execution of processes to several machines. However, the CLMonitor.exe utility cannot monitor remote compiler calls and supports only tracing for local assemblies. Therefore, the result of compiler monitoring analysis launched by Incredibuild may be incorrect.
You can run the analysis through the compiler monitoring that is combined with distributed build. For this, you need to generate a dump from local compiler monitoring. Use CLMonitor.exe (how to generate a dump is described in the previous sections) and Incredibuild to run the dump analysis in distributed mode. More detailed information about the Incredibuild configuration for this mode is available here: "Speeding up the analysis of C/C++ code through distributed build systems (Incredibuild)".
Specifics of monitoring a build process of IAR Embedded Workbench for ARM
Sometimes, IAR Embedded Workbench IDE can set up the current working directory of the compiler process (iccarm.exe) to 'C:\Windows\System32' during the build process. Such behavior can cause issues with the analysis, considering that current working directory of the compiler process is where CLMonitoring stores its intermediate files.
To avoid writing intermediate files to 'C:\Windows\System32', which in turn can cause insufficient access rights errors, a workspace should be opened by double clicking the workspace file ('eww' extension) in Windows explorer. In this case, intermediate files will be stored in the workspace file's directory.
Incremental analysis
In case of necessity of performing the incremental analysis when using the compiler monitoring system, it is enough to "monitor" the incremental build, i.e. the compilation of the files that have been modified since the last build. This way of usage will allow to analyze only the modified/newly written code.
Such a scenario is natural for the compiler monitoring system. Accordingly, the analysis mode (full or analysis of only modified files) depends only on what build is monitored: full or incremental.
Intermodular analysis mode
Enabling this mode allows the analyzer to consider information not only from the analyzed file, but also from files that relate to the analyzed file. This allows for deeper, higher quality analysis. However, it takes extra time to collect the necessary information, which will affect the time you analyze your project.
To run intermodular analysis (the 'analyze' mode) or intermodular analysis from a dump (the 'analyzeFromDump' mode), pass the --intermodular flag.
Specification of individual files for analysis
The 'analyze' and the 'analyzeFromDump' modes allow you to selectively check a set of source files. The '--sourceFiles' (-f) flag specifies a path to the text file that contains line-by-line paths to the files being checked. Relative file paths will be expanded relative to the current working directory. You can specify both compiled source files (.c, .cpp, etc.), and header files (.h/.hpp).
In the mode of checking the list of source files list, a compilation dependency cache is generated, which will be used for subsequent analysis runs. By default, dependency cache is saved in a special '.pvs-studio' subdirectory by 'CLMonitor.deps.json' name. If necessary, you can change its storage location using the '--dependencyRoot' (-D) flag.
By default, dependency cache keeps full paths to source files of local system. You can generate portable caches by specifying a random root project directory using the '--dependencyCacheSourcesRoot' (-R) flag. Paths will be saved and loaded relative to the project directory.
Wrap Compilers interception mode
The default method of the compilation monitoring may miss some source files. The problem is especially relevant for Embedded projects since their files are written in C language and can be quickly compiled. To ensure that all compilation processes are intercepted, the monitoring utility can use a more aggressive mechanism — through Image File Execution Options (IFEO) of the Windows registry. The mechanism allows to run a special wrapper right before starting each compilation process. Then the wrapper sends the necessary information to the monitoring server and continues to run the compiler. The mode operation is visible for the build system and requires access to change the registry path: "HKEY_LOCAL_MACHINE\SOFTWARE\Microsoft\Windows NT\CurrentVersion\Image File Execution Options". You should run the utility as an administrator or grant it write permissions to the registry.
To enable this monitoring mode from command line, run the CLMonitor.exe utility in the 'monitor' or 'trace' modes with '--wrapCompilers (-W)' flag that has a list of compilers. The list of compilers is separated by a comma, for example:
CLMonitor.exe trace --wrapCompilers gcc.exe,g++.exeNote that you need to specify the names of the compiler executable files with the .exe extension and without paths.
To enable the interception mode from graphical user interface, fill in the Wrap Compilers field in the monitoring start dialog box.
The IFEO mechanism has its advantages, however some precautions must be observed.
To attach wrappers before starting a process, the monitoring utility modifies the "HKEY_LOCAL_MACHINE\SOFTWARE\Microsoft\Windows NT\CurrentVersion\Image File Execution Options" registry path. In the registry path, a new key is created with the name of the executable file of the process and with the "Debugger" field in that key. The field is used to specify the command to run the wrapper so that the wrapper is launched instead of the process with the specified name of the executable file. A mistake in the field may make it impossible to start some processes. PVS-Studio does not allow to use this mode with an arbitrary set of executable files. You can use the mode only with those executable files that are recognized as well-known compilers. After the monitoring process is successfully completed, the registry entries are returned to their initial state. If the monitoring process is completed abnormally (in case of forced termination, error, or computer shutdown), the registry will not be automatically restored. However, before registry is modified, the monitoring utility creates a recovery file in "%AppData%\PVS-Studio\wrapperBackup.reg". The monitoring utility will use this file to recover the registry to initial state. The monitoring utility will use this file automatically at the next launch. Before automatic recovery, the recovery file is checked. If the file contains suspicious entries, it's not used. It's renamed to "wrapperBackup-rejected.reg". In this case, the rejected recovery file should be checked by the responsible person. The rejection of the file may indicate an incorrect configuration of the utility or the presence of malware on the computer.
Conclusion
Despite the convenience of the "seamless" analysis integration into the automated build process (through CLMonitor.exe) employed in this mode, one still should keep in mind the natural restrictions inherent in this mode. Particularly, that a 100% capture of all the compiler launches during the build process is not guaranteed. This king of failure may be caused both by the influence of the external environment (for example antivirus software) and the hardware-software environment specifics (for example the compiler may terminate too quickly when running on an SSD disk while CPU's performance is too low to "catch up with" this launch).
That's why we recommend you to provide whenever possible a complete integration of the PVS-Studio static analyzer with your build system (in case you use a build system other than MSBuild) or use the corresponding PVS-Studio IDE plugin.
Was this page helpful?