
Speeding up the analysis of C and C++ code through distributed build systems (Incredibuild)
- An example of Incredibuild configuration
- Combined use of distributed analysis and compiler call monitoring system
To speed up the analysis, you can use a distributed build system, for example, Incredibuild. The analysis of C/C++ code in PVS-Studio can be divided into 2 stages: preprocessing and analysis itself. Each of these steps can be executed remotely by the distributed build system. To analyze each C/C++ compiled file, PVS-Studio first launches an external preprocessor, and then the C++ analyzer itself. Each such process can be executed remotely.
Depending on the type of a checked project, the analysis of PVS-Studio is launched either through the PVS-Studio_Cmd.exe (for MSBuild projects) utility, or using the utility for monitoring the calls of the compiler - CLMonitor.exe \ Standalone.exe (for any build system). Further, one of these utilities will first run the preprocessor (cl.exe, clang.exe for Visual C++ projects, for the rest – the same process that was used for compilation) for each checked file, and then - the C++ analyzer PVS-Studio.exe.
Setting the value of 'ThreadCount' option to more than '16' (or more than a number of processor cores, if processor possesses more than 16 cores) is available only in PVS-Studio Enterprise license. You can request the trial Enterprise license here.
These processes run concurrently, depending on the 'PVS-Studio|Options...|Common AnalyzerSettings|ThreadCount' setting. By increasing the number of concurrently scanned files, with the help of this setting, and distributing the execution of these processes to remote machines, you can significantly (several times) reduce the total analysis time.
An example of Incredibuild configuration
Here is an example of speeding up the PVS-Studio analysis by using the Incredibuild distributed system. For this we'll need an IBConsole management utility. We will use the Automatic Interception Interface, which allows remotely executing any process, intercepted by this system. Launching of the IBConsole utility for distributed analysis using PVS-Studio will look as follows:
ibconsole /command=analyze.bat /profile=profile.xmlThe analyze.bat file must contain a launch command for the analyzer, PVS-Studio_Cmd.exe or CLMonitor.exe, with all the necessary parameters for them (more detailed information about this can be found in the relevant sections of analyzer documentation). Profile.xml file contains the configuration for the Automatic Interception Interface. Here is an example of such a configuration for the analysis of the MSBuild project using PVS-Studio_Cmd.exe:
<?xml version="1.0" encoding="UTF-8" standalone="no" ?>
<Profile FormatVersion="1">
  <Tools>
    <Tool Filename="PVS-Studio_Cmd" AllowIntercept="true" />
    <Tool Filename="cl" AllowRemote="true" />
    <Tool Filename="clang" AllowRemote="true" />
    <Tool Filename="PVS-Studio" AllowRemote="true" />
  </Tools>
</Profile>
Let's see, what each record in this file means. We can see that the AllowIntercept attribute with the 'true' value is specified for PVS-Studio_Cmd. This means that a process with such a name will not be executed itself in a distributed manner, but the system of automatic interception will track the child processes generated by this process.
For the preprocessor cl and clang processes and the C/C++ analyzer PVS-Studio process, the AllowRemote attribute is specified. This means that processes with such names, after being intercepted from the AllowIntercept processes, will be potentially executed on other (remote) Incredibuild agents.
Before running IBConsole, you must specify the 'PVS-Studio|Options...|Common AnalyzerSettings|ThreadCount' setting, according to the total number of cores available on all of Incredibuild agents. If it's not done, there will be no effect from using Incredibuild!
Note: during the analysis of Visual C++ projects, PVS-Studio uses clang.exe supplied in the PVS-Studio distribution for preprocessing C/C++ files before the analysis, instead of the cl.exe preprocessor. This is done to speed up the preprocessing, as clang is doing it faster than cl. Some older versions of Incredibuild performs a distributed launch of the clang.exe preprocessor not quite correctly, resulting in errors of preprocessing. Therefore, clang should not be specified in the IBConsole configuration file, if your version of Incredibuild handles clang incorrectly.
The used type of preprocessor during the analysis is specified with the 'PVS-Studio|Options...|Common AnalyzerSettings|Preprocessor' setting. If you choose the 'VisualCpp' value for this setting, PVS-Studio will use only cl.exe for preprocessing, which will be executed in a distributed manner, but slower than clang, which cannot be executed in a distributed manner. You should choose this setting depending on the type of the project and the number of agents available to analyze - when having a large numbers of agents, the choice of VisualCpp will be reasonable. With a small numbers of agents, local preprocessing with clang might prove to be faster.
Combined use of distributed analysis and compiler call monitoring system
It's possible to use the compiler monitoring system (CLMonitor.exe and Compiler Monitoring UI) together with Incredibuild during distributed analysis of a project. This combination significantly speeds up the analysis. However, this approach has its own peculiarities. Compiler monitoring systems cannot monitor remote compiler calls. The CLMonitor.exe utility supports tracing only for local builds.
Compiler monitoring analysis started by Incredibuild may be incorrect because compiler monitoring systems do not detect compiler calls on other machines. But you can use the Incredibuild tool to parallelize analysis of a dump obtained by the compiler monitoring systems. For this, you need to get the compiler launch dump.
If you use CLMonitor.exe, follow the steps below to get the compilation monitoring dump:
- launch the compiler monitoring:
- CLMonitor.exe monitor;
- build the project without Incredibuild. As a result, CLMonitor.exe monitors the compiler launch;
- save compilation monitoring dump:
- CLMonitor.exe saveDump -d c:\monitoring.zip
If you use Compiler Monitoring UI, the following procedure will help to save the compilation monitoring dump after the launch of Compiler Monitoring UI:
- launch the compiler monitoring through Tools -> Analyze Your Files...:
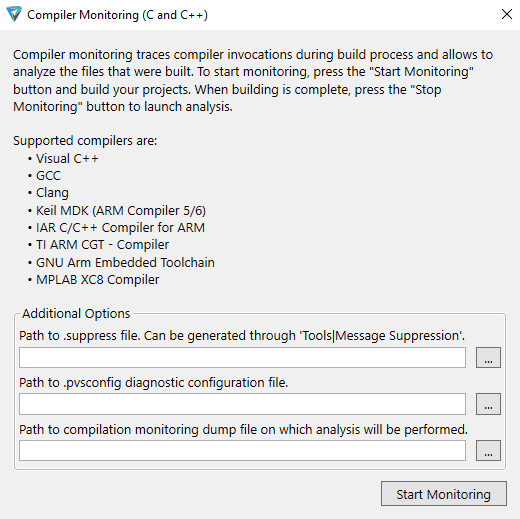
- click Start Monitoring;
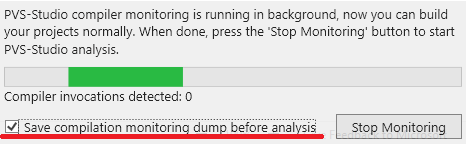
- tick "Save compilation monitoring dump before analysis" in the monitoring progress box:
- build the project;
- stop monitoring;
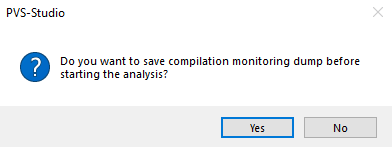
- save the dump file:
Similarly to the previous example, use ibconsole for distributed dump analysis:
ibconsole /command=analyze.bat /profile=profile.xmlHowever, this time, in the analyze.bat file, instead of PVS-Studio_Cmd.exe, call CLMonitor.exe in the file dump analysis mode:
CLMonitor.exe analyzeFromDump -l "c:\ptest.plog" -d "c:\monitoring.zip"In the case of Compiler Monitoring UI we must run Standalone.exe instead of PVS-Studio_Cmd.exe:
Standalone.exeIn the settings file, replace PVS-Studio_Cmd with CLMonitor / Standalone and cl. If necessary, replace it with the type of preprocessor that is used during build (gcc, clang). Example:
<?xml version="1.0" encoding="UTF-8" standalone="no" ?>
<Profile FormatVersion="1">
  <Tools>
    <Tool Filename="CLMonitor" AllowIntercept="true" />
    <Tool Filename="gcc" AllowRemote="true" />
    <Tool Filename="PVS-Studio" AllowRemote="true" />
  </Tools>
</Profile>
Also, remember to specify the 'PVS-Studio|Options...|Common AnalyzerSettings|ThreadCount' setting, according to the total number of cores available for all of Incredibuild agents. If you skip this step, there will be no effect from using Incredibuild!
When specifying the ThreadCount settings, remember that the analysis coordinator machine (i.e. the one that runs the PVS-Studio_Cmd/CLMonitor/Standalone) handles the results from all PVS-Studio.exe processes. This job cannot be distributed. Therefore, especially if ThreadCount is set to a very high value (more than 50 processes simultaneously), it is worth thinking about how to "ease" the analysis tasks (i.e. processes of the analyzer and preprocessor) from the coordinator machine. This can be done by using the '/AvoidLocal' IBConsole flag, or in the settings of local Incredibuild agent on the coordinator machine.
If you are using Compiler Monitoring UI, do the following to run the analysis of the compilation monitoring dump file:
- select Tools -> Analyze Your Files...
- specify the path to the dump file before the analysis:
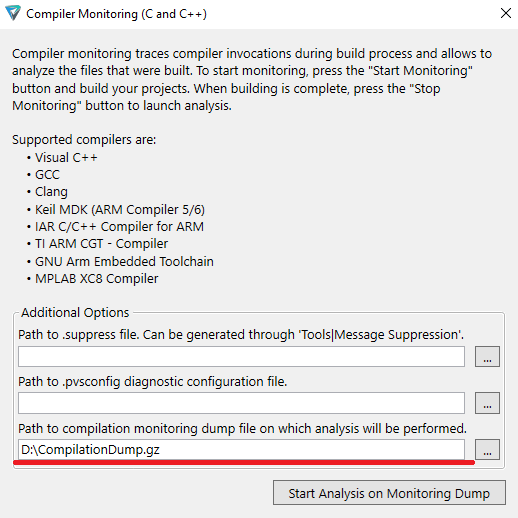
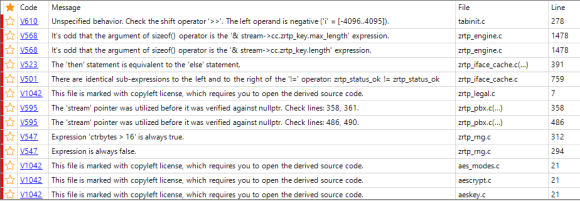
The result of the distributed dump analysis will be either the :\ptest.plog file (if you use CLMonitor.exe) or a report with the analyzer's warnings in the Compiler Monitoring UI table:
You can use the following menu items to save messages from the report in various formats:
- File -> Save PVS-Studio Log;
- File -> Save PVS-Studio Log As...;
- File -> Save Filtered Log As HTML....
During this type of analysis, the Incredibuild tool distributes the PVS-Studio.exe processes among all machines involved and CLMonitor.exe is not parallelized in this case.
This type of analysis is more beneficial for large projects – where contents often changes, and structure stays the same (for example, developers rarely add, delete or rename files in such projects).
Was this page helpful?