
How to use PVS-Studio extension for Visual Studio Code
- Watch, don't read (YouTube)
- How to install the extension
- How to run the analysis
- How to analyze C and C++ (CMake) projects
- How to analyze C# (MSBuild) projects
- How to analyze Java projects
- How to handle analysis results
- How to configure the plugin
- Managing PVS-Studio plugin versions
The PVS-Studio extension for Visual Studio Code enables viewing analysis results, running analysis of CMake, MSBuild, and Java projects, and using compilation monitoring on Windows. This documentation explains how to use this extension.
Note. The analyzer should be downloaded and installed before using the extension.
Watch, don't read (YouTube)
How to install the extension
Here are several ways to install the extension.
Note. The extension requires Visual Studio Code 1.74.0 or later.
Via the Extension Marketplace
To install the PVS-Studio extension, open Visual Studio Code > Extensions, enter "PVS-Studio" in the search field, and click the Install button.
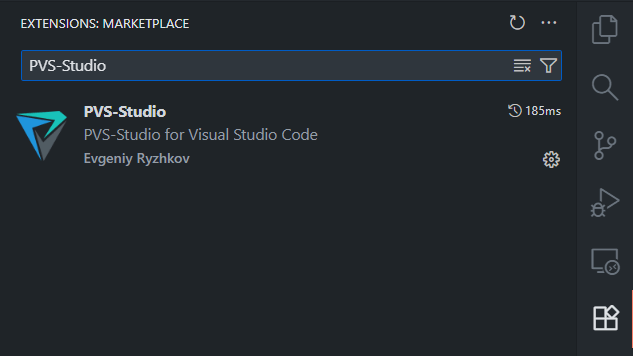
Note that the marketplace installs only the PVS-Studio extension for Visual Studio Code It requires the installed analyzer on your system. You can download it here.
Via the PVS-Studio installer
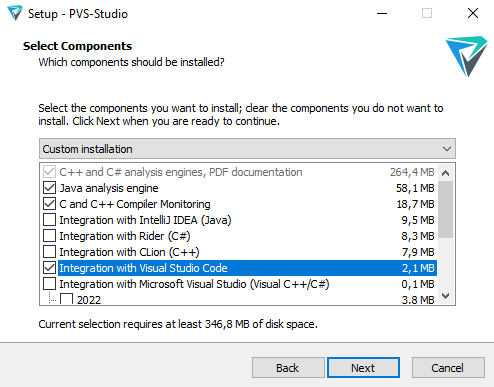
When installing the analyzer on Windows, select Integration with Visual Studio Code in the installer menu. The PVS-Studio extension will then be automatically added to Visual Studio Code.
Via the .vsix file
The PVS-Studio extension file is available in the .vsix format on the PVS-Studio page of the Visual Studio Marketplace.
The pvs-studio-vscode-*.vsix file is unpacked when you install the analyzer (the default path: PROGRAMFILES(x86)%\PVS-Studio for Windows, /usr/lib/pvs-studio/plugins for Linux and macOS).
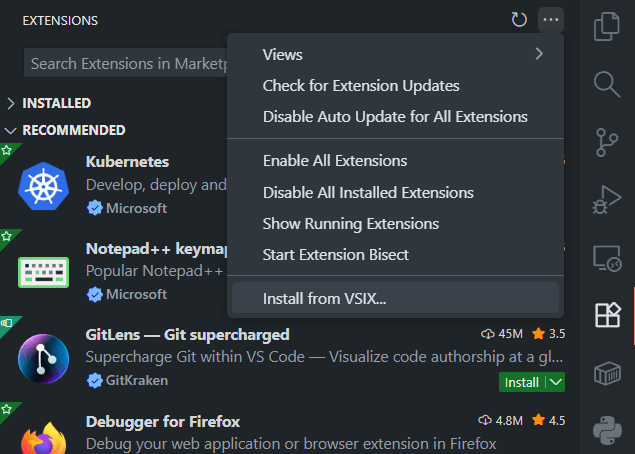
To install the extension from this file, open the Extensions tab, click the three dots in the upper-right corner, and click Install from VSIX.
Installation result
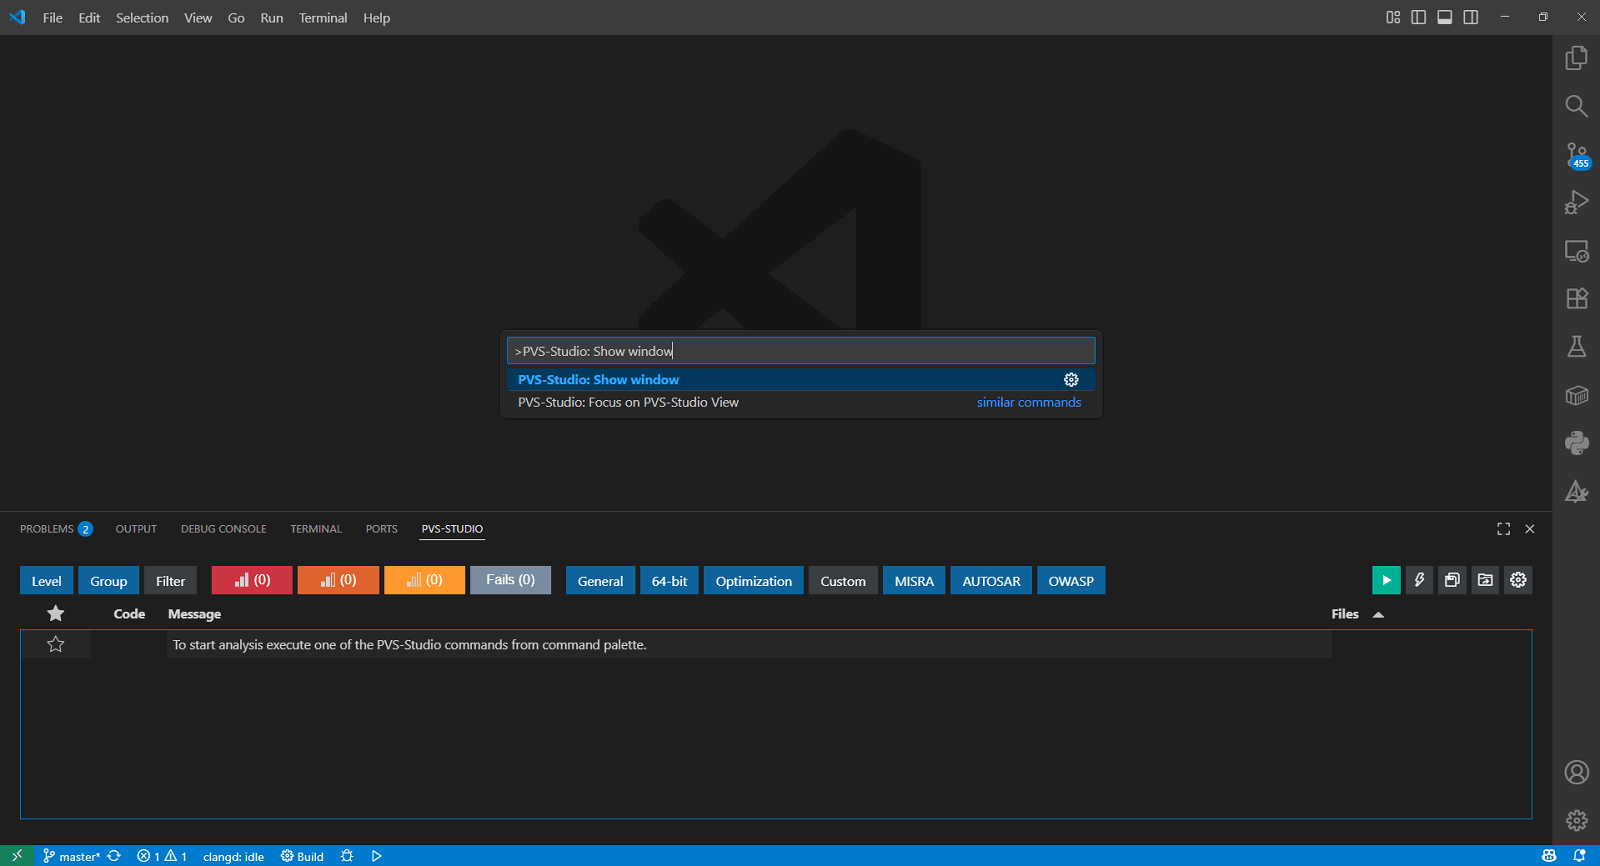
After installation, the PVS-Studio window appears as a tab at the bottom of the Visual Studio Code interface. If the window is hidden, you can display it using the PVS-Studio: Show window command in the command palette (Ctrl + Shift + P).
How to run the analysis
There are several ways to run the analysis:
1. Using the Start analysis button:
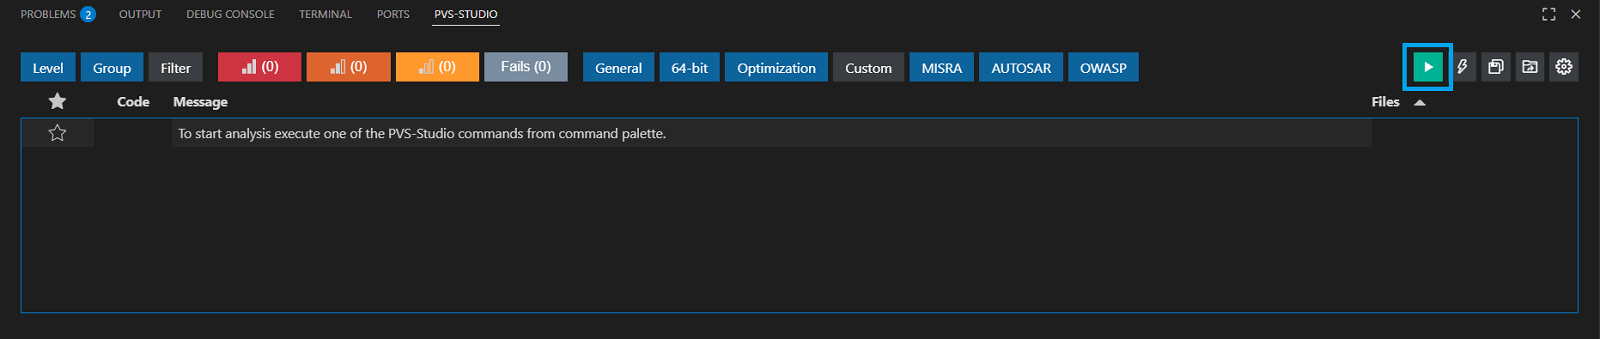
It runs the analysis of the entire project.
2. Using the context menu of the code editor:
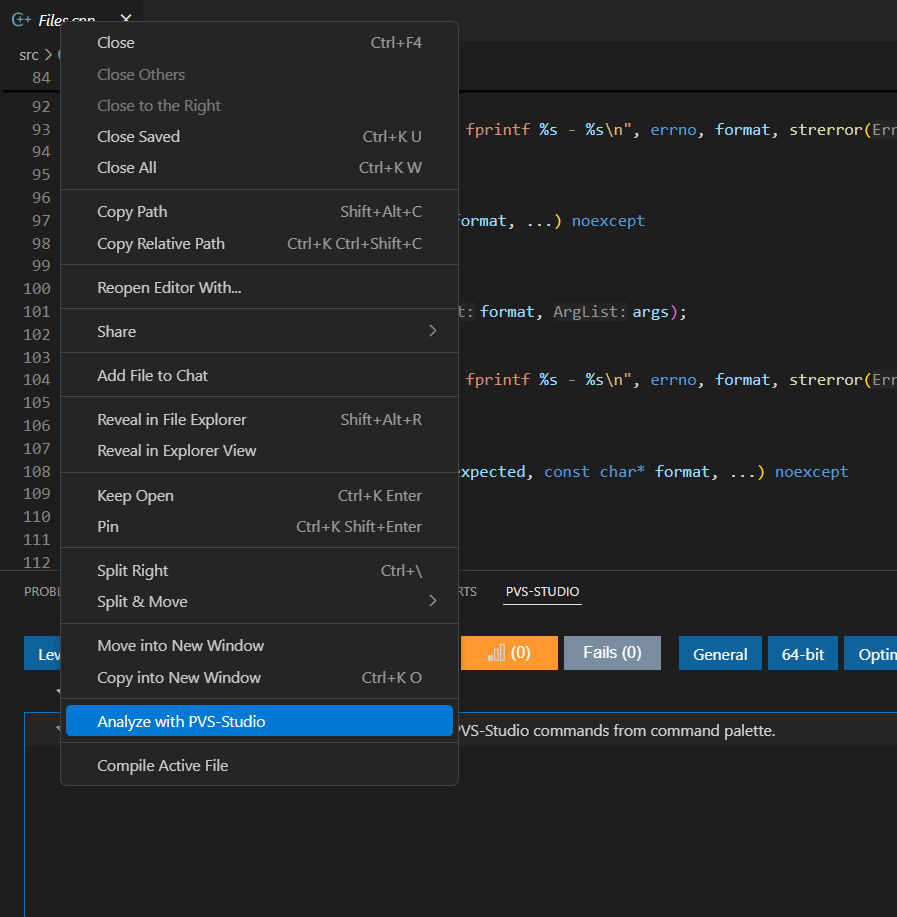
It runs the analysis for a single file. Note that if this menu item is missing, the analysis of the current file is not supported.
3. Using the context menu of the file explorer:
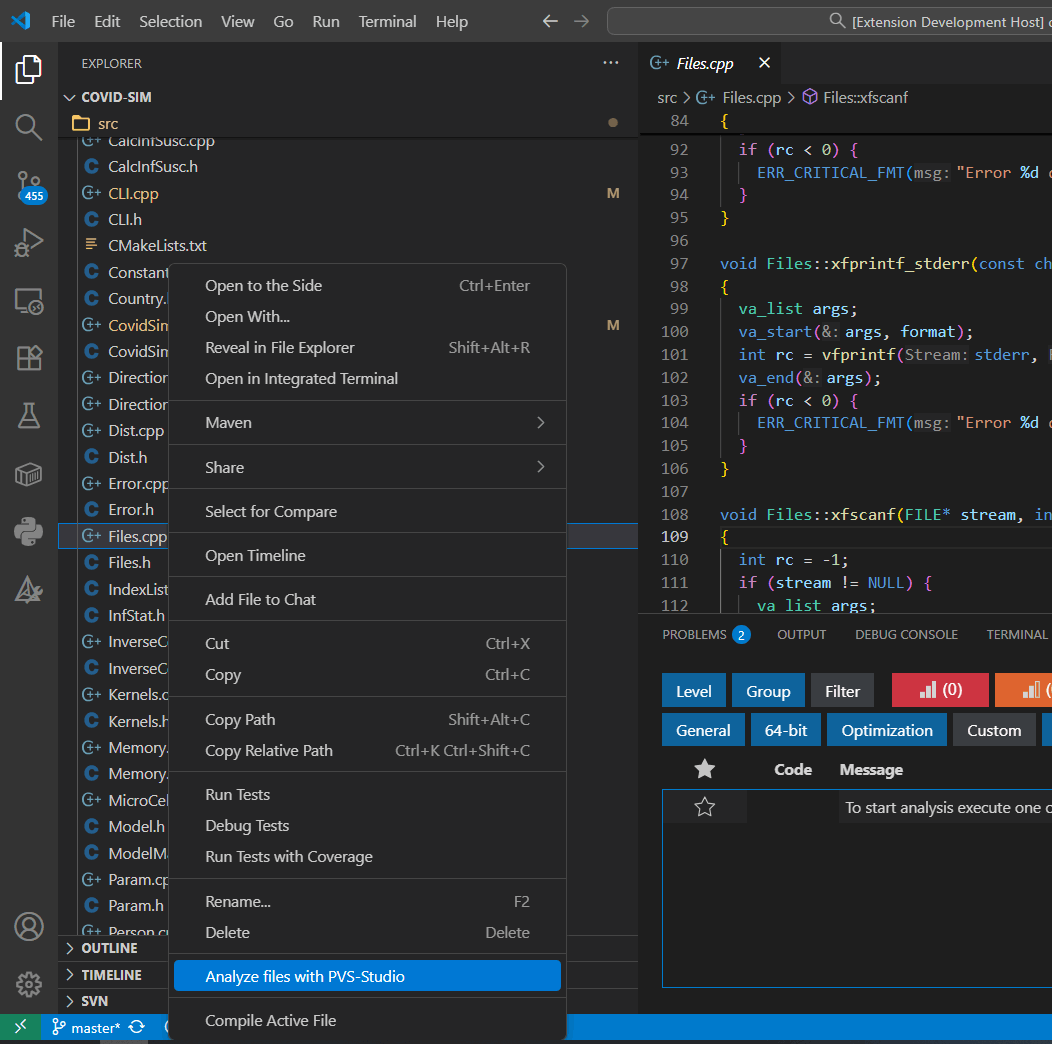
It runs the analysis for all supported files that have been selected. If folders are selected, all files in them and their subdirectories will be analyzed.
4. Using the menu of the editor tab group:
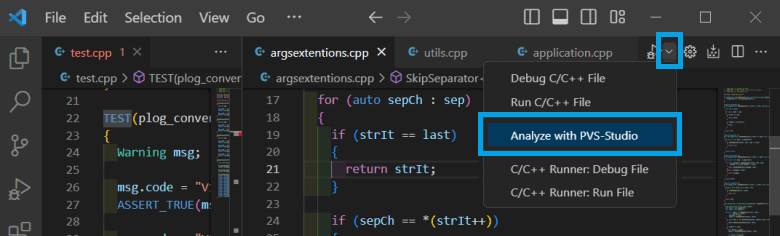
It runs the analysis of the supported files opened in the current tab group.
5. Using the Run regular analysis and Run intermodular analysis commands in the command palette (Ctrl+Shift+P)
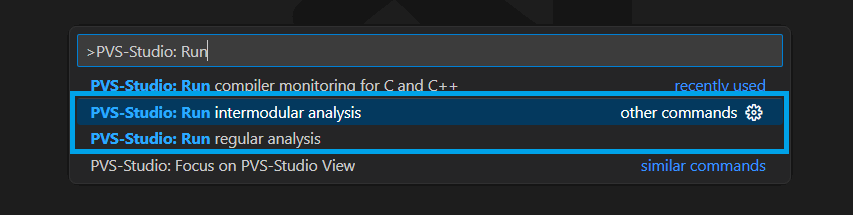
Both commands run a general solution analysis. The difference is relevant only for C and C++ code. In this mode, the analyzer performs deeper analysis but takes longer.
If no suitable target for analysis is found in the VS Code directory, a message will be displayed.
On Windows:
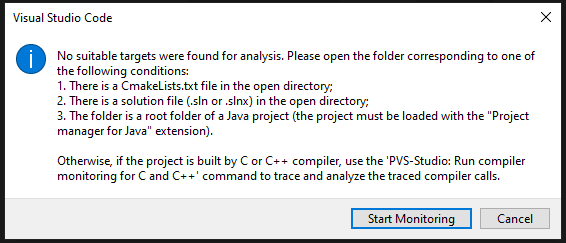
For some C and C++ compilers on Windows, you can use compilation monitoring for the analysis. You can read about how to use it here.
On Linux:
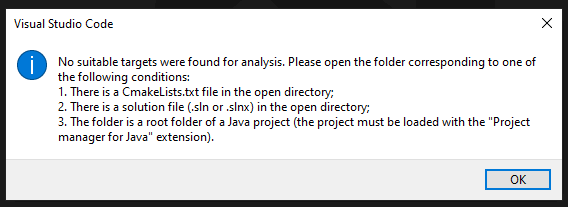
You may be prompted to configure settings specific to projects that use a particular build system. For more information on analyzing a specific project type, refer to the documentation sections:
- How to analyze C, C++ (CMake) projects;
- How to analyze C# (MSBuild) projects;
- How to analyze Java projects.
If the analysis starts successfully, the PVS-Studio window will display:
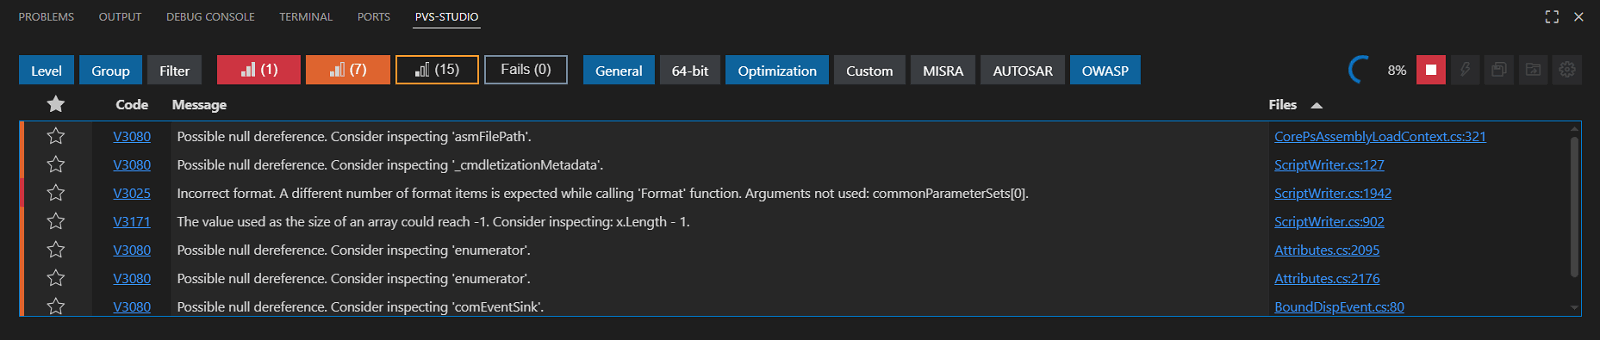
The analysis progress will be displayed in the upper-right corner of the window. An interrupt button will appear next to it. Warnings will appear in the table as they are detected.
How to analyze C and C++ (CMake) projects
To run the CMake project analysis, install the CMake Tools extension and build the project using it.
The plugin is compatible with the following build systems:
- Ninja
- Makefile Generators
If an unsupported generator is detected, or no generator is installed, a dialog will prompt users to change the parameter in the CMake Tools settings:
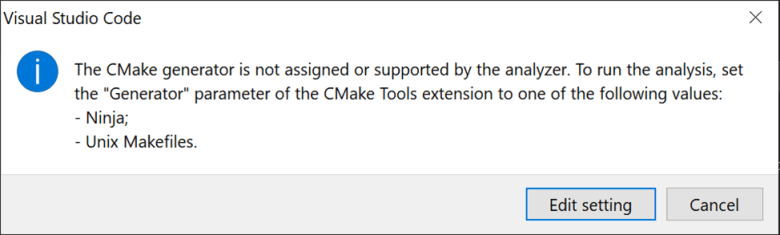
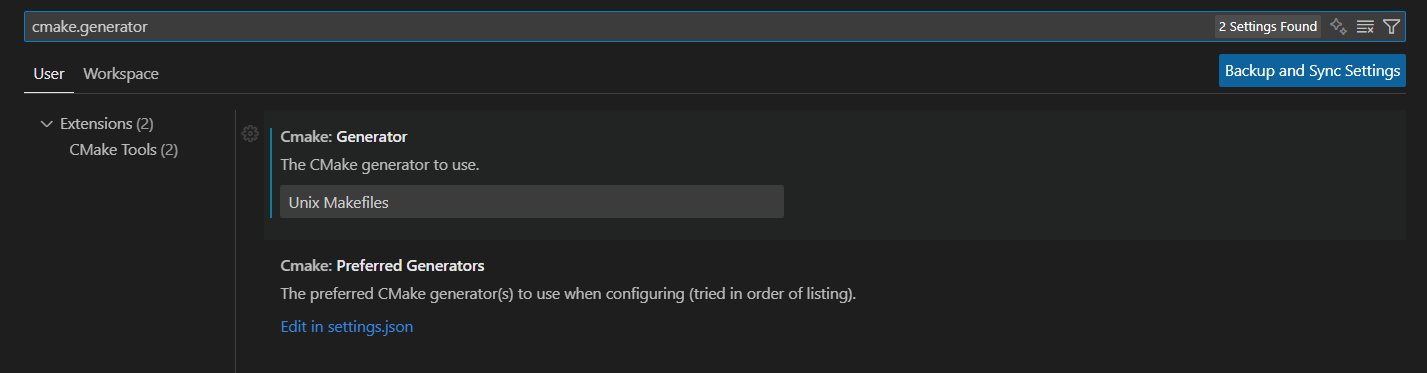
Click Edit setting to open a page with the cmake.generator setting:
In CMake Tools, you can specify the preferred path to the build files folder using the cmake.buildDirectory setting (by default, it is /build in the project folder):
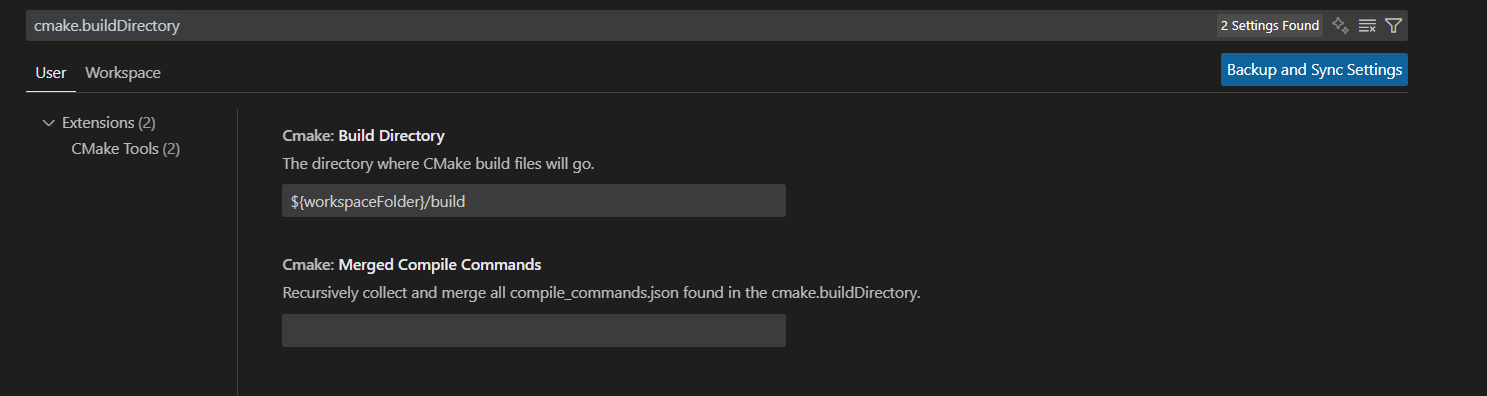
This parameter is important for the analysis because PVS-Studio expects to find the compile_commands.json file in this directory.
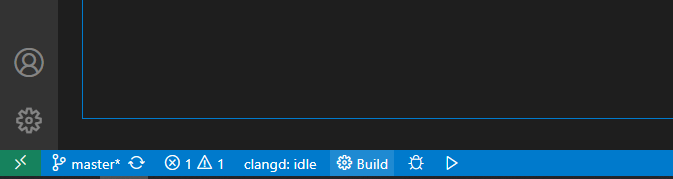
To build the project, click the Build button at the bottom-left of the IDE window:
Note. For more information about other CMake Tools extension features, see the CMake Tools for Visual Studio Code documentation.
Before running the analysis, you can select the analysis type: intermodular or regular. Intermodular analysis takes longer but provides better results. For more details about this mode, see the documentation.
The contents of the .PVS-Studio folder in the project directory are also considered when running the analysis. User configuration files (.pvsconfig) and suppress files (.suppress.json) will be passed to the analyzer for further handling if they are detected.
Note. Currently, only one suppress file is supported for checking CMake projects. If several files are detected upon running the tool, a message will appear in the report, indicating which file is analyzed.
How to analyze C# (MSBuild) projects
The first time a solution is analyzed, a notification will appear indicating that a file has been created in /.PVS-Studio/MSBuildAnalyzerConfig.jsonc within the directory opened in the IDE. There, you can configure analysis settings that are identical to the parameters in the console version of the analyzer.
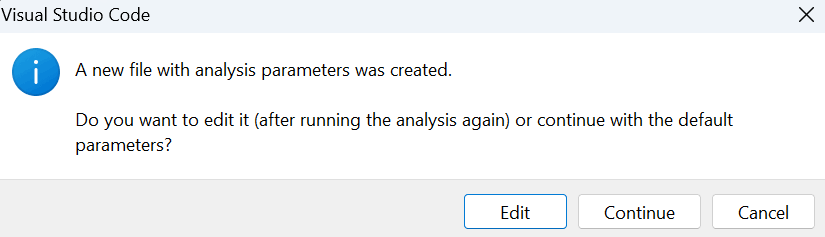
Here are the options:
- Edit opens the created file (analysis will not start);
- Continue runs the analysis with default settings;
- Cancel cancels the analysis (the file will not be created).
In this same file, you can specify the files and parameters that will be considered during the analysis:
- suppress files (with the
.suppress.jsonextension); - configuration files (with the
.pvsconfigextension); - a platform and build configuration;
- specific projects (
.csprojand.vcxproj) and files (.cs,.cpp, etc.) for analysis; - other settings described in the file and in the documentation.
Note. When you run the analysis of specific files via the context menus or editor tab group menus, only files included in the selected solution will be analyzed.
If a project file (with the .csproj or .vcxproj extension) is found among the analyzed files, all supported files included in this project will be analyzed.
How to analyze Java projects
To make PVS-Studio identify your project in the opened directory, the Project manager for Java extension should be installed and enabled in Visual Studio Code.
Configuration
By default, the PVS-Studio extension searches for the analyzer core in one of the following directories:
- Windows:
C:\Users\[User]\AppData\Roaming\PVS-Studio-Java; - Linux/macOS:
~/.config/PVS-Studio-Java.
If the core is located in another folder, specify its path in the extension settings (File > Preferences > Settings > PVS-Studio: Java Projects Analyzer or the pvsStudio.javaProjectsAnalyzer.path setting).
To run the analyzer core, JDK 11-21 is required. By default, the JDK specified in the environment variables is used. If the JDK version is not supported, install the supported JDK and specify its path in the Visual Studio Code settings (File > Preferences > Settings > PVS-Studio: Java For Running Analyzer or the pvsStudio.javaProjectsAnalyzer.javaPath setting).
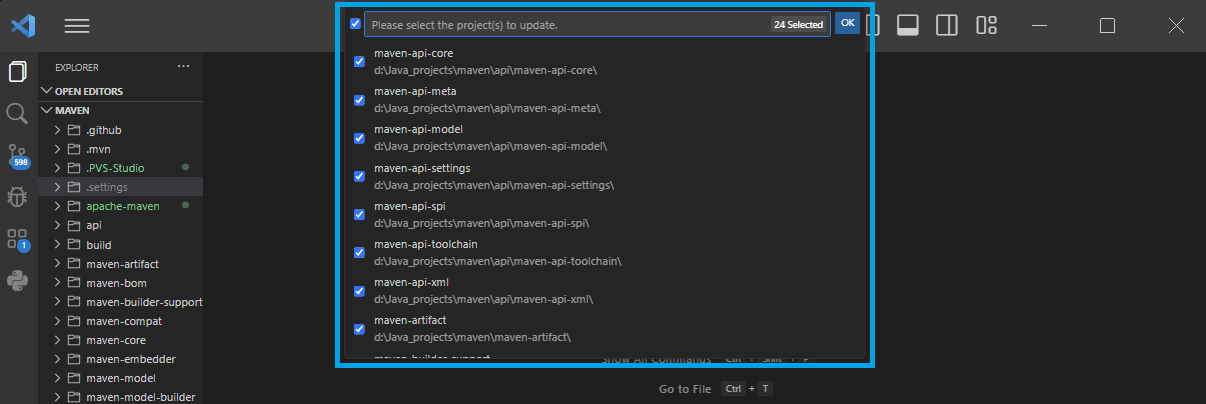
Before starting the analysis, it is recommended to run the Java: Reload Projects command in the command palette (Ctrl + Shift + P). If a drop-down list with project modules displays after that, ensure all modules to be analyzed are selected:
How to run the analysis
The first time the project is analyzed, a notification will appear indicating that a file has been created in /.PVS-Studio/ JavaAnalyzerConfig.jsonc within the directory opened in the IDE. There, you can configure analysis settings that are identical to the parameters in the console version of the analyzer.
Here are the options:
- Edit opens the created file (the analysis will not start);
- Continue runs the analysis with default settings;
- Cancel cancels the analysis (the file will not be created).
In this same file, you can specify the files and parameters that will be included in the analysis:
- the path to the suppress file (with the
. suppress.jsonextension); - enable/disable incremental analysis (disabled by default);
- enable/disable the V6078 special diagnostic rule that detects potential API compatibility issues among selected Java SE versions (specified as separate parameters).
How to handle analysis results
Converting a PVS-Studio report to JSON format
Note. The PVS-Studio extension for Visual Studio Code supports only reports in JSON format. Depending on the analyzed project type and how the analysis is run, PVS-Studio can generate a report in one of several formats. To display the report in the extension, convert it to the JSON format.
To do this, you can use command-line utilities: PlogConverter.exe on Windows and plog-converter on Linux and macOS. They enable not only converting the PVS-Studio report into various formats, but also additional handling, such as filtering warnings. You can read more about this here.
The example of the PVS-Studio report conversion command using PlogConverter.exe (Windows):
PlogConverter.exe path\to\report.plog -t json ^
                                      -n PVS-Studio
The example of the PVS-Studio report conversion command using plog-converter (Linux and macOS):
plog-converter path/to/report/file.plog -t json \
                                        -a ALL \
                                        -o PVS-Studio.json
Viewing the converted report
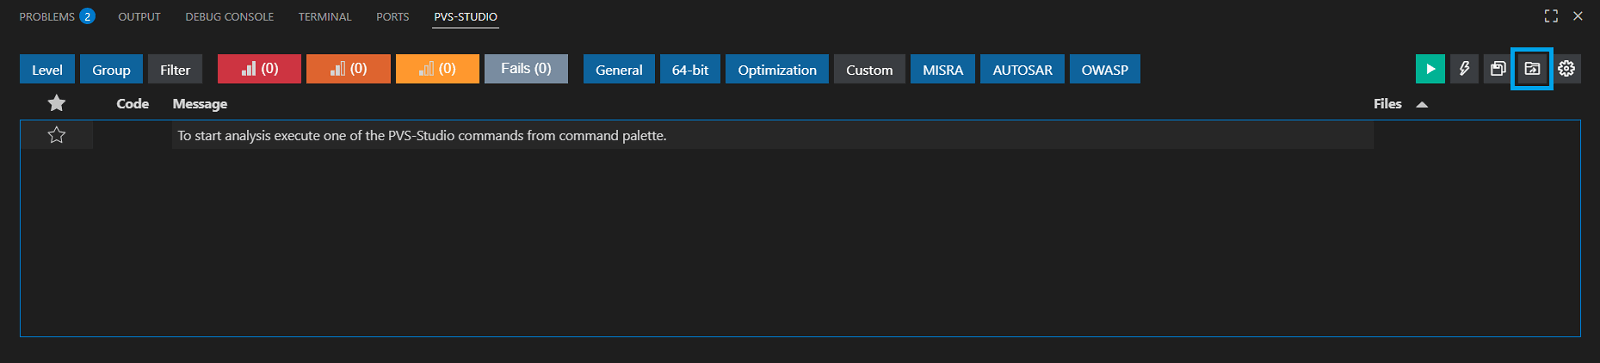
To view the report in Visual Studio Code, click the Open report button in the PVS-Studio window and select the appropriate file. You can also open the report by selecting PVS-Studio: Load Report in the command palette (Ctrl+Shift+P):
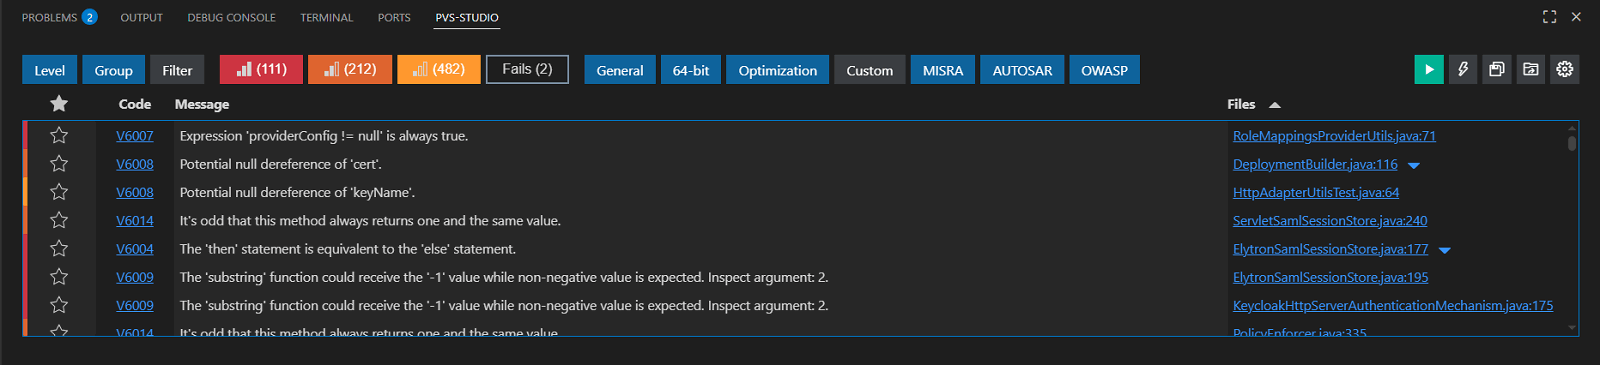
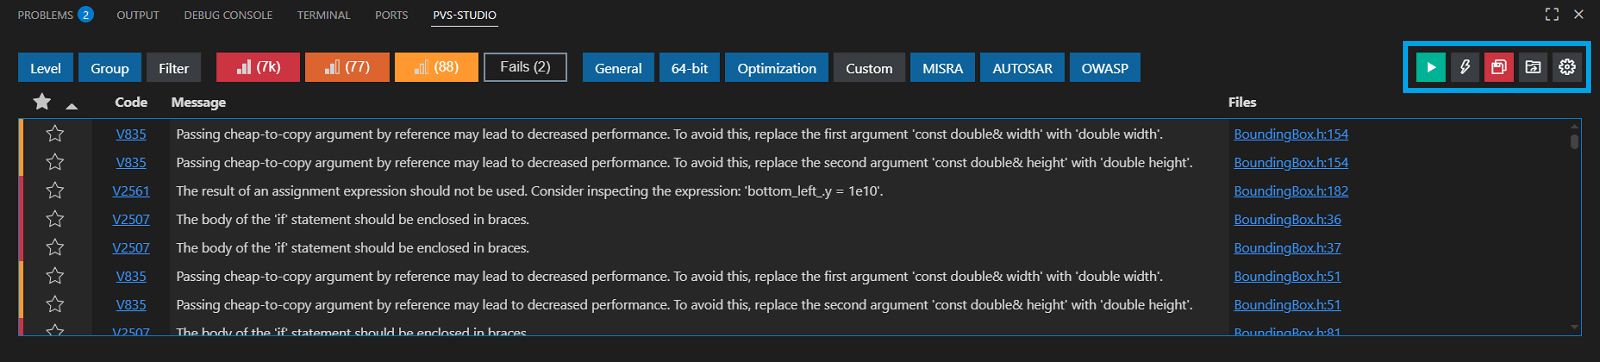
After this, the report with warnings will be displayed in the table:
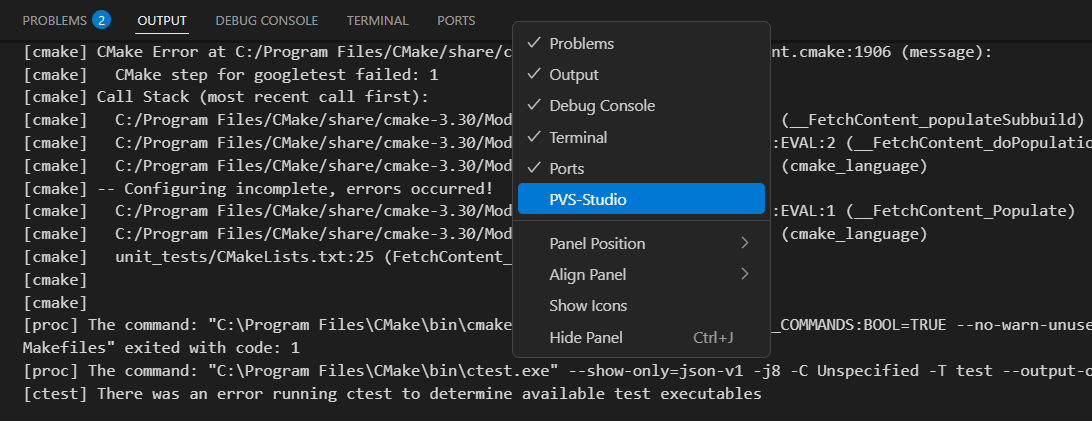
For easier access to the table, pin it to the panel. To do this, right-click the panel header and check the PVS-Studio box if it is unchecked:
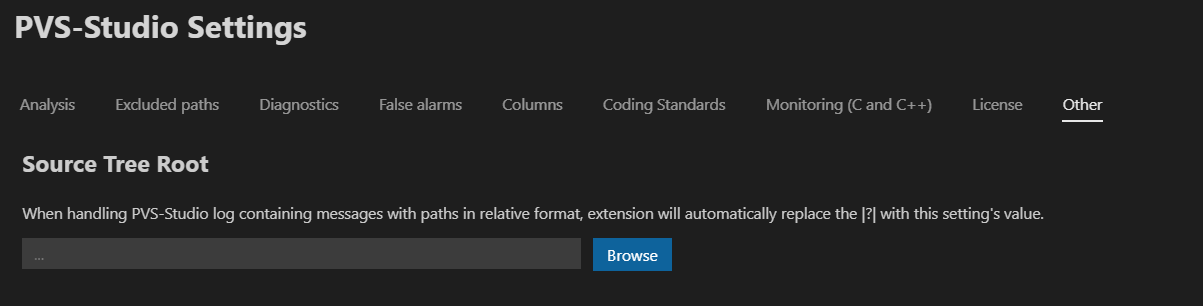
To work with a report containing relative paths, use the Source Tree Root setting. To do this, open the settings window, click the Browse button in the Other tab, and select the directory relative to which all paths in the report file will be expanded.
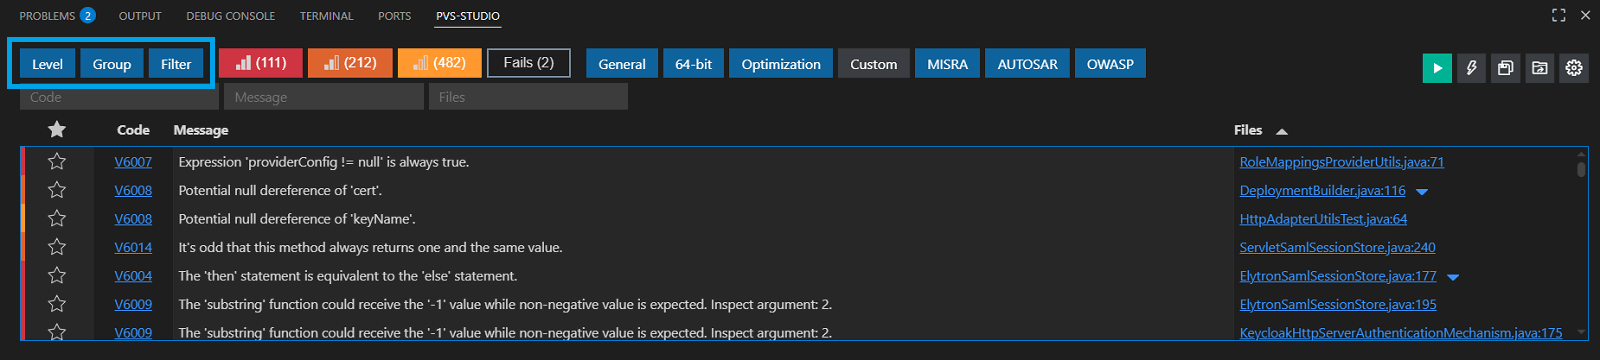
Filtering warnings
The PVS-Studio output window filtering mechanisms enable quick finding and displaying of both individual diagnostic rules and entire groups. There are switches among the window tools that enable or disable warnings from the groups.
All switches fall into three groups:
- Level: filters by warning certainty levels;
- Group: message filters by diagnostic rule groups;
- Filter: filters by keywords (by message ID, by message text, and by file name with the analyzer message.
Note. To learn more about the certainty levels of warnings and diagnostic rule groups, see the documentation.
You can enable/disable the filter group using the corresponding buttons:
All of the above warning filtering mechanisms can be used together. For example, you can filter messages by warning level and group, and exclude those marked as false positives.
Suppressing warnings
The analyzer may issue many warnings for the first-time analysis of a large project. In this case, you can use the warning suppression mechanism to hide less important warnings.
To suppress all warnings, click the Suppress All Messages button in the upper-right corner of the window:
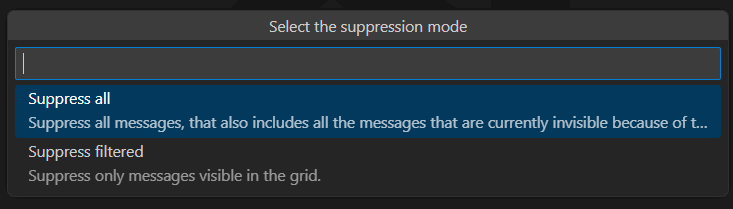
When this option is enabled, a dialog appears asking which warnings you want to suppress:
- Suppress All suppresses all warnings in the table (even those hidden by filters and settings);
- Suppress Filtered suppresses only the warnings in the table.
The selected option suppresses warnings in the existing suppress file. If the file is missing or cannot be found, it will be created in the /.PVS-Studio directory within the project.
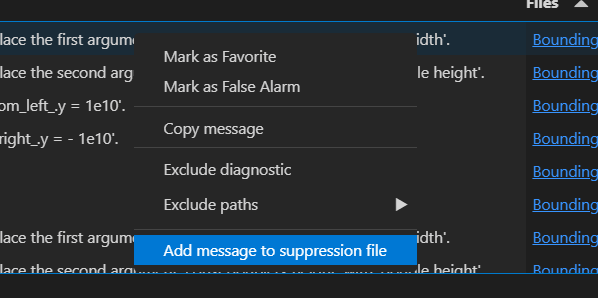
If this option is not suitable, you can use selective warning suppression instead. To do this, select the required lines in the table, open the context menu, and select Add message to suppression file:
Navigating & sorting
The PVS-Studio results window is designed to simplify navigation through project code, allowing users to quickly jump to sections containing potential errors. Double-clicking any warning in the list automatically opens the file that the message refers to.
To mark warnings that you want to revisit later, click the star icon in the left column.
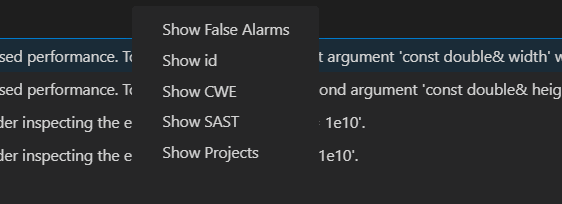
Right-clicking the table header opens a context menu where you can configure the displayed columns:
Other features
The table supports multi-selection via the standard Ctrl and Shift combinations.
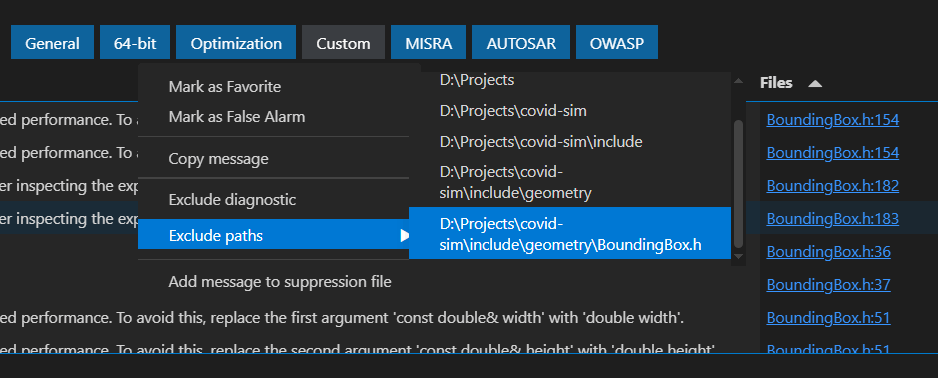
The context menu of the warning table contains several sub-items:
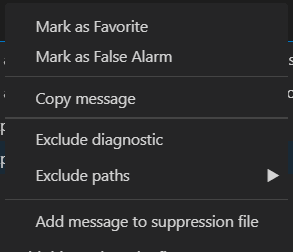
- Mark as Favorite marks the selected messages as favorites.
- Mark as False Alarm marks the selected messages as false alarms and adds a special comment to the source code.
- Copy message copies the diagnostic rule number and message, as well as the file path of the selected warning to the clipboard.
- Exclude diagnostic excludes all warnings with the same code as the selected one.
- Exclude paths excludes a path or part of a path to the selected file. Warnings for files with the selected path will not be displayed.
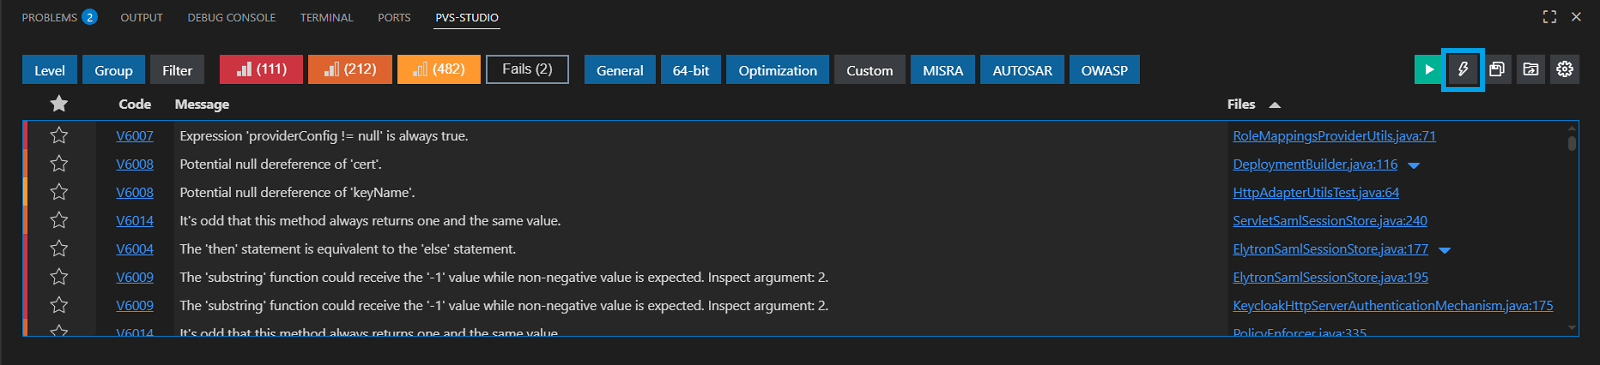
The buttons on the right side of the panel are used to start analysis, suppress warnings, save reports, open a new report, and open the extension settings. If any changes are made to the report, the button turns red, as shown in the screenshot:
How to configure the plugin
To open the settings window, click the button on the far-right of the PVS-Studio window or open the command panel (Ctrl+Shift+P) and enter PVS-Studio: Show Settings.
To save the settings in the JSON format, use the Export settings button. To upload the saved settings, use the Import settings button.
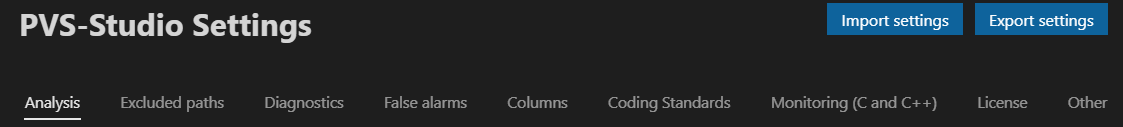
Analysis
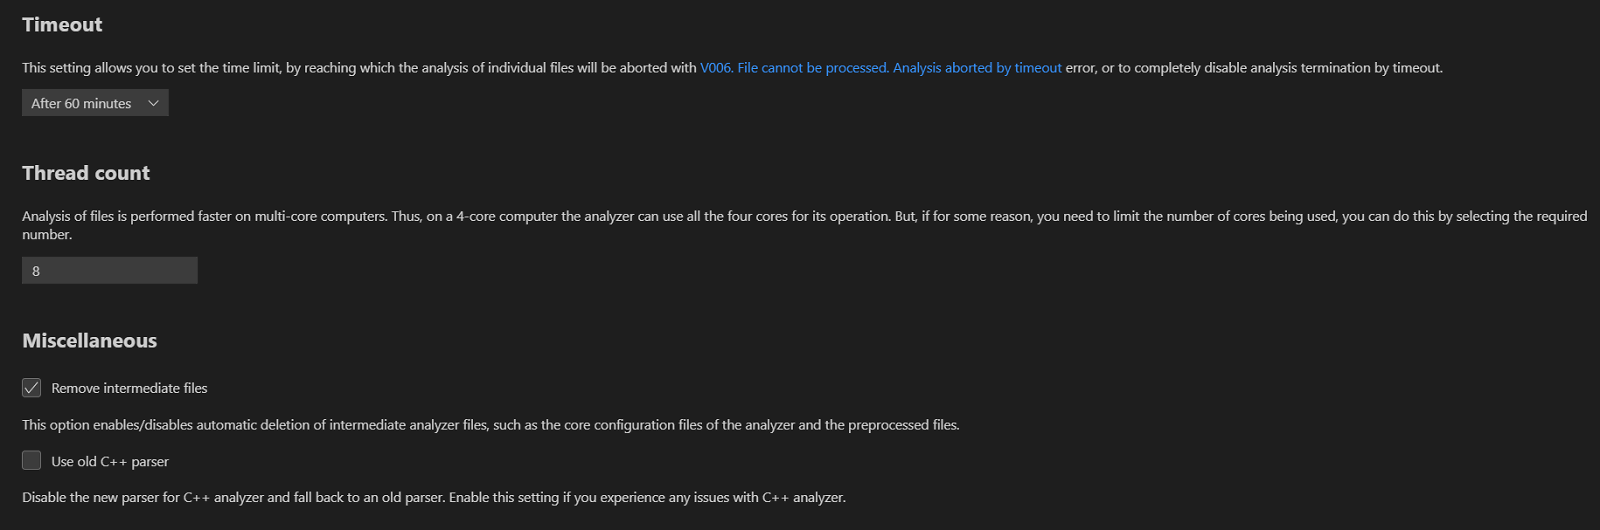
The Analysis settings group enables configuring:
- the analysis timeout (the maximum duration allowed for analysis before it stops);
- the number of threads used during the analysis.
You can enable or disable both the temporary file cleanup and the new C++ parser.
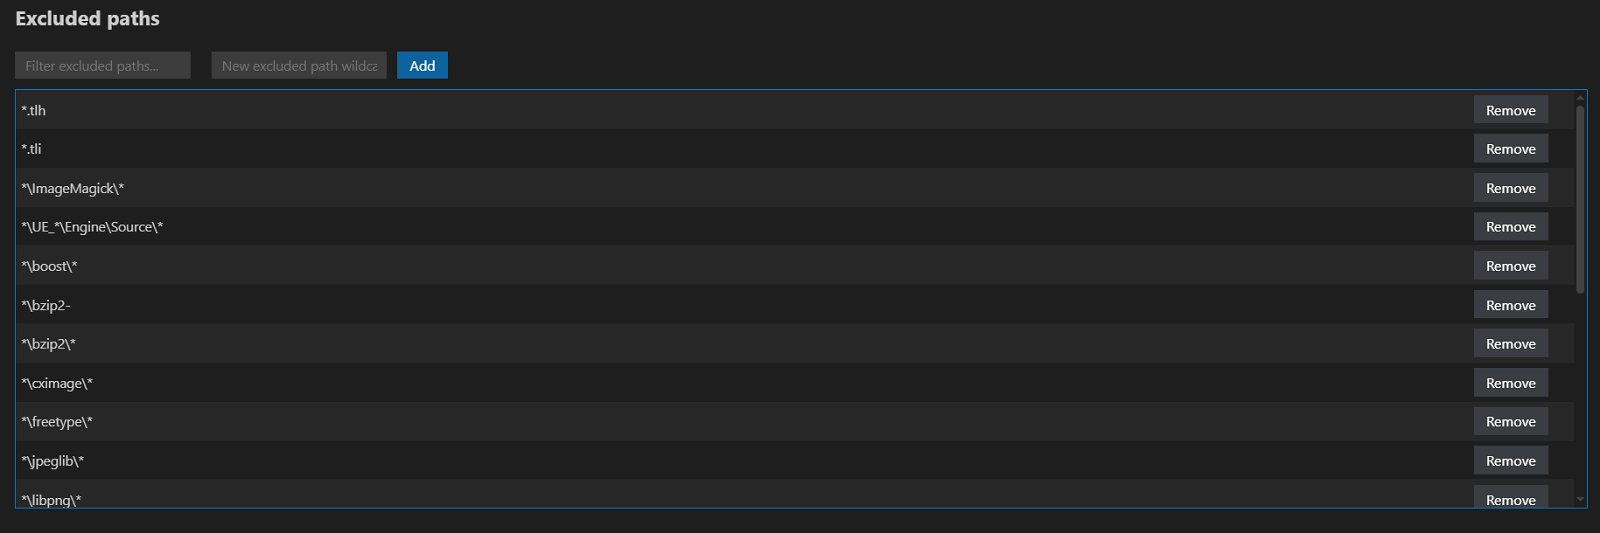
Excluded paths
The Excluded paths tab enables entering paths or path masks in the New excluded path wildcard field. Messages for files that match the mask conditions will not appear in the warning table.
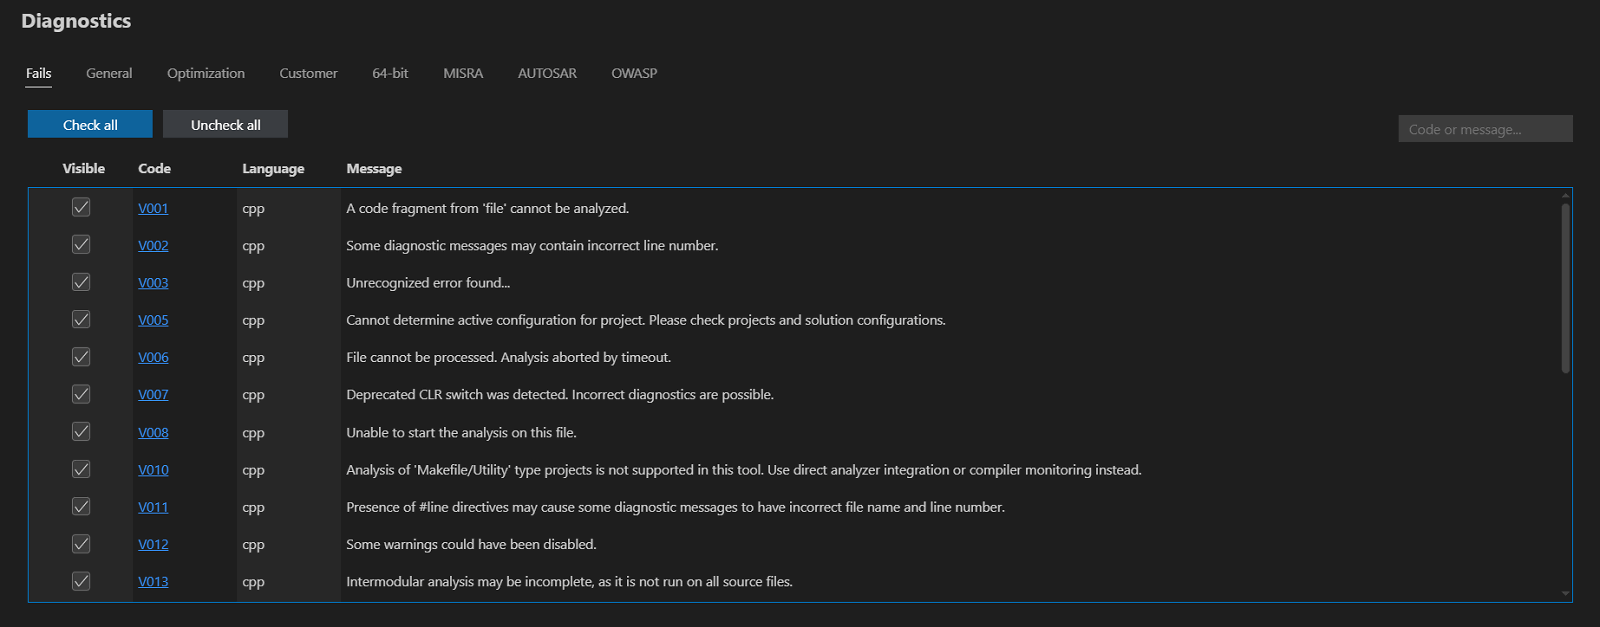
Diagnostics
The Diagnostics tab enables marking which warnings should be displayed in the warning table.
All warnings are divided into groups. To find a specific diagnostic rule, you can use the Code or message field.
To enable/disable the display of all diagnostic rules from a specific group, use Check all/Uncheck all.
If all diagnostic rules in a group are disabled, the corresponding toggle is removed from the plugin window.
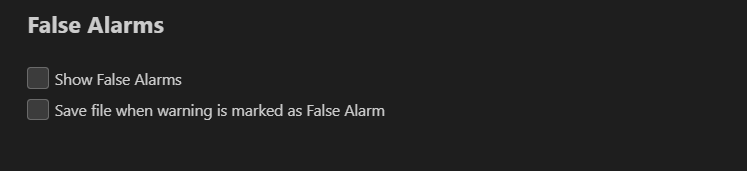
False alarms
The False alarms tab enables configuring:
- the display of false alarms;
- the automatic saving of source files when a warning is marked as false.
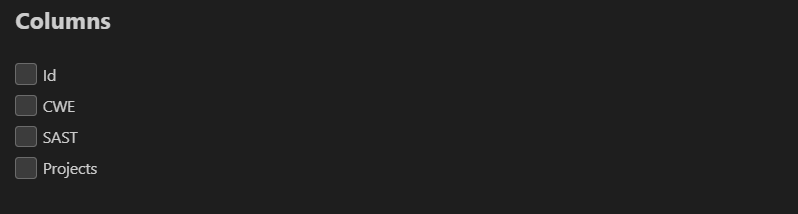
Columns
This settings tab enables selecting which columns will be displayed in the warning table.
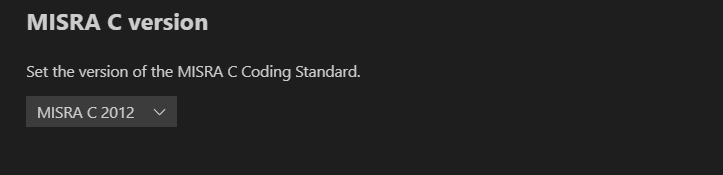
Coding Standards
This settings tab enables selecting the relevant versions of the coding standards.
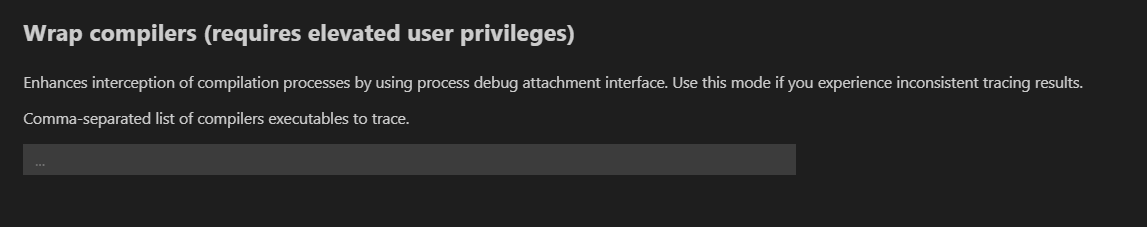
Monitoring (C and C++)
The Monitoring (C and C++) tab enables entering the names of compiler files to monitor in the Wrap compilers field, separating each name with a comma.
License
The License tab enables entering your analyzer username associated with the license key and license key. If you entered valid data, a message containing the license information will appear.
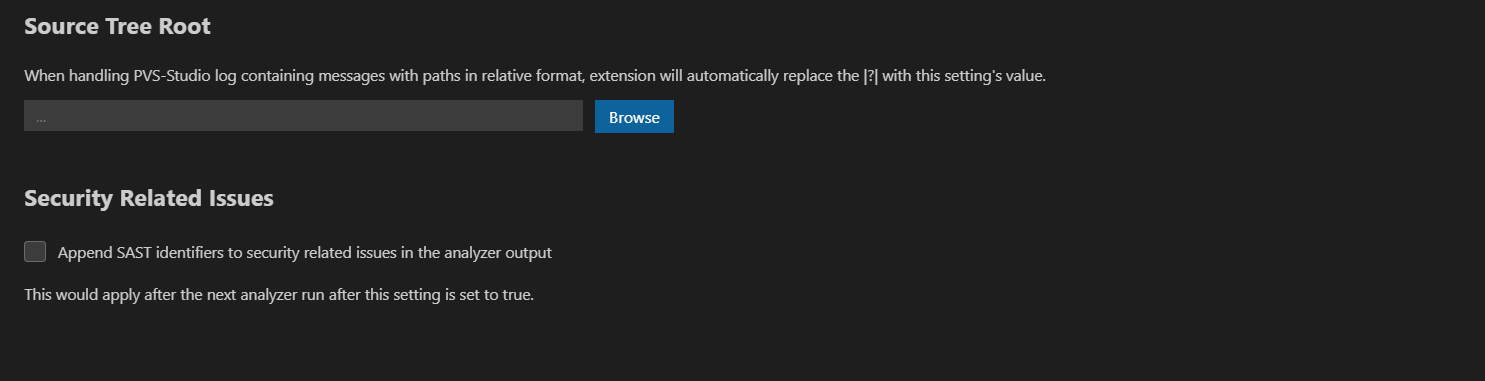
Other
The PVS-Studio reports contain relative file paths. To work with them, replace these paths with absolute ones. The Source Tree Root setting enables specifying the directory relative to which all paths in the report file are expanded. You can find a detailed description of how to use relative paths in the PVS-Studio report files here.
When the Security Related Issues setting is enabled, potential security issues will be highlighted with additional markings in the SAST column of the analysis results.
Managing PVS-Studio plugin versions
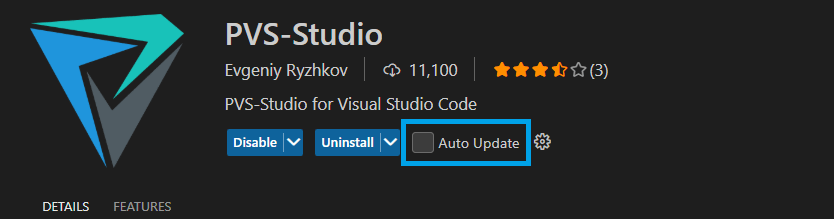
PVS-Studio plugin for VS Code is strictly bound to the installed analyzer version. Plugins are automatically updated by default, which can lead to desynchronization between the plugin and analyzer versions. To avoid potential compatibility issues, either disable automatic plugin updates or update PVS-Studio analyzer.
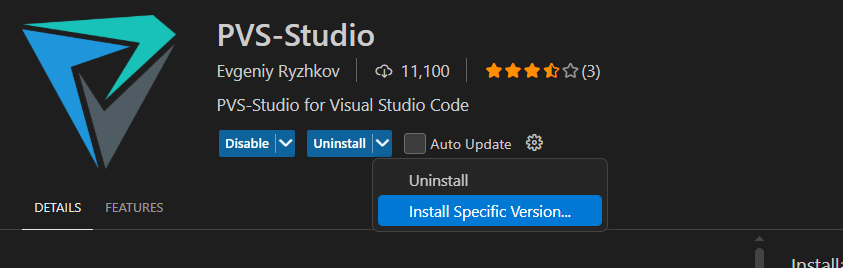
To disable automatic updates in VS Code, open Extensions and find PVS-Studio plugin. Open its settings and uncheck the Auto Update checkbox.
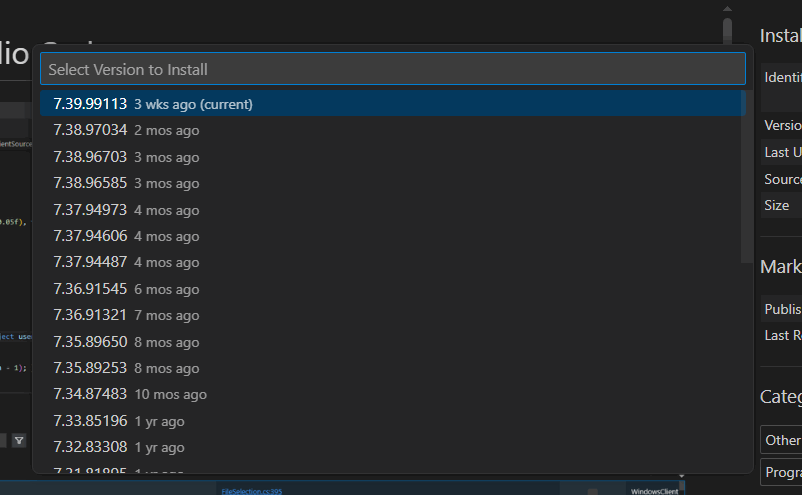
VS Code enables installing the required plugin version. To enable it, open the dropdown next to the Uninstall button and select Install Specific Version.
Then, choose the required version, which will be installed automatically.
Was this page helpful?