
How to use the OWASP diagnostic group in PVS-Studio
This section describes various ways of checking code for compliance with OWASP ASVS using PVS-Studio.
How to enable the OWASP rules in PVS-Studio
You can find the description of all diagnostic rules here: "PVS-Studio messages". If you are interested in the diagnostic rules from the OWASP group, then you may also find interesting the following classifications of the PVS-Studio warnings:
As noted above, the OWASP ruleset is disabled by default. Let's look at the ways how to enable and configure these rules.
If you use the PVS-Studio plugin for IDE
If you run the analysis with the plugin for Visual Studio or some other IDE, use graphical interface to enable the OWASP ruleset.
To do this, go to the analyzer settings. For example, in Visual Studio 2019, open Extensions -> PVS-Studio -> Options:

For other IDEs, ways to enable the OWASP rules may differ. For more information, including information on how to open settings in other IDEs, read "Getting acquainted with the PVS-Studio static code analyzer on Windows".
In Options, click on the "Detectable Errors" tab for the language you need. Here you need to change the option for the OWASP group:
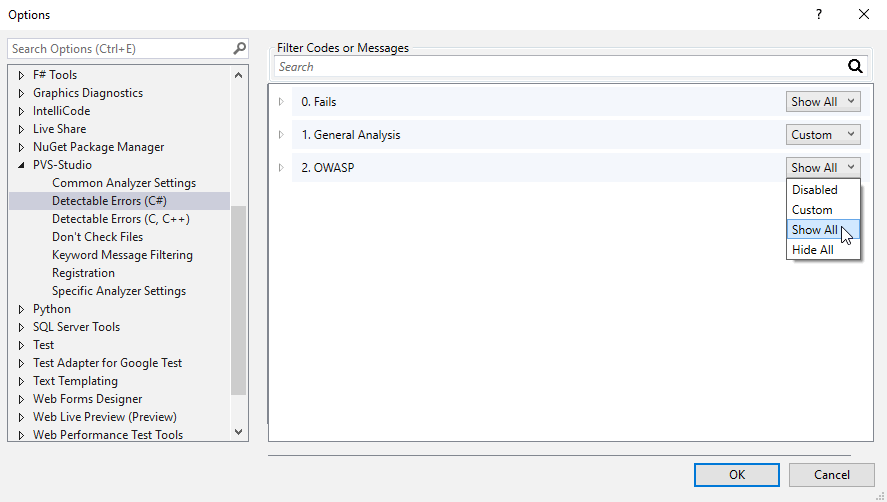
By default, the OWASP group of rules is set to 'Disabled'. That means that all the OWASP group rules are disabled for the certain language. To enable them, select 'Custom', 'Show All' or 'Hide All' depending on your needs. Read more about these and other settings in the documentation. For example, the "Settings: Detectable Errors" section contains description of the "Detectable Errors" tab.
The 'Show All' option enables the entire message group. Accordingly, the PVS-Studio output window will display the warnings that correspond to the rules from this group. At the same time, a button will appear in the upper part of the window. It displays or hides warnings from the corresponding group:
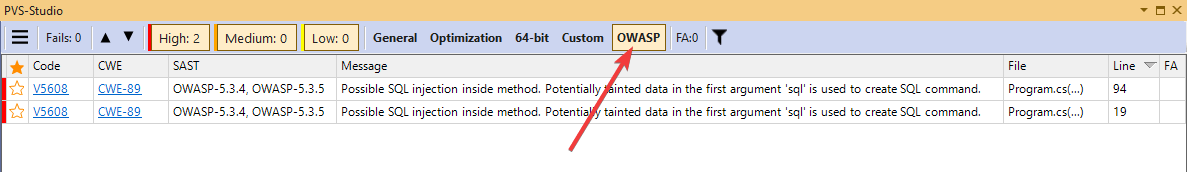
Note that each of the OWASP warnings has the corresponding SAST and CWE identifier. In addition, almost all warnings have the corresponding CWE. Find more information on how to manage the warning output window here: "Handling the diagnostic messages list in Visual Studio". You can adjust settings of the output window in other IDEs in a similar way.
If you run the analyzer from a command-line
If you run the analysis through the command line interface, then most likely you need to edit the settings file manually (i.e., not through the graphical interface).
Below is a brief description of how to enable OWASP ruleset in various situations.
How to enable OWASP rules in the C# analyzer
The main way to configure the C# analyzer for any OS is to edit the Settings.xml file. It is the same Settings.xml file that is used by plugins for Visual Studio, CLion and Rider.
By default, the file has the following path:
- Windows: "%APPDATA%\PVS-Studio\Settings.xml";
- Linux/macOS: "~/.config/PVS-Studio/Settings.xml".
Also, when you start the analysis, you can pass the path to the settings as a command-line argument. For more information about the command-line utilities usage, see "Analyzing Visual Studio/MSBuild/.NET projects from the command line using PVS-Studio".
The analyzer settings are stored in XML format. To enable the OWASP ruleset, focus on the following nodes:
- DisableOWASPAnalysisCs – if the node is false, then the OWASP ruleset for the C# analyzer will be enabled. If the node is true - the rules will be disabled;
- DisableDetectableErrors – the node that contains a list of the rule codes separated by a space (examples of diagnostic codes: V3163, V5608, V3022). The display of these rules will be disabled.
Accordingly, to enable checking code for compliance with OWASP, write the corresponding values in 'DisableOWASPAnalysis' and 'DisableOWASPAnalysisCs'. Also, make sure that the rules you need are not written in the 'DisableDetectableErrors' node.
How to enable OWASP ruleset in the C++ analyzer
Windows
To set up the C++ analyzer on Windows, you can also use the Settings.xml file (described above). It works if you run the analysis with the following tools:
- plugin for Visual Studio, Rider or CLion;
- PVS-Studio_Cmd console utility;
- C and C++ Compiler Monitoring UI.
To enable the OWASP ruleset, set the corresponding values for the 'DisableOWASPAnalysis' nodes (analogous to 'DisableOWASPAnalysisCs' for C++) and 'DisableDetectableErrors'.
Sometimes it may be necessary to run the C++ analyzer directly (via PVS-Studio.exe). In this case, you need to adjust the settings with the '*.cfg' file. The path to the file needs to be passed as the '--cfg' parameter value:
PVS-Studio.exe --cfg "myConfig.cfg"To get more information on how to run the analysis this way, see "Direct integration of the analyzer into build automation systems (C/C++)". To enable the OWASP rules in the configuration file, check the value of the 'analysis-mode' parameter. The value allows you to manage the groups of diagnostic rules that are enabled. It must be the sum of numbers corresponding to the enabled groups. For example, '4' corresponds to the General Analysis, and '128' - to the analysis with the enabled OWASP rules. If you need to use only these two groups, pass '132' to 'analysis-mode'. If this parameter is not set (or the value is 0), then all available groups, including OWASP, will be used in the analysis.
Moreover, this parameter can be set as a command-line argument:
PVS-Studio.exe --analysis-mode 132 ....Linux
For Linux, we adjust settings in about the same way as when we use 'PVS-Studio.exe'. Execute the 'pvs-studio-analyzer analyze' command to run the analysis. Among the command parameters, it is worth to mention 'analysis-mode' and 'cfg'.
'--analysis-mode' (or '-a') determine the warning groups which will be enabled during analysis. To enable the OWASP rules, the 'OWASP' must be written in the list of groups separated by ';'. Example:
pvs-studio-analyzer analyze .... -a GA;MISRA;OWASP'--cfg' (or '-c') allows you to specify the path to a special configuration file - '*.cfg'. This file is similar to file that we used for 'PVS-Studio.exe ' (described above).
Find more information in the section "How to run PVS-Studio on Linux and macOS".
How to enable OWASP in the Java analyzer
The following documentation page is devoted to the Java analyzer: "Direct use of Java analyzer from command line". It provides all the information necessary to run the analysis, enable OWASP diagnostics, etc. To activate OWASP rules, below is a brief description of the settings that you need to change.
The way to enable the OWASP ruleset depends on the tools you use to run the analysis.
For example, if you use the plugin for Maven ('pvsstudio-maven-plugin'), then in its configuration (in the 'pom.xml' file) you need to add the 'OWASP' value to the <analysisMode> node. Also, check the values in the <enabledWarnings> and <disabledWarnings> nodes. Example:
<build>
  <plugins>
    <plugin>
      <groupId>com.pvsstudio</groupId>
      <artifactId>pvsstudio-maven-plugin</artifactId>
      <version>7.14.50353</version>
      <configuration>
        <analyzer>
          <outputType>text</outputType>
          <outputFile>path/to/output.txt</outputFile>
          <analysisMode>GA,OWASP</analysisMode>
        </analyzer>
      </configuration>
    </plugin>
  </plugins>
</build>
If you use the plugin for Gradle, open the 'build.gradle' file and edit the 'analysmode' value in the 'pvsstudio' block. Check the 'enabledWarnings' and 'disabledWarnings' as well. Example:
apply plugin: com.pvsstudio.PvsStudioGradlePlugin
pvsstudio {
  outputType = 'text'
  outputFile = 'path/to/output.txt'
  analysisMode = ["GA", "OWASP"]
}
You can also configure both these plugins from the command line.
How to disable and filter individual diagnostic rules
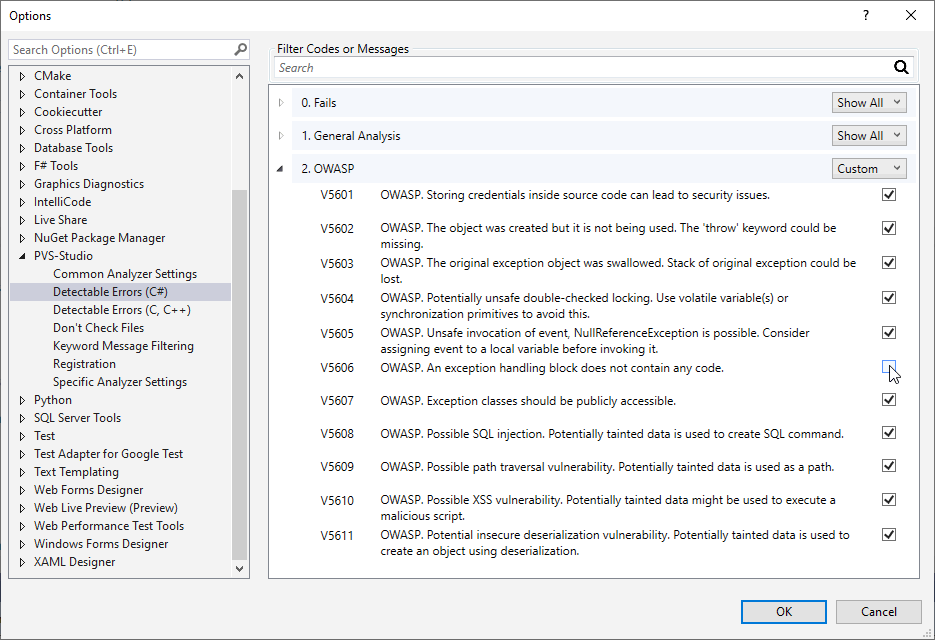
After you enabled the OWASP ruleset, it may turn out that the triggerings of some rules on your project is irrelevant. For example, V5606 checks the code for compliance to the OWASP ASVS 7.4.2 position:
Verify that exception handling (or a functional equivalent) is used across the codebase to account for expected and unexpected error conditions.
According to the requirement, the V5606 rule generates a message if it detects empty catch or finally block.
Let's say, it is acceptable to have empty exception handling blocks in your project. In this case, you do not need to receive the V5606 messages. For convenience, you can hide them from the analyzer output. Use one of the methods described below.
Common Analyzer Settings
You can hide the analyzer messages through the analyzer's general settings. Change the settings either manually (as described above) or through the plugin for IDE:
Usage of the pvsconfig file
Benefits of using pvsconfig
You cannot disable individual diagnostics (only groups as a whole) while changing the settings in the IDE plugin or editing 'Settings.xml'. Instead, the generated messages will simply be hidden when viewing the log in the IDE. In some cases, such behavior of messages can be convenient. However, in other cases it would be more logical to completely disable the diagnostic.
In addition, sometimes you need to disable the triggerings of certain levels.
For example, some rules that allow the taint analysis implementation consider parameters of publicly available methods potential sources of tainted data. You can find the explanation of such behavior in the note "Why you should check values of public methods' parameters". The analyzer issues a warning at the low certainty level when the source of potentially tainted data is parameter of public method.
It is possible that warnings about the need to validate parameters are not relevant for your project. At the same time, you don't want to completely disable the rule or hide its warnings. It's more convenient to disable warnings at a specific level.
The pvsconfig files allow the user to disable warnings at a specific level, as well as to completely disable diagnostics, redefine the level, etc.
How to create pvsconfig
Files with the pvsconfig extension allow additional adjustment of the analysis settings. Currently, one can use these files during analysis of C++ and C# projects.
The "Suppression of false positive warnings" page describes both the possibilities of disabling diagnostics through pvsconfig, as well as other ways to exclude unwanted triggerings. The description of other features, such as changing warning levels or replacing substrings in messages, find in the section "Additional diagnostics settings".
To use the functionality, simply add a file with the pvsconfig extension to the project or solution.
The most convenient way to create pvsconfig is through the IDE. Use a special template:
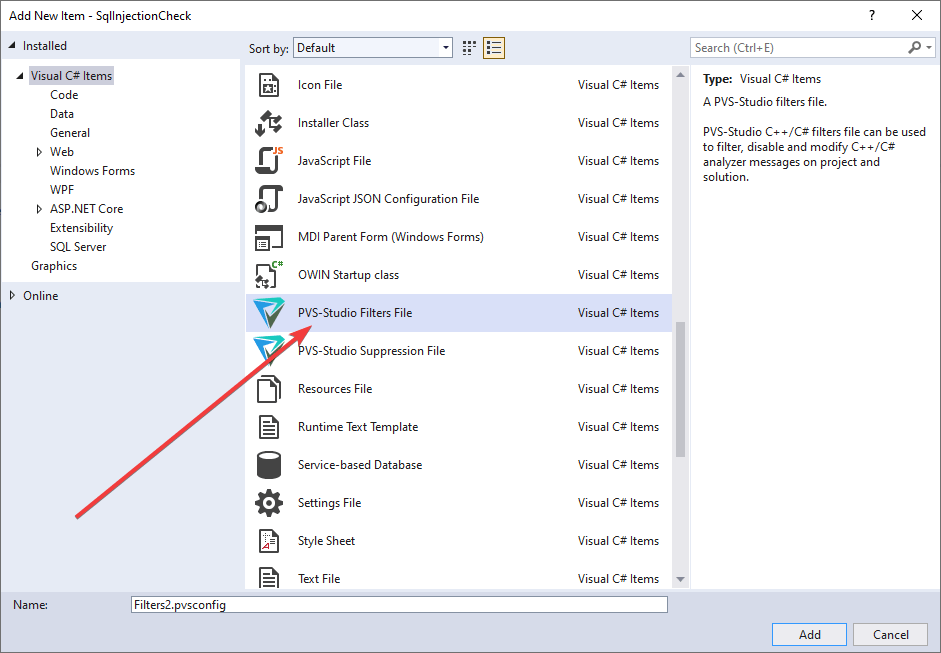
In this case, the file you created will contain various commented-out examples. It simplifies writing your own instructions:
# Example of PVS-Studio rules configuration file.
# Full documentation is available at
# https://pvs-studio.com/en/docs/manual/full/
# https://pvs-studio.com/en/docs/manual/0040/
#
# Filtering out messages by specifying a fragment from source code:
# //-V:textFromSourceCode:3001,3002,3003
#
# Turning off specific analyzer rules:
# //-V::3021,3022
#
# Changing in analyzer's output message:
# //+V3022:RENAME:{oldText0:newText0},{oldText1:newText1}
#
# Appends message to analyzer's message:
# //+V3023:ADD:{Message}
#
# Excluding directories from the analysis:
# //V_EXCLUDE_PATH \thirdParty\
# //V_EXCLUDE_PATH C:\TheBestProject\thirdParty
# //V_EXCLUDE_PATH *\UE4\Engine\*
#
# Redefining levels:
# //V_LEVEL_1::501,502
# //V_LEVEL_2::522,783,579
# //V_LEVEL_3::773
#
# Disabling groups of diagnostics:
# //-V::GA
# //-V::GA,OWASP
#
# Disabling messages with specified warning levels:
# //-V::3002:3
# //-V::3002,3008:3
# //-V::3002,3008:2,3
#
# Rule filters should be written without '#' character.
Pvsconfig provides a large number of different ways to configure the analysis - from changing the level to changing the output messages themselves or completely disabling diagnostics. Let's look at some features of the pvsconfig.
Note. Some functions may be available only for specific analyzers – read more about this in the sections "Suppression of false positive warnings" and "Additional diagnostics configuration".
Example of rule disabling
To disable, for example, the V5606 rule (the one about empty catch and finally blocks), add the following line to the file:
//-V::5606Example of disabling warnings at specific level
You also can disable the diagnostic warnings at a specific level. Earlier, we studied an example with taint diagnostics that issue the 3rd level warnings if a parameter is a taint source. For example, you need to exclude warnings about potential SQL injections, where a parameter is a taint source. Add the following line to pvsconfig
//-V::5608:3Therefore, the 3rd level warnings of V5608 will be excluded from the analysis results.
Example of level redefinition
The pvsconfig has another useful feature: it helps redefine the level of warnings issued by diagnostic. For example, you can redefine the level of all V5609 triggerings:
//V_LEVEL_2::5609This line tells the analyzer to generate warnings of the V5609 rule with the second (average) certainty level.
Was this page helpful?