
How to use the PVS-Studio extension for Qt Creator
- How to install and update the PVS-Studio extension
- Interface
- Running PVS-Studio analysis
- How to work with analysis results
- How to configure the plugin
The PVS-Studio plugin for Qt Creator provides an easy-to-use graphical interface for analyzing projects and individual files, as well as for handling the analyzer's warnings. In this document, you can find instructions on how to install and configure the extension as well as main use case scenarios.
How to install and update the PVS-Studio extension
First, you need to get the right extension version. You can find it in the PVS-Studio installation directory.
- For Windows, the default path is 'C:\Program Files (x86)\PVS-Studio\QtCreatorPlugins'.
- For Linux/macOS: '$PREFIX/lib/pvs-studio/plugins', where '$PREFIX' is the installation prefix (often it's '/usr').
Supported versions of Qt Creator
Due to restrictions of the Qt Creator integrated development environment, you can run only those plugin versions that were created specifically for this IDE. The list of supported IDE versions is specified in the table below:
|
Qt Creator version |
PVS-Studio plugins support status |
|---|---|
|
8.0.x |
End of support. The latest available version is 7.31 |
|
9.0.x |
End of support. The latest available version is 7.34 |
|
10.0.x |
End of support. The latest available version is 7.35 |
|
11.0.x |
End of support. The latest available version is 7.37 |
|
12.0.x |
End of support. The latest available version is 7.39 |
|
13.0.x |
End of support. The latest available version is 7.41 |
|
14.0.x |
Supported |
|
15.0.x |
Supported |
|
16.0.x |
Supported |
|
17.0.x |
Supported |
|
18.0.x |
Supported |
|
19.0.x |
Supported |
The 'x' character in the name of the plugin file can be replaced by any digit. That is, the 8.0.x version support means that the plugin is compatible with versions 9.0.0, 9.0.1, and 9.0.2.
The target version of Qt Creator and a platform are specified in the plugin archive's name. For example: 'pvs-studio-qtcreator-11.0.x-7.25.73595.503.windows.zip' or 'libpvs-studio-qtcreator-11.0.x-7.25.73595.503.linux.tar.gz'.
Installation with Qt Creator Wizard
Note. Qt Creator 15.0.0 has an issue when installing plugins for a specific user via the installation wizard. The path where plugins are installed is different from where they are searched. This issue has been fixed since the 15.0.1 version.
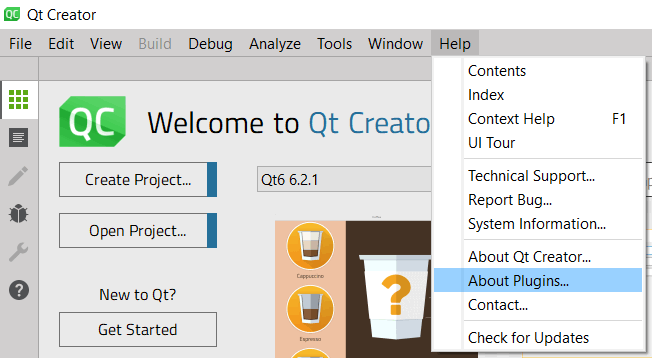
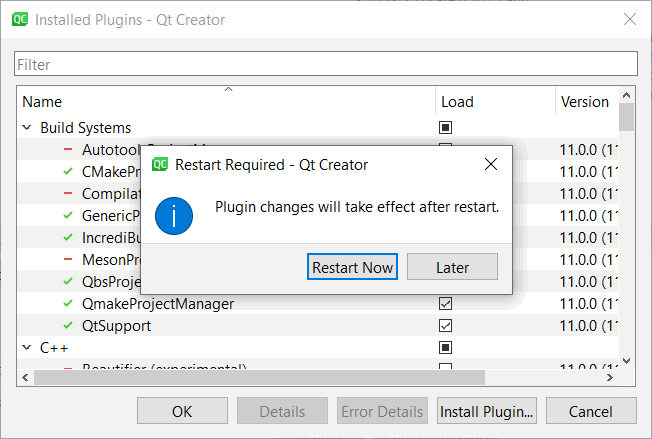
To install the PVS-Studio extension, open Qt Creator and select 'Help' -> 'About Plugins':
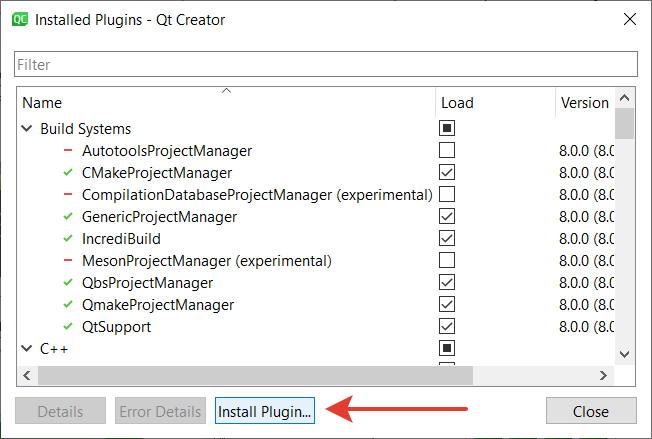
Click 'Install Plugin...':
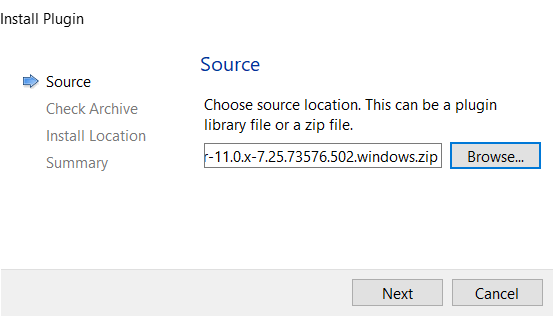
In the installation wizard, specify the location of the plugin archive (depending on the platform, the plugin file will have the '.zip' or '.tar.gz' extension).
Note: do not extract the plugin from the archive before installing it. Qt Creator Wizard claims to support direct plugin installation. However, this method often fails in practice. Therefore, we recommend installing the plugins without extracting them.
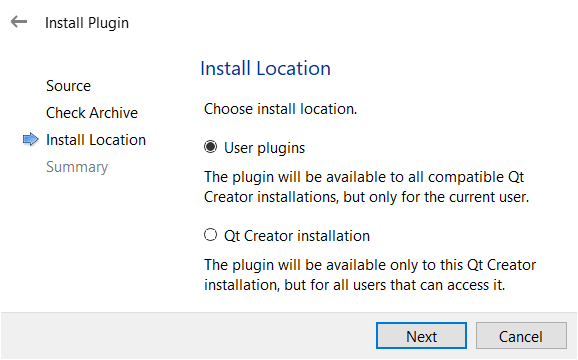
The installation wizard will ask you to specify a location where the plugin will be installed. Select the preferred option, click Next, and confirm the installation.
Note: administrator rights may be required for the "Qt Creator installation" location. Otherwise, you will get an error saying that you do not have permission to install the plugin to this directory.
No confirmation window will be displayed when the plugin installation is complete. After closing the installation wizard, click "OK". A message will appear saying that new plugins will be available only after restarting Qt Creator. Click 'Restart Now', and the IDE will automatically restart.
Manual installation
If you are unable to install the plugin using the installation wizard, you can do it manually. To do this, copy the plugin file to the directory with plugins for Qt Creator. Depending on the platform, the file will have the '.dll' or '.so' extension. By default, Qt Creator searches for plugins in the following directories:
Windows:
%Qt_installation_directory%\Tools\QtCreator\lib\qtcreator\plugins
%APPDATA%\Local\QtProject\qtcreator\plugins\%qt_creator_version%
Linux:
/opt/Qt/Tools/QtCreator/lib/qtcreator/pluginsManual installation (option two)
You can use this option when it's impossible to install the plugin in standard directories. When starting Qt Creator, you can specify additional directories to search for plugins. Specify these directories using the '-pluginpath' flag.
For example, you can run the IDE with the following command:
- Windows: qtcreator.exe -pluginpath "%path_to_plugin_directory%"
- Linux: qtcreator -pluginpath "$path_to_plugin_directory"
How to update the plugin
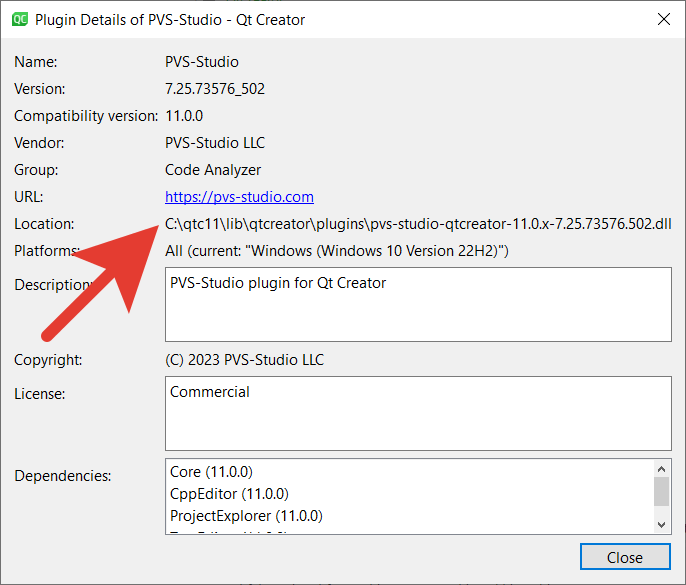
To update the plugin, simply delete the files of previous versions, choose a preferred way to install the new version, and install it. You can find the plugin location by selecting 'Details' in the list of installed plugins.
How to troubleshoot problems with plugin running
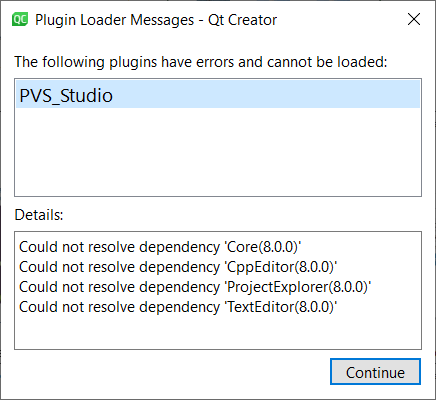
When you run Qt Creator, you may see a message: the PVS-Studio plugin cannot be loaded because the suitable dependencies cannot be found (as shown below). To fix it, check the plugin version and the Qt Creator version used. You can find the Qt Creator version by going 'Help' -> 'About Qt Creator'. The plugin version is specified in the name of its file.
Since Qt Creator does not have a plugin update system, the following window may appear after updating the plugin.
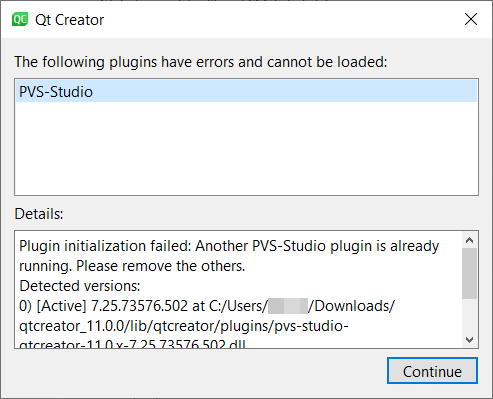
The plugin has detected that you are using multiple versions at once and has automatically disabled all versions except the latest one. It is highly recommended to uninstall older versions. For your convenience, the message also lists all detected plugin versions and their locations. The currently active plugin is marked with [Active].
Interface
The PVS-Studio plugin for Qt Creator integrates into the menu bar of the IDE and the output panel.
Integration into the menu bar
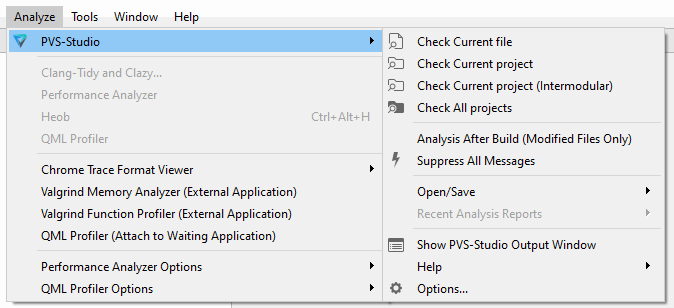
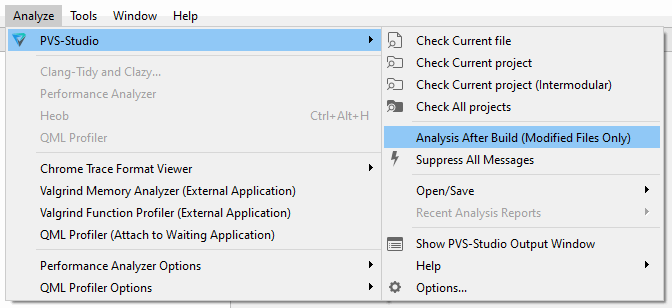
After the plugin is installed, the PVS-Studio item appears in the 'Analyze' dropdown menu. This item contains the following options:
Check runs analysis.
Analysis after Build gives you quick access to incremental analysis activation.
Open/Save allows you to load and save reports.
Recent Reports stores a list of last opened reports for quick navigation. By clicking on this menu item, you can start loading the selected file.
Help contains links to the documentation and the most important pages of the analyzer website.
Options opens the Qt Creator settings in the PVS-Studio section.
Integration into the output panel
An additional item named 'PVS-Studio' appears in the Qt Creator output panel.
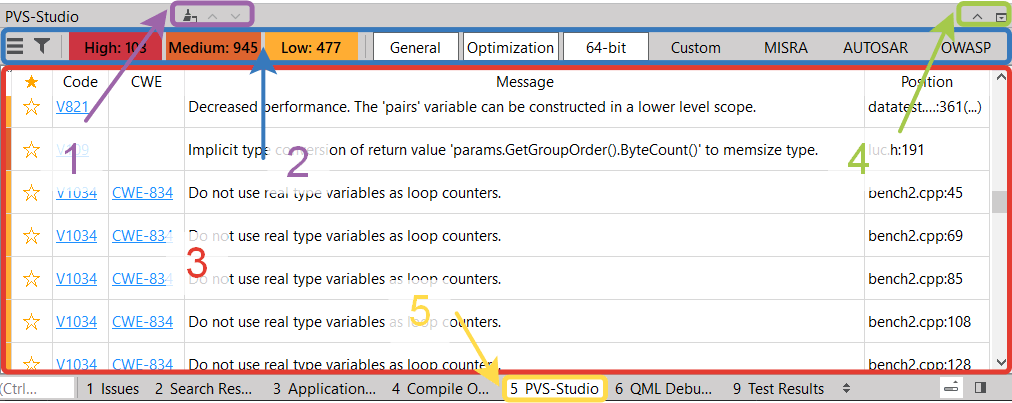
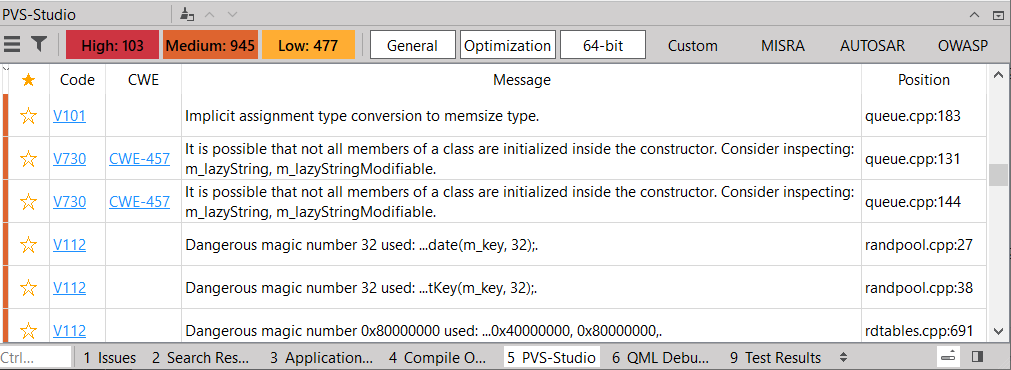
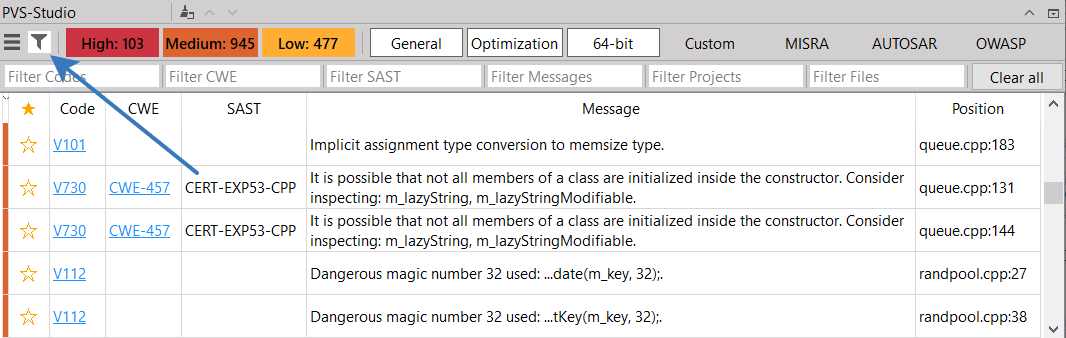
The PVS-Studio window has the following items:
1 — report control bar. The first button allows clearing the current table with warnings. The two other buttons (with arrows) allow you to navigate the table. Please note that these buttons don't navigate table rows, but positions. That is, navigating the table will open the files specified in the warnings.
2 — quick filters bar. Contains buttons for displaying additional menu and advanced filters as well as certainty level checkboxes and buttons with warning categories. When you click on the hamburger button, you'll see the following items:
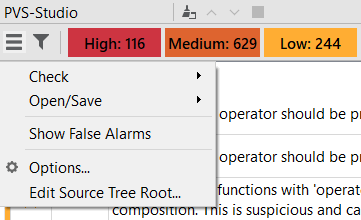
- Check contains options for running the analysis.
- Open/Save allows you to upload/save the report.
- Show False Alarms shows/hides warnings marked as false alarms. The number in parenthesis shows the number of false alarms in the current report. When you activate it, an additional column appears in the warning table.
- Options... shows the Qt Creator's settings window with the active PVS-Studio section.
- Edit Source Tree Root... allows you to quickly change the Source Tree Root settings. When activated, this item calls a dialog window where you can choose the existing directory. Please note that this option is visible only if the report contains warnings with relative paths to files. You can read more about this setting in the additional functionality section.
3 — the output area. This area solely consists of table with warnings. Further we'll describe this item in more detail.
4 — the panel control elements. The first button allows you to expand the output area by height, the second one allows you to hide the panel.
5 — a button to display the PVS-Studio panel.
Integration into settings
Integration into settings adds a new section named "PVS-Studio" into a list of existing sections.
The PVS-Studio settings section is divided into 5 subsections (one tab for each section). For more information on the purpose of each section and the settings included in them, see the "How to configure the plugin" section.
Running PVS-Studio analysis
The plugin can analyze projects and their parts as well as individual files. Currently, the plugin supports the following project types:
- CMake;
- Qmake;
- Qbs.
There are several ways to run the analysis:
- via the Analyze menu in the main Qt Creator window;
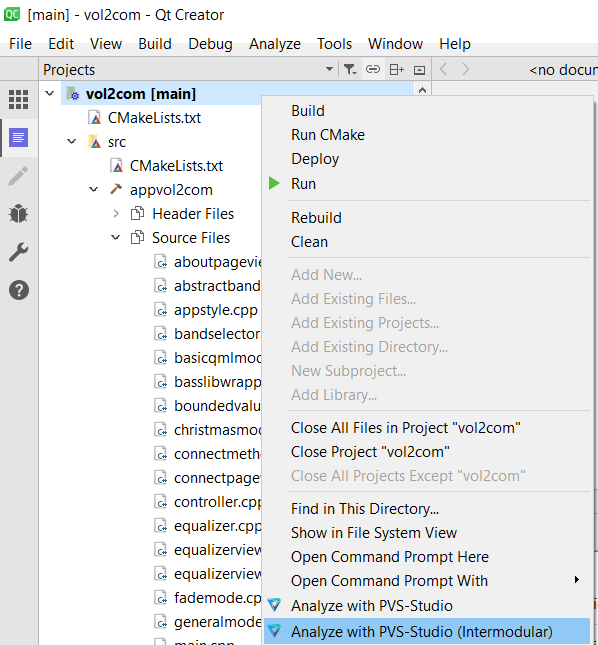
- via the context menu in the project tree (projects, folders, and individual files are supported);
- via the menu in the PVS-Studio output panel;
- via the context menu of the current file;
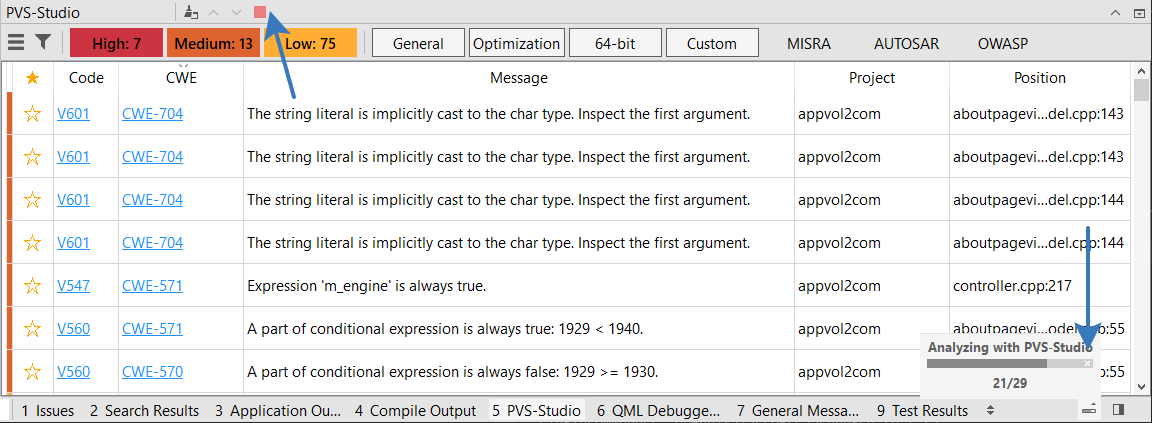
When running the analysis with any of the listed methods, a window with the analysis progress will appear in the notification area. The analyzer warnings will appear in the table as they are received. You can stop the analysis that has already started using a special button in the header of the output panel. Alternatively, you can click "cross" that is located at the end of the notification progress bar (hover the cursor over the progress bar to see it).
When starting the analysis, the contents of the '.PVS-Studio' folder in the project's source code directory are also checked. If there are user configuration files (with the *.pvsconfig extension) or suppress files (with the *.suppress.json extension), they will be passed to the analyzer for further processing.
Note: at the moment, the PVS-Studio plugin for Qt Creator supports the handling of only one suppress file. A special entry will appear in the report if multiple suppress files are found. It will also indicate which file is being used in the analysis.
In case of issues with running the analysis, a pop-up window with a detailed description of an issue will be displayed.
Additional analysis modes
The plugin supports incremental analysis. In this mode, the analysis will automatically start every time the project is built successfully. However, the analyzer will check only those files that have been changed since its last running. If you want to know more about the incremental analysis mode, see the specific documentation.
You can enable incremental analysis in the plugin settings (General->Incremental analysis). You can also use the 'Analysis after Build' menu item in the PVS-Studio submenu of the main window.
The plugin also provides the intermodular analysis mode. PVS-Studio's intermodular analysis extends the capabilities of interprocedural analysis to functions which declared in translation units that are different from the one to which the currently analyzed file belongs. Check the documentation to learn more on what intermodular analysis is, and what are its benefits.
To run the intermodular analysis, select the 'Analyze with PVS-Studio (Intermodular)' item in the context menu of the top-level project. Intermodular analysis of individual project parts is not possible.
How to work with analysis results
Note: the PVS-Studio extension for Qt Creator supports reports only in the JSON format. To display the report in a different format, you need to convert it to the JSON format.
To convert the report, use command-line utilities (PlogConverter.exe for Windows and plog-converter for Linux / macOS). These utilities allow not only to convert PVS-Studio reports into different formats, but also process it. For example, filter warnings. Read more about these utilities here.
Example of a command to convert the PVS-Studio report to the JSON format using PlogConverter.exe (Windows):
PlogConverter.exe path\to\report.plog -t json ^
                                      -n PVS-Studio
Example of a command to convert the PVS-Studio report to the JSON format using plog-converter (Linux and macOS):
plog-converter path/to/report/file.json -t json \
                                        -o PVS-Studio.json
How to upload the PVS-Studio JSON report in Qt Creator
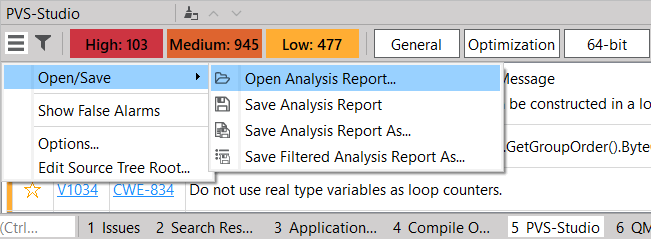
If you already have the PVS-Studio report, and you want to view it in Qt Creator, open the PVS-Studio panel, click on the menu button and select 'Open/Save' -> 'Open Analysis Report...':
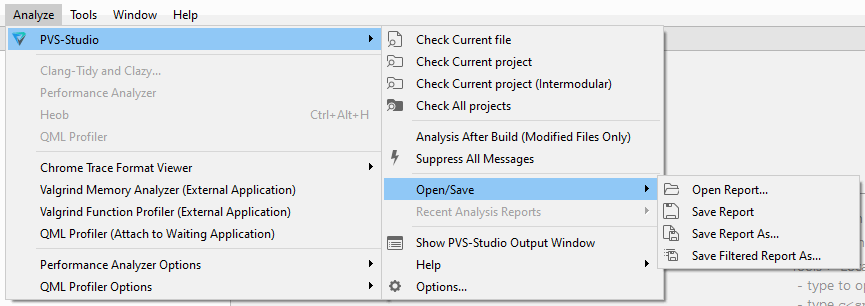
You can also open the report using the menu bar: 'Analyze -> PVS-Studio -> Open/Save -> Open Analysis Report...':
After you select and upload the report, you'll get the output area and the warnings displayed in a table:
How to navigate the report
The PVS-Studio result output window is designed to simplify navigation through the project code and code fragments containing potential errors. Double-click on the warning in the table to open the position (a file and a code line) to which the warning was issued.
Left-click on the table header to sort the contents by the selected column.
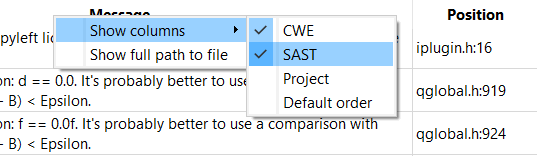
Right-click on the table header to open the context menu. Using this menu, you can show/hide additional columns as well as display full paths to files in the position column.
The warning table supports multiple selection. To activate it, left-click on and hold it while scrolling through the rows. You can also use keyboard shortcuts:
- 'Shift+Click 'or 'Shift+arrows' — multiple selection/cancel
- 'Ctrl+Click' – single selection/cancel
Note: almost all elements in the plugin have tooltips. To see them, hold the cursor over the item for a few seconds.
Columns in the report and their purpose
Level shows the unnamed first column. It displays correspondence between the certainty level and color (importance/certainty in the descending order): red — High level, orange — Medium level, yellow — Low level.
Star shows if the warnings are marked as favorite. Click on a cell in this column to mark the warning as favorite or remove the mark. This is helpful when you noticed an interesting warning and would like to return to it later.
ID shows the warning's order number in a report. This is helpful when you need to sort the report in order in which warnings are received from the analyzer.
Code shows which warnings relate to which diagnostics. Click on this cell to see the documentation on the diagnostic rule.
CWE shows the correspondence between diagnostics and the CWE classification. Click on this cell to open the documentation with the description of this security weakness.
SAST shows the diagnostics' compliance with various safety and security standards (SEI CERT, MISRA, AUTOSAR, etc.).
Message shows the text of a warning issued by the analyzer.
Project shows the name of a project, the analysis of which resulted in a warning.
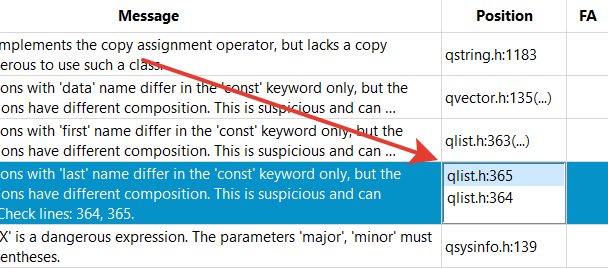
Position shows the position (file name and a line number, separated by a colon), to which a warning was issued. If you need to view the full path to the file, right-click on the table header and select 'Show full path to file'. If the analyzer warning contains several positions, (...) appears at the end of it. In this case, when you click on the position column, you'll see a list with all additional positions.
FA shows if the warning is marked as false alarm.
Note: some columns may be hidden by default. To display/hide them, right-click on the table header. In the context menu, select 'Show Columns' and then select the desired column.
Context menu
When you right-click on any warning, you'll see the context menu with a list of available additional actions:
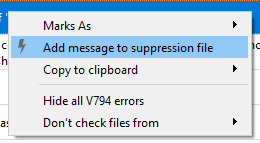
The 'Mark As' menu contains commands to quickly mark or remove the mark from the selected warnings. As for now, you can mark warnings as favorites or as false alarms. Please note that the contents of this menu change depending on the status of selected warnings.
'Suppress selected messages' allows you to suppress the currently selected messages to the suppression file. See the "How to suppress warnings" section for more details.
The 'Copy to clipboard' menu allows copying information about selected warnings. Contains several sub-items:
- All copies full information about the warning (a diagnostic number, security classifiers, a full analyzer message, a file name, and a string). Note that CWE and/or SAST ids will be included in the message only if the corresponding columns are displayed;
- Message copies only the warning text;
- Path to file copies the full path to file.
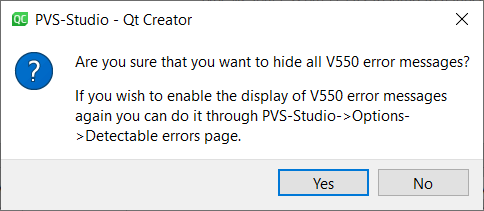
'Hide all %N errors' allows to hide all warnings related to this diagnostic from the report. When you click on this item, a pop-up window appears to confirm the operation. If you confirm the operation, the analyzer messages will be filtered out instantly.
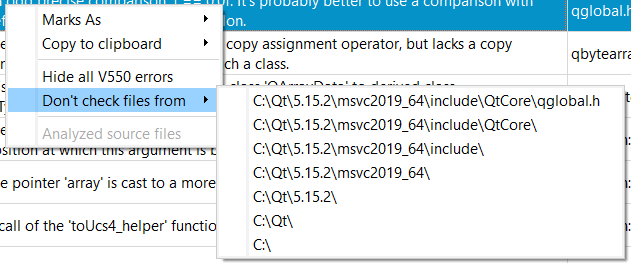
The 'Don't check files from' submenu contains parts of the path to the position's file. Use this item when you need to hide all warnings issued on files from the selected directory. When you select a value, a pop-up window appears to confirm the operation. This window also contains a tip on how to disable this filter:
The 'Analyzed source files' menu contains a list of files, analysis of which resulted in this warning. This menu is helpful when warnings were issued on header files.
How to filter a report
The PVS-Studio filtering mechanisms allow you to quickly find and display diagnostic messages separately or in groups.
All filtering mechanisms (quick and advanced filters) listed below can be combined with each other and with sorting simultaneously. For example, you can filter messages by level and diagnostic groups, exclude all messages except for those containing specified text, and then sort them by position.
Quick filters
The quick filters bar contains several buttons that allow you to enable/disable displaying warnings from certain diagnostic groups. When the list of active categories changes, all filters are also re-calculated.
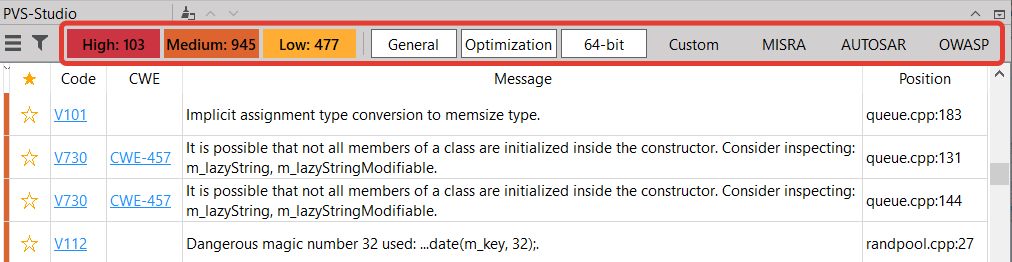
Note: the button for the 'Fails' group is displayed only if the report contains errors related to the analyzer (Their 'Code' starts with V0..).
You can read a detailed description of the certainty levels and diagnostic groups in the documentation section "Getting acquainted with the PVS-Studio static code analyzer on Windows".
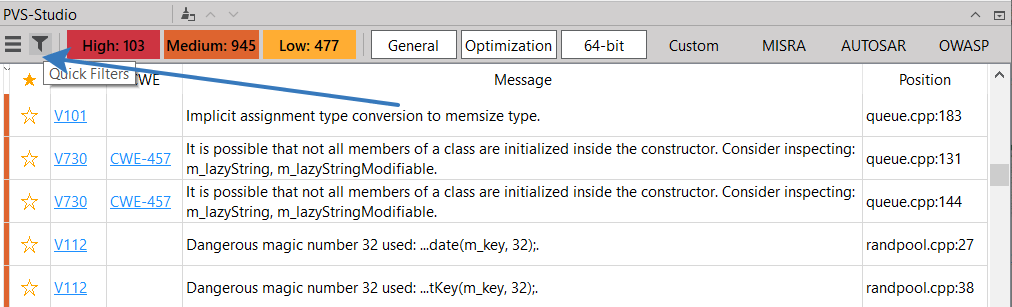
Advanced filters
You can see advanced filters if you click on 'Quick Filters'. The status of the additional filters bar (shown/hidden) does not affect the active filters. That is, you can hide this bar and filters won't be reset.
When you activate it, you'll see an additional bar that contains an input field to filter all table columns. The bar also has a button for quick clearing all filters (Clear All).
To activate the filter, press 'Enter' after you enter the text in the input field. Please note that some filters support multiple filtering (for example, Code). When you hover the cursor over the input field, a tooltip with this remainder will appear.
How to suppress warnings
When you run the analyzer for the first time to check a large project, there may be a lot of warnings. We recommend you to note the most interesting ones and hide the rest using the warning suppression mechanism.
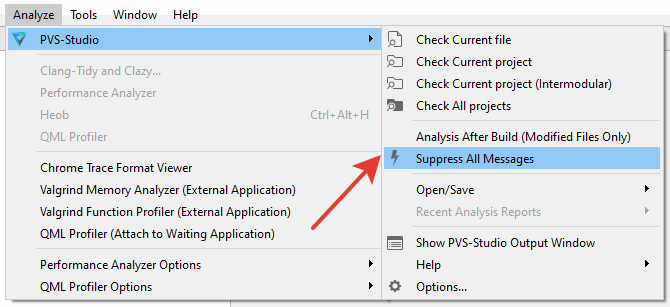
To suppress all warnings, select 'Suppress All Messages' from the plugin menu:
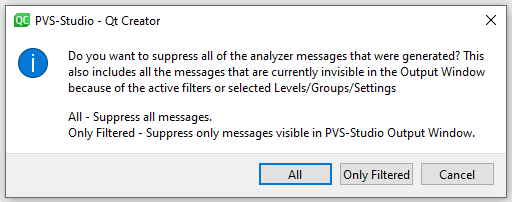
If you click it, an additional window will appear asking you which warning messages you would like to suppress:
- All suppresses all the warnings in the table (even those that are hidden with filters and settings);
- Only Filtered suppresses only those warnings that are currently in the table.
To suppress warnings to an existing suppression file, select the desired item. If the warning suppression file is not found, it will be created in the following directory: '%root_directory_of_a_project's_ source_code%/.PVS-Studio'.
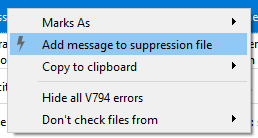
If the suggested option doesn't work for you, you can use targeted warning suppression. To do this, select the necessary rows in the table, open the context menu, and select 'Add message to suppression file'.
How to configure the plugin
To access the Qt Creator plugin settings, select the PVS-Studio section in the general settings list. You can also use the 'Options...' menu items of the plugin.
The plugin settings are stored in the 'qtcsettings.json' file which is located in:
- Windows: '%APPDATA%\PVS-Studio\qtcsettings.json';
- Linux/macOS: '~/.config/PVS-Studio/qtcsettings.json'.
All plugin settings are divided into 5 tabs:
- General shows general plugin settings;
- Detectable Errors shows configuration of active warnings;
- Don't Check Files filters warnings by path masks and file names;
- Keyboard Message Filtering filters warnings by keywords;
- Registration is a field where you can enter your registration data for the analyzer.
The 'General' tab
This tab contains the basic settings of the analyzer and the plugin.
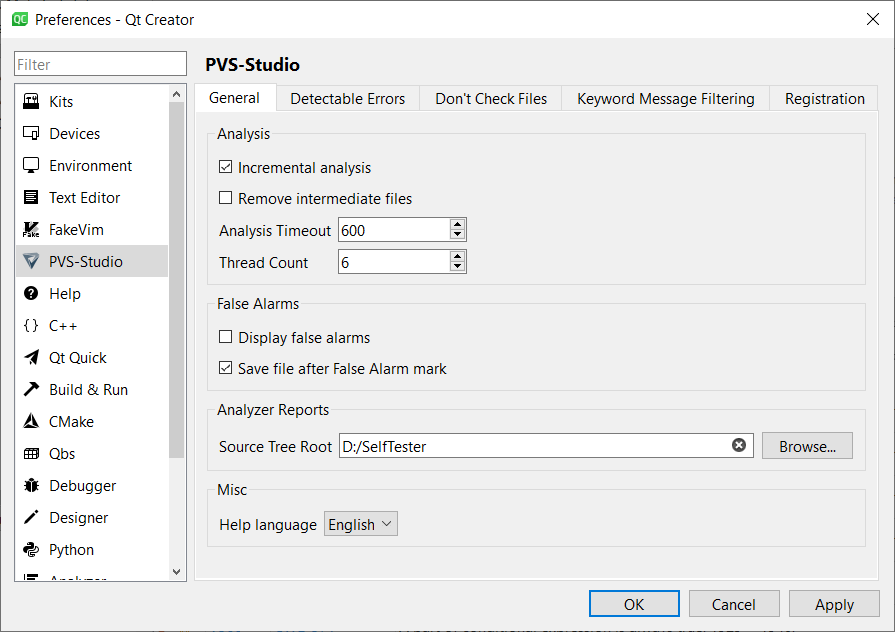
Incremental analysis enables the incremental analysis mode.
Remove intermediate files automatically deletes temporary files that the analyzer created during a session.
Analysis Timeout allows you to set the time (in seconds) after which the analysis of the current file will be skipped.
Thread Count shows the number of threads used for analysis. The larger value may speed up the analysis, although it may cause the analyzer to crash due to the lack of memory. It's better to set the value that is equal to the number of your processor's physical cores.
Display false alarms enables/disables displaying false positive warnings in the report. If you activate this setting, a new column appears in the report table.
Save file after False Alarm mark saves the changed file after a False Alarm comment is inserted.
Source Tree Root contains a path which should be used to open positions that use relative paths. For example, the '\test\mylist.cpp' relative path is written in the warning, while Source Tree Root contains the 'C:\dev\mylib' path. If the plugin tries to go to the position from the warning, the 'C:\dev\mylib\test\mylist.cpp' file will be opened.
For a detailed description of using relative paths in the PVS-Studio report files, see here.
Help Language specifies the preferred language of the documentation. This setting is used to open the documentation on the analyzer website.
The 'Detectable Errors' tab
This tab contains a list and a description of all analyzer warnings. In this tab, you can also enable/disable diagnostic groups or separate diagnostic rules.
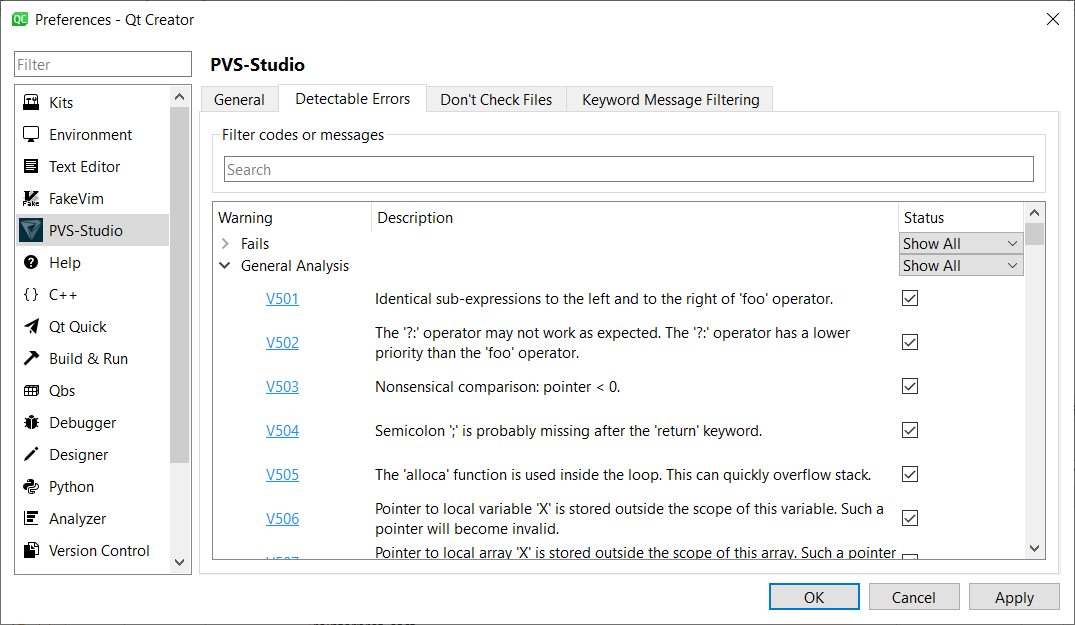
In the upper part of the window, you can do a full-text search for the description of the diagnostics and their numbers. If you click on the diagnostic's code, a corresponding documentation will open. If you hover the cursor over the text, you'll see a tooltip with a full text of the diagnostic rule. When you click on 'OK' or 'Apply', a warning table is updated to match the current filters.
All diagnostics are divided into groups. You can set the following states for them:
- Disabled is used if a category is disabled and all its warnings will not be shown in the warning list. Also, its button will be hidden from the quick filters bar (except for the General category).
- Custom is used if the category is active and the items have different states.
- Show All activates the category and all its child items.
- Hide All deactivates the category and its child items. The category button remains on the quick filters bar.
The full list of diagnostics is available on the "PVS-Studio Messages" page.
The 'Don't Check Files' tab
This tab contains lists for filtering warnings by file names or path masks. If the name or path meets at least one mask, it will be hidden from the report.
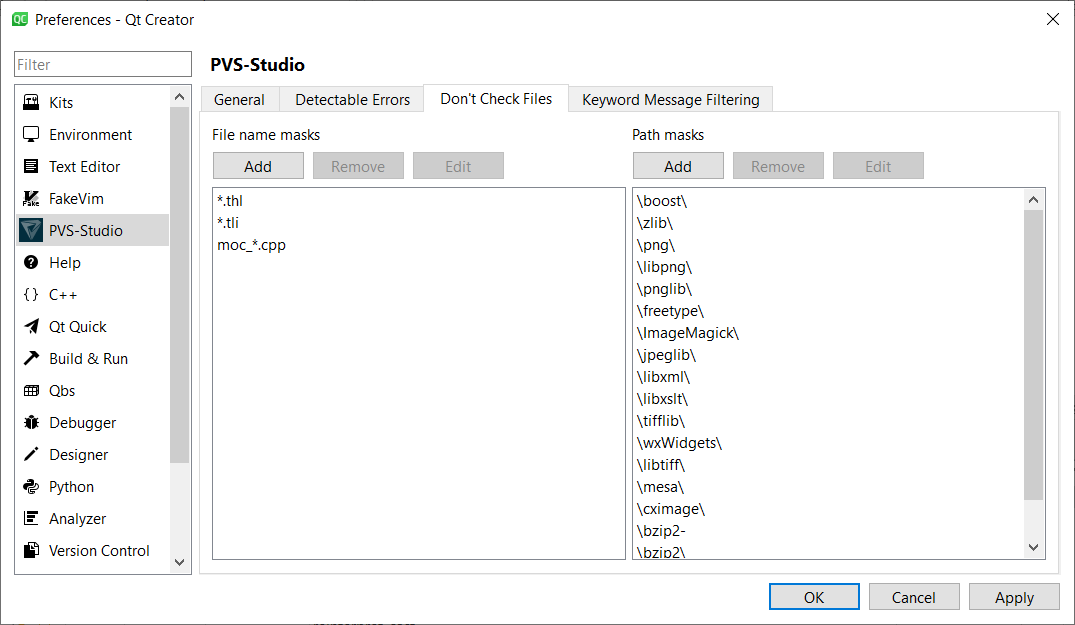
The following wildcard characters are supported:
* — any number of any characters
? — any one character
To add an entry, click on 'Add' and enter the text in the field that appears. To remove an entry, select it and click on 'Remove'. Entries with empty fields will be deleted automatically. You can edit the existing entries by double-clicking on it or by selecting it and clicking on 'Edit'.
When you click on 'OK' or 'Apply', a warning table is updated to match the current filters.
The 'Keyword Message Filtering' tab
The tab contains a keyword editor, warnings with which will be hidden in reports. Keywords from this list are checked only by the data in the 'Message' column.
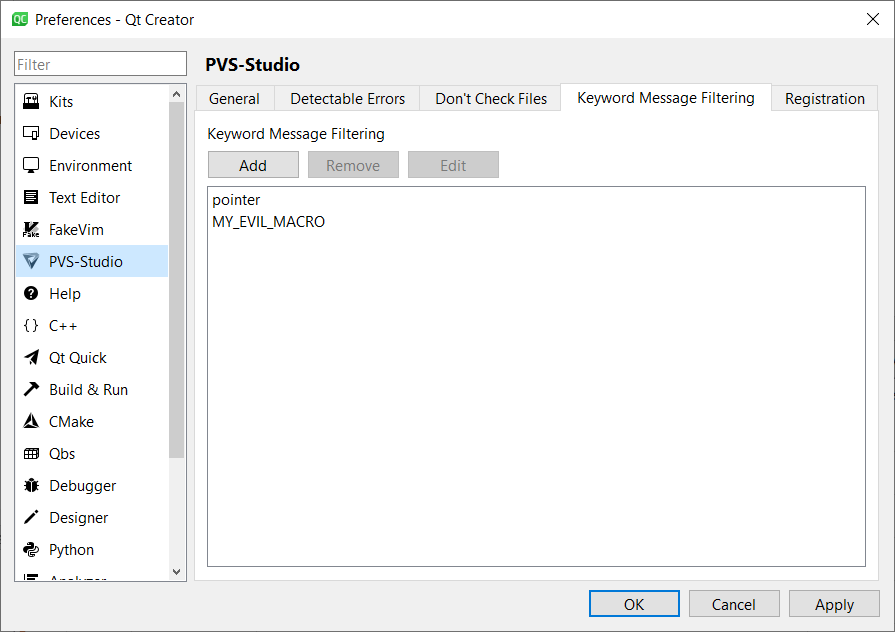
This feature can be helpful if you need to hide warnings from a specific function and class — just add them to the list.
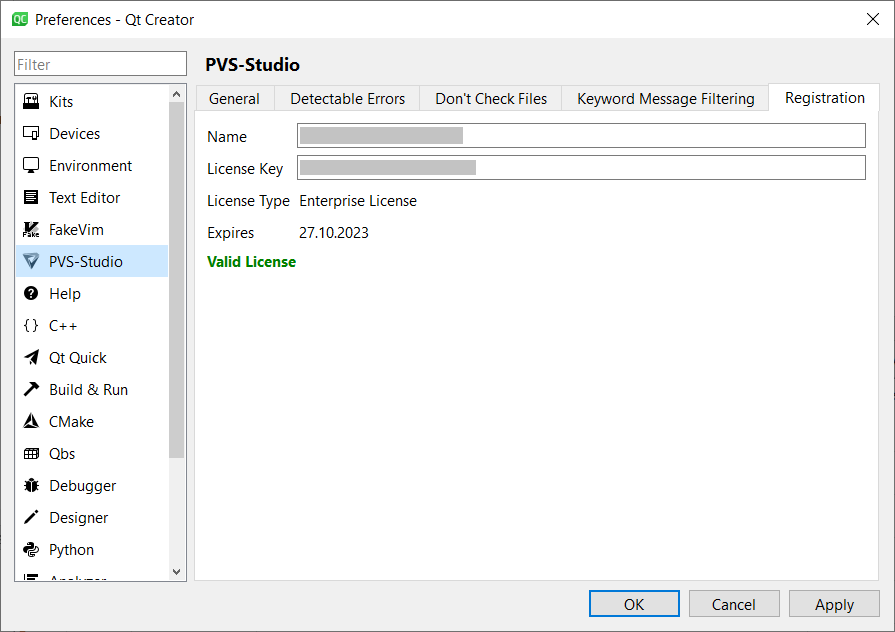
The 'Registration' tab
The tab contains a form for entering the license data, which will be used when running the analyzer. The registration process is described here.
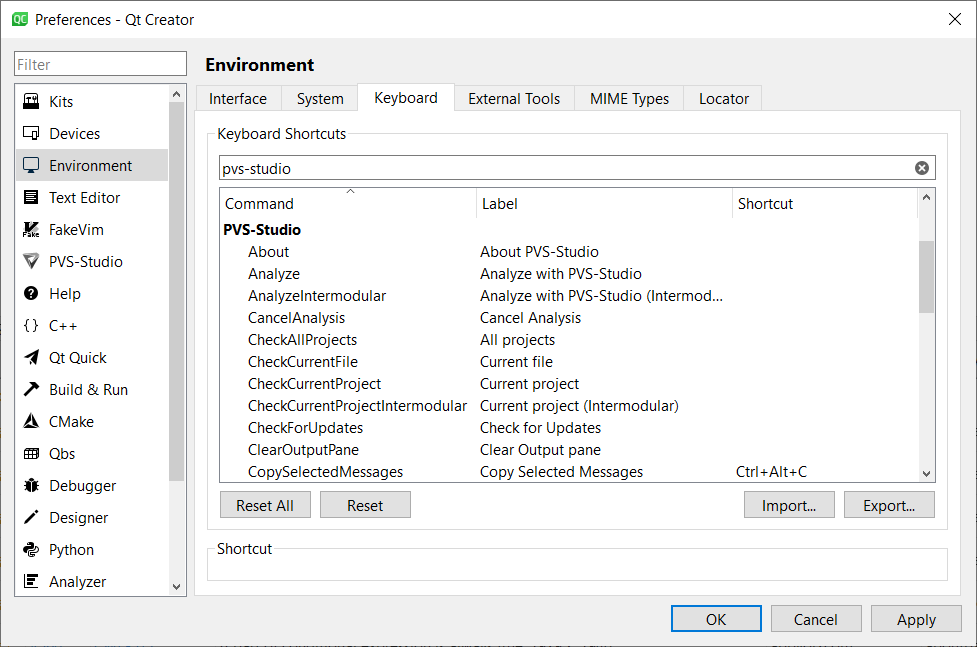
Shortcuts
Shortcuts speed up the processing of the analysis results. You can assign/change the shortcuts in the 'Options -> Environment -> Keyboard' settings. To find them faster, type 'PVS-Studio' into the 'Keyboard Shortcuts' window search field.
Was this page helpful?