
PVS-Studio: troubleshooting
- The basic PVS-Studio's operation principles you should know
- I can't check a file/project with the IDE PVS-Studio plugin
- Source files are preprocessed incorrectly when running analysis from the IDE plugin. Error V008
- IDE plugin crashes and generates the 'PVS-Studio internal error' message
- Unhandled IDE crash when utilizing PVS-Studio
- PVS-Studio.exe crash
- The V001/V003 errors
- The analyzer cannot locate errors in an incorrect code or generates too many false positives
- Issues with handling PVS-Studio analysis report from within the IDE plugin
- Code analysis running from the IDE plugin is slow. Not all the logical processors are being utilized
- I get the message "Files with C or C++ source code for analysis not found." when checking a group of projects or one C/C++ project
- Errors of the "Cannot open include file", "use the /MD switch for _AFXDLL builds" kinds on projects that could be successfully compiled in Visual Studio. Insertion of incorrect precompiled headers during preprocessing
- 'PVS-Studio is unable to continue due to IDE being busy' message under Windows 8. 'Library not registered' errors
- Cannot check a Unity project due to an error: The solution file has two projects named "UnityEngine.UI"
- Incorrect path to the imported file causes an emergency shutdown of PVS-Studio_Cmd.exe
- "GC overhead limit exceeded" occurs or analysis aborts by timeout
- Unable to start the analysis (V06X errors occur)
The basic PVS-Studio's operation principles you should know
PVS-Studio is composed of 2 basic components: the command-line analyzer (PVS-Studio.exe) and an IDE plugin through which the former is integrated into one of the supported development environments (Microsoft Visual Studio). The way command-line analyzer operates is quite similar to that of a compiler, that is, each file being analyzed is assigned to a separate analyzer instance that, in turn, is called with parameters which, in particular, include the original compilation arguments of the source file itself. Afterwards, the analyzer invokes a required preprocessor (also in accordance with the one that is used to compile the file being analyzed) and then analyzes the resulting temporary preprocessed file, i.e. the file in which all of the include and define directives were expanded.
Thus, the command-line analyzer - just like a compiler (for example Visual C++ cl.exe compiler) - is not designed to be used directly by the end user. To continue with the analogy, compilers in most cases are employed indirectly, through a special build system. Such a build system prepares launch parameters for each of the file to be built and also usually optimizes the building process by parallelizing it among all the available logic processors. The IDE PVS-Studio plugin operates in a similar fashion.
However, IDE plug-in is not the only method for the employment of PVS-Studio.exe command line analyzer. As mentioned above, the command-line analyzer is very similar to a compiler regarding its usage principles. Therefore, it can be directly integrated, if necessary, into a build system along with a compiler. This way of using the tool may be convenient when dealing with a build scenario which is not supported by PVS-Studio - for example, when utilizing a custom-made build system or an IDE other than Visual Studio. Note that PVS-Studio.exe supports analysis of source files intended to be compiled with gcc, clang, and cl compilers (including the support for specific keywords and constructs).
Besides IDE plugins, our distribution kit also includes a plugin for the Microsoft MSBuild build system which is utilized by Visual C++ projects in the Visual Studio IDE starting with version 2010. Don't confuse it with the plugin for the Visual Studio IDE itself!
Thus, you can analyze projects in Visual Studio (version 2010 or higher) in two different ways: either directly through our IDE plugin, or by integrating the analysis process into the build system (through the plugin for MSBuild). Of course, nothing prevents you, if the need arises, from creating your own static analysis plugin, be it for MSBuild or any other build system, or even integrating PVS-Studio.exe's call directly, if possible, into build scripts like in the case of makefile-based ones.
I can't check a file/project with the IDE PVS-Studio plugin
If PVS-Studio plug-in generates the message "C/C++ source code was not found" for your file, make sure that the file you are trying to analyze is included into the project for the build (PVS-Studio ignores files excluded from the build). If you get this message on the whole project, make sure that the type of your C/C++ project is supported by the analyzer. In Visual Studio, PVS-Studio supports only Visual C++ projects for versions 2005 and higher, as well as their corresponding MSBuild Platform Toolsets. Project extensions using other compilers (for example projects for the C++ compiler by Intel) or build parameters (Windows DDK drivers) are not supported. Despite the fact that the command-line analyzer PVS-Studio.exe in itself supports analysis of the source code intended for the gcc/clang compilers, IDE project extensions utilizing these compilers are not supported.
If your case is not covered by the ones described above, please contact our support service. If it is possible, please send us the temporary configuration files for the files you are having troubles with. You can get them by setting the option 'PVS-Studio -> Options -> Common Analyzer Settings -> Remove Intermediate Files' to 'False'. After that, the files with the name pattern %SourceFilename.cpp%.PVS-Studio.cfg will appear in the same directory where your project file (.vcxproj) is located. If possible, create an empty test project reproducing your issue and send it to us as well.
Source files are preprocessed incorrectly when running analysis from the IDE plugin. Error V008
If, having checked your file/project, PVS-Studio generates the V008 message and/or a preprocessor error message (by clang/cl preprocessors) in the results window, make sure that the file(s) you are trying to analyze can be compiled without errors. PVS-Studio requires compilable C/C++ source files to be able to operate properly, while linking errors do not matter.
The V008 error means that preprocessor returned a non-zero exit code after finishing its work. The V008 message is usually accompanied by a message generated by a preprocessor itself describing the reason for the error (for example, it failed to find an include file). Note that, for the purpose of optimization, our Visual Studio IDE plugin utilizes a special dual-preprocessing mode: it will first try to preprocess the file with the faster clang preprocessor and then, in case of a failure (clang doesn't support certain Visual C++ specific constructs), launches the standard cl.exe preprocessor. If you get clang's preprocessing errors, try setting the plugin to use only the cl.exe preprocessor (PVS-Studio -> Options -> Common Analyzer Settings -> Preprocessor).
Sometimes the analyzer issues V008 warnings when paths to source code files are very long. If you are using Windows, try to increase the maximum path length. To see how to do this, click here.
If you are sure that your files can be correctly built by the IDE/build system, perhaps the reason for the issue is that some compilation parameters are incorrectly passed into the PVS-Studio.exe analyzer. In this case, please contact our support service and send us the temporary configuration files for these files. You can get them by setting the option 'PVS-Studio -> Options -> Common Analyzer Settings -> Remove Intermediate Files' to 'False'. After that, files with the name pattern %SourceFilename.cpp%.PVS-Studio.cfg will appear in the same directory where your project file is located. If possible, create an empty test project reproducing your issue and send it to us as well.
IDE plugin crashes and generates the 'PVS-Studio internal error' message
If plugin crashes and generates the dialog box entitled 'PVS-Studio Internal Error', please contact our support service and send us the analyzer's crash stack (you can obtain it from the crash dialog box).
If the issue occurs regularly, then please send us the plugin's trace log together with the crash stack. You can obtain the trace log by enabling the tracing mode through the 'PVS-Studio -> Options -> Specific Analyzer Settings -> TraceMode (Verbose mode)' setting. The trace log will be saved into the default user directory Application Data\Roaming\PVS-Studio under the name PVSTracexxxx_yyy.log, where xxxx is PID of the process devenv.exe / bds.exe, while yyy is the log number for this process.
Unhandled IDE crash when utilizing PVS-Studio
If you encounter regular crashes of your IDE which are presumably caused by PVS-Studio's operation, please check the Windows system event logs (in the Event Viewer) and contact our support service to provide us with the crash signature and stack (if available) for the application devenv.exe \ bds.exe (the 'Error' message level) which can be found in the Windows Logs -> Application list.
PVS-Studio.exe crash
If you encounter regular unhandled crashes of the PVS-Studio.exe analyzer, please repeat the steps described in the section "IDE crashes when PVS-Studio is running", but for the PVS-Studio.exe process.
The V001/V003 errors
The error V003 actually means that PVS-Studio.exe has failed to check the file because of a handled internal exception. If you discover V003 error messages in the analyzer log, please send us an intermediate file (an i-file containing all the expanded include and define directives) generated by the preprocessor for the file that triggers the v003 error (you can find its name in the file field). You can get this file by setting the 'PVS-Studio -> Options -> Common Analyzer Settings -> Remove Intermediate Files' option to 'False'. Intermediate files with the name pattern SourceFileName.i will appear, after restarting the analysis, in the directory of the project that you are checking (i.e. in the same directory where the vcproj/vcxproj/cbproj files are located).
The analyzer may sometimes fail to perform a complete analysis of a source file. It is not always the analyzer's fault - see the documentation section on the V001 error to learn more about this issue. No matter what was the cause of a V001 message, it is usually not critical. Incomplete file parsing is insignificant from the analysis viewpoint. PVS-Studio simply skips a function/class with an error and continues with the analysis. It's only a very small portion of code which is left unchecked. If this portion contains fragments you consider relevant, you may send us an i-file for this source file as well.
The analyzer cannot locate errors in an incorrect code or generates too many false positives
If it seems to you that the analyzer fails to find errors in a code fragment that surely contains them or, on the contrary, generates false positives for a code fragment which you believe to be correct, please send us the preprocessor's temporary file. You can get it by setting the 'PVS-Studio -> Options -> Common Analyzer Settings -> Remove Intermediate Files' option to 'False'. Intermediate files with the name pattern SourceFileName.i will appear, after you restart the analysis, in the directory of the project you are checking (i.e. in the same directory where ycproj/vcxproj/cbproj files are located). Please attach the source file's code fragment that you have issues with as well.
We will consider adding a diagnostic rule for your sample or revise the current diagnostics to reduce the number of false positives in your code.
Issues with handling PVS-Studio analysis report from within the IDE plugin
If you encounter any issues when handling the analyzer-generated log file within the window of our IDE plugin, namely: navigation on the analyzed source files is performed incorrectly and/or these files are not available for navigation at all; false positive markers or comments are added in wrong places of your code, and the like - please contact our support service to provide us with the plugin's trace log. You can get it by enabling the tracing mode through the 'PVS-Studio -> Options -> Specific Analyzer Settings -> TraceMode' option (Verbose mode). The trace log will be saved into the default user directory Application Data\Roaming\PVS-Studio under the name PVSTracexxxx_yyy.log, where xxxx is PID of the devenv.exe / bds.exe process, while yyy is the log number for this process.
Also, if it is possible, create an empty test project reproducing your trouble and attach it to the letter too.
Code analysis running from the IDE plugin is slow. Not all the logical processors are being utilized
The PVS-Studio plugin can parallelize code analysis at the level of source files, that is, you can have analysis for any files you need to check (even within one project) running in parallel. The plugin by default sets the number of threads into which the analysis process is parallelized according to the number of processors in your system. You may change this number through the option PVS-Studio -> Options -> Common Analyzer Settings -> ThreadCount.
If it seems to you that not all of the available logical processors in your system are being utilized, you can increase the number of threads used for parallel analysis. But keep in mind that static analysis, unlike compilation, requires a large amount of memory: each analyzer instance needs about 1.5 Gbytes.
If your system, even though possessing a multi-core processor, doesn't meet these requirements, you may encounter a sharp performance degradation caused by the analyzer having to rely on a swap file. In this case, we recommend you to reduce the number of parallel threads of the analyzer to meet the requirement of 1.5 Gbytes per thread, even if this number is smaller than the number of processor cores in your system.
Keep in mind that when you have many concurrent threads, your HDD, which stores temporary preprocessed *.i files, may become a bottleneck itself, as these files may grow in size quite quickly. One of the methods to significantly reduce the analysis time is to utilize SSD disks or a RAID array.
A performance loss may also be caused by poorly configured antivirus software. Because the PVS-Studio plugin launches quite a large number of analyzer and the cmd.exe instances, your antivirus may find this behavior suspicious. To optimize the analysis time, we recommend you to add PVS-Studio.exe, as well as all of the related directories, to the exceptions list of your antivirus or disable real-time protection while the analysis is running.
If you happen to utilize the Security Essentials antivirus (which has become a part of Windows Defender starting with Windows 8), you may face a sharp performance degradation on certain projects/configurations. Please refer to this article on our blog for details concerning this issue.
I get the message "Files with C or C++ source code for analysis not found." when checking a group of projects or one C/C++ project
Projects excluded from the general build in the Configuration Manager window of the Visual Studio environment are not analyzed.
For the PVS-Studio analyzer to analyze C/C++ projects correctly, they must be compilable in Visual C++ and buildable without errors. That's why when checking a group of projects or an individual project, PVS-Studio will check only those projects which are included into the general build.
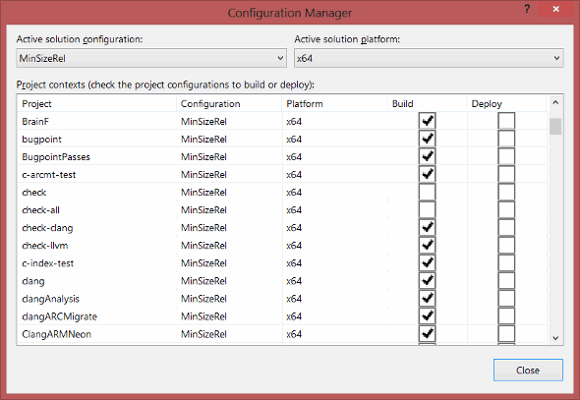
Projects excluded from the build won't be analyzed. If none of the projects is included into the build or you try to analyze one project that was not included into the build, the message "Files with C or C++ source code for analysis not found" will be generated, and analysis won't start. Use the Configuration Manager for the current Visual Studio solution to see which projects are included and which are excluded from the general build.
Errors of the "Cannot open include file", "use the /MD switch for _AFXDLL builds" kinds on projects that could be successfully compiled in Visual Studio. Insertion of incorrect precompiled headers during preprocessing
If you are encountering errors with missing includes, incorrect compiler switches (for example, the /MD switch) or macros while running static analysis on a project which can be compiled in Visual Studio IDE without such errors, then it is possible that this behavior is a manifestation of an incorrect precompiled header files being inserted during the preprocessing.
This issue arises because of the divergent behavior of Visual C++ compiler (cl.exe) in its' compiler and preprocessor modes. During a normal build, the compiler operates in the "regular" mode (i.e. the compilation results in the object, binary files). However, to perform static analysis, PVS-Studio invokes the compiler in the preprocessor mode. In this mode the compiler performs the expansion of macros and include directives.
But, when the compiled file utilizes a precompiled header, the compiler will use a header itself when it encounters the #include directive. It will use the previously generated pch file instead. However, in the preprocessing mode, the compiler will ignore the precompiled pch entirely and will try expanding such #include in a "regular way", i.e. by inserting the contents of the header file in question.
It is a common practice to use precompiled headers with the same name in multiple projects (the most common one being stdafx.h). This, because of the disparities in the compiler behavior described earlier, often leads to the header from an incorrect project being included into the source file. There are several reasons why this can happen. For example, a correct pch is specified for a file, but the Includes contain several paths containing several different stdafx.h files, and the incorrect one possesses a higher priority for being included (that is, its' include path occurs earlier on the compiler's command line). Another possible scenario is the one in which several projects include the same C++ source file. This file could be built with different options in different projects, and it uses the different pch files as well. But since this is just a single file in your file system, one of the stdafx.h files from one of the projects it is included into could be located in the same directory as the source file itself. And if the stdafx.h is included into this source file by the #include directive using the quotes, then the preprocessor will always use the header file from the same directory as this file, regardless of the includes passed through the command line.
Insertion of the incorrect precompiled header file will not always lead to the preprocessing errors. However, if one of the projects, for example, utilized MFC, and the other one is not, ore the projects possess a different set of Includes, the precompiled headers will be incompatible, and one of the preprocessing errors described in the title of this section will occur. As a result, you will not be able to perform static analysis on such a file.
Unfortunately, it is impossible to bypass this issue on the analyzer's side, as it concerns the external preprocessor, that is, the cl.exe. If you are encountering it on one of your projects, then it is possible to solve it by one of the methods described below, depending on the causes that lead to it.
In case the precompiled header was incorrectly inserted because of the position of its' include path on the compiler's command line, you can simply move a path for the correct header file to the first position on the command line.
If the incorrect header file was inserted because of its' location in the same directory as the source file into which it is included, then you can use the #include directive with pointy brackets, for example:
#include <stdafx.h>While using this form, the compiler will ignore the files form the current directory when it performs the insertion.
'PVS-Studio is unable to continue due to IDE being busy' message under Windows 8. 'Library not registered' errors
When checking large (more than 1000 source files) projects with PVS-Studio under Windows 8, while using Visual Studio 2010 or newer versions, sometimes the errors of the 'Library not registered' kind can appear or analyzer can even halt the analysis process altogether with 'PVS-Studio is unable to continue due to IDE being busy' message.
Such errors can be caused by several factors: incorrect installation of Visual Studio and compatibility conflicts between different versions of IDE present within a system. Even if your system currently possesses a single IDE installation, but a different version was present in the past, it is possible that this previous version was uninstalled incorrectly or incompletely. In particular, the compatibility conflict can arise from simultaneously having installations of one of Visual Studio 2010\2012\2013\2015\2017\2019\2022 and Visual Studio 2005 and\or 2008 on your system.
Unfortunately, PVS-Studio is unable to 'work around' these issues by itself, as they are caused by conflicts in COM interfaces, which are utilized by Visual Studio API. If you are one of such issues, then you have several different ways of dealing with it. Using PVS-Studio under a system with a 'clean' Visual Studio installation should resolve the issue. However, if it not an option, you can try analyzing your project in several go's, part by part. It is also worth noting that the issue at hand most often arises in the situation when PVS-Studio performs analysis simultaneously with some other IDE background operation (for example, when IntelliSense performs #include parsing). If you wait for this background operation to finish, then it will possibly allow you to analyze your whole project.
Another option is to use alternative methods of running the analyzer to check your files. You can check any project by using the compiler monitoring mode from C and C++ Compiler Monitoring UI (Standalone.exe).
After installing Visual Studio IDE on a machine with a previously installed PVS-Studio analyzer, the newly installed Visual Studio version lacks the 'PVS-Studio' menu item
Unfortunately, the specifics of Visual Studio extensibility implementation prevents PVS-Studio from automatically 'picking up' newly installed Visual Studio in case it happened after the installation of PVS-Studio itself.
Here is an example of such a situation. Let's assume that before the installation of PVS-Studio, the machine have only Visual Studio 2013 installed on it. After installing the analyzer, Visual Studio 2013 menu will contain the 'PVS-Studio' item (if the corresponding option was selected during the installation), which allows you to check your projects in this IDE. Now, if Visual Studio 2015 is installed on this machine next (after PVS-Studio was already installed), the menu of this IDE version will not contain 'PVS-Studio' item.
In order to add analyzer IDE integration to the newly installed Visual Studio, it is necessary to re-launch PVS-Studio installer (PVS-Studio_Setup.exe file). If you do not have this file already, you can download it from our site. The checkbox besides the required IDE version on the Visual Studio selection installer page will be enabled after the corresponding Visual Studio version is installed.
Cannot check a Unity project due to an error: The solution file has two projects named "UnityEngine.UI"
For details on what caused the problem and how to fix it, see this article.
Incorrect path to the imported file causes an emergency shutdown of PVS-Studio_Cmd.exe
Sometimes PVS-Studio can incorrectly calculate the Visual Studio version needed for the analysis. This can lead to the analyzer's emergency shutdown with various errors.
Here's an example:
Can't reevaluate project MyProj.vcxproj with parameters: Project ToolsVersion 'Current'; PlatformToolset 'v142'. Previous evaluation error: 'The imported project "C:\Program Files (x86)\Microsoft Visual Studio\2019\Community\MSBuild\Microsoft\VC\v170\Microsoft.Cpp.Default.props" was not found.
As you can see from the message, PVS-Studio incorrectly formed the path to Microsoft.Cpp.Default.props. An incorrect fragment is in bold. v170 is used for Visual Studio 2022. Here we need Visual Studio 2019, and the correct fragment would be v160.
This problem may appear for a variety of reasons. Here's some of them:
- incorrect value of the VisualStudioVersion environment variable;
- some Visual Studio files left when it was incorrectly deleted;
- the project is not built by the required Visual Studio version.
Setting the correct value of the VisualStudioVersion environment variable can help with solving problems. For example, Visual Studio 2019 corresponds to 16.0, and Visual Studio 2022 – 17.0.
If you use the plugin for Visual Studio, the error is unlikely to occur. When you run the analysis from the IDE, the desired value is written to VisualStudioVersion automatically.
"GC overhead limit exceeded" occurs or analysis aborts by timeout
The insufficient memory problem can be solved by increasing the available amount of memory and stack.
Plugin for Maven:
<jvmArguments>-Xmx4096m, -Xss256m</jvmArguments>
Plugin for Gradle:
jvmArguments = ["-Xmx4096m", "-Xss256m"]
Plugin for IntelliJ IDEA:
1) Tools -> PVS-Studio -> Settings
2) Environment tab -> JVM arguments
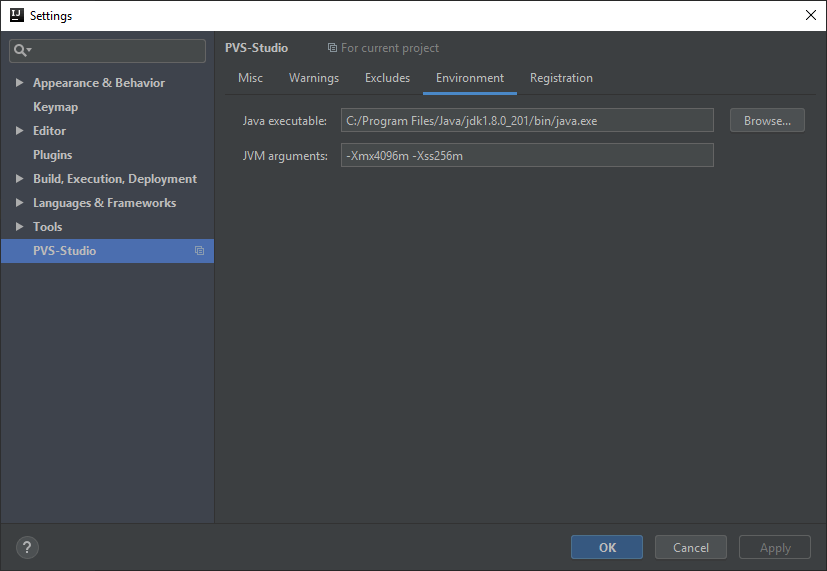
Typically, the default amount of memory may be insufficient when analyzing some generated code with a large number of nested constructs.
It's probably better to exclude that code from analysis (using exclude), to speed it up.
Unable to start the analysis (V06X errors occur)
If you are unable to run the analysis, please contact our support and attach *.json files from the .PVS-Studio directory (located in the project directory).
Was this page helpful?