
Analysis in commit and branch merge mode (pull/merge requests). Analysis of modified files.
- General principles of pull/merge request analysis
- Analysis integration into VCS
- File list checking mode
- Modified file analysis mode
Pull/merge request check and analysis of modified files is available only in the Enterprise license. You can request a trial Enterprise license here.
The commit and the branch pull/merge analysis mode allow you to analyze only those files that have changed relative to the current state of the branch (the one the commit or pull/merge request is made to). This reduces the analysis time and simplifies the review of its results: the analyzer's report contains warnings issued for errors in the modified files.
This document describes the general principles of the pull/merge request analysis. You can find examples for specific CIs in the following documentation sections:
General principles of pull/merge request analysis
To analyze files that were changed during the branch merge, the files must be separated from all other files in the project. To do this, after the merge is done, you need to get the difference between the HEAD branch from where the pull/merge request is made and the branch where the changes will be made.
Look at the commit tree:
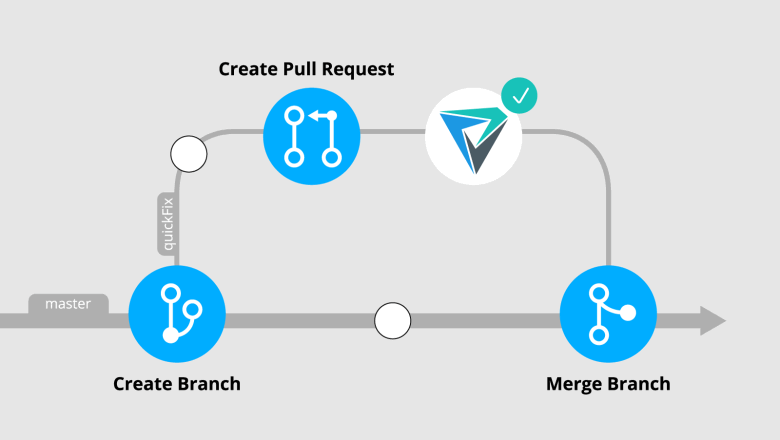
In this case, a quickFix branch was created. After work is completed in the branch, a pull/merge request opens. Use the following command to get the difference between the current state of the master branch and the last commit in the quickFix branch (you have to be on the quickFix branch at the time it is executed):
git diff --name-only HEAD master > .pvs-pr.listThis way you get a list of modified files relative to the latest commits in the master and quickFix branches. The names of the modified files will be saved in .pvs-pr.list.
Note. In the example of getting the files for analysis, we use the git version control system. However, you can use any version control system that allows you to get a list of modified files.
To check the sent pull/merge request, you need to analyze the received file list.
Getting list of modified files
In this section, you can find examples of commands for getting a list of modified files.
For Git:
To get a list of modified files before a commit, execute the command:
git diff --cached --name-only > .pvs-pr.listTo get a list of modified files between two commits, execute the command:
git diff --name-only CommitA CommitB > .pvs-pr.listFor SVN:
On Windows, you can execute the following command in PowerShell:
Write-Host (svn status | Select-String -Pattern `^[AM]\W*(.*)`
| %{$_.Matches.Groups[1].value})  -Separator "`b`n" > .pvs-pr.lits
On Linux:
svn status -q | grep -oP "^[M|A]\W*\K(.*)" > .pvs-pr.listFor Mercurial:
hg log --template "{files % `{file}\n`}\n" > .pvs-pr.listFor Perforce:
p4 diff -f -sa > .pvs-pr.listAnalysis integration into VCS
Most version control systems (VCSs) support tracking events in a repository using special hooks. Usually, hooks are regular script files that the VCS runs. They can be used both on the client side (local developer machine) and on the VCS server (if you have your own VCS server). Using hooks on the VCS server enables you to configure a global policy for all developers in the company.
Each version control system has its own scenarios for using hooks. To learn more, please consult the documentation for your VCS.
You can integrate PVS-Studio directly into the VCS server. Follow the plan.
- Define the event that triggers the analysis. The hook should be executed before the VCS commits the new changes. For example, it can be the commit or push operations.
- Decide where you would like to run the analysis. You can run it on a VCS server or on a separate machine. Remember: for successful analysis, your project should be built on the machine on which the analysis is performed.
- Write the hook that will:
- Get a list of changes in a commit or a push. You will need not only a list of modified files but also a patch file that contains the changes (for example, it is required for Git).
- If you would like to run the analysis on a VCS server, you will need to have a local copy of your repository there. Apply a patch file to this copy and run the analysis in the mode of checking the list of files.
- If you plan to run the analysis on a separate machine, send the changes to the remote machine using a special command (for example, via ssh), apply a patch file there, and run the analysis in the mode of checking the list of files.
- Next, process the analysis results. To reject the operation if there are analyzer messages, exit the hook with the non-zero code. You can do it using the PlogConverter utility, which converts analyzer reports. The
-wflag indicates that the utility should be closed with the exit code of 2 if there are any warnings in the filtered report.
Keep in mind that executing the hooks is usually a blocking operation. It means that until the hook is executed, the commit or push operations will not close. Hence, using hooks can slow down the process of pushing changes to the repository.
Note. This scenario is quite difficult to implement, and we strongly recommend you use the VCS hooks only to create CI system triggers.
File list checking mode
To enable file list checking mode in PVS-Studio_Cmd and pvs-studio-dotnet, use the --sourceFiles (-f), and to enable this mode in the Java analyzer, use the utility pvs-studio.jar with the --analyze-only-list flag.
To check the list of files, pass a text file that contains absolute or relative paths to the files for analysis to the analyzer (relative paths will be expanded according to the working directory). Write each of the paths on a new line. Text that is not the path to the source-code file is ignored (this may be useful for commenting).
Example of the contents of a file with paths:
D:\MyProj\Tests.cs
D:\MyProj\Common.cpp
D:\MyProj\Form.h
For C, C++, and C# analyzers, there is an alternative mode: modified file analysis mode.
Below are the options to run the analysis for different languages and operating systems.
Analyzing C# files
To check C# files, use the PVS-Studio_Cmd utility for Windows and pvs-studio-dotnet for Linux and macOS.
The path to the file that contains the list of files for analysis is passed using the -f argument (detailed information about the arguments see in the documentation). The format of this file is described in the File list checking mode section.
You can check the return code to see if there are any analyzer warnings. The return codes are described in the documentation.
Windows
Example of a command to run the analysis:
PVS-Studio_Cmd.exe -t MyProject.sln ^
                   -f .pvs-pr.list ^
                   -o Analysis_Report.json
Files from .pvs-pr.list contained in the MyProject.sln solution will be analyzed. The analysis results will be saved to the Analysis_Report.json file.
Linux and macOS
Example of a command to run the analysis:
pvs-studio-dotnet -t MyProject.sln \
                  -f .pvs-pr.list \
                  -o Analysis_Report.json
Files from .pvs-pr.list contained in the MyProject.sln solution will be analyzed. The analysis results will be saved to the Analysis_Report.json file.
Analyzing C and C++ files
To check C and C++ files, use the following utilities:
- pvs-studio-analyzer / CompilerCommandsAnalyzer (Windows, Linux and macOS);
- CLMonitor (Windows);
- PVS-Studio_Cmd (Windows).
The check method for each utility is described below.
The first launch of the analysis generates a dependency cache file of all the project's source files from the header files. The analyzer will update it automatically on subsequent runs. It is possible to create/update the dependency file without running the analysis. This process will be described for each of the utilities in the corresponding section.
Compilation dependency cache for C and C++ projects
This section describes in detail how cache files of compilation dependencies work in the PVS-Studio_Cmd.exe and pvs-studio-analyzer/CompilerCommandsAnalyzer.exe console utilities.
The utilities have special flags:
- A flag for analyzing the list of files. Specifies the path to a file that contains a line-by-line list of the paths to source files you wish to analyze:
- PVS-Studio_Cmd.exe:
--sourceFiles(-f); - pvs-studio-analyzer/CompilerCommandsAnalyzer.exe:
--source-files(-S).
- PVS-Studio_Cmd.exe:
- A flag for assigning a different cache file location. The path from where the dependency cache file should be used or where it should be generated is passed to this flag. Without using this flag, the cache is generated in the project directory.
- PVS-Studio_Cmd.exe:
--dependencyRoot(-D).
- PVS-Studio_Cmd.exe:
- A flag for regenerating dependency caches of C and C++ projects with running the analysis. Regenerates dependency cache files for all files in the project(s) and runs the analysis of all files from the project(s) or from the file list passed via the flag:
- PVS-Studio_Cmd.exe:
--regenerateDependencyCache(-G); - pvs-studio-analyzer/CompilerCommandsAnalyzer.exe:
--regenerate-depend-info.
- PVS-Studio_Cmd.exe:
- A flag for regenerating dependency caches of C and C++ projects without running the analysis. Regenerates dependency cache files of the project(s) without running the analysis:
- PVS-Studio_Cmd.exe:
--regenerateDependencyCacheWithoutAnalysis(-W); - pvs-studio-analyzer/CompilerCommandsAnalyzer.exe:
--regenerate-depend-info-without-analysis.
- PVS-Studio_Cmd.exe:
When you run the analysis for the first time using the file list analysis flag, the analyzer preprocesses all C and C++ files from projects passed for the analysis. The dependency information is stored in a separate dependency cache file for each project.
The next time you run the analyzer with the file list analysis flag, the information is added to/updated in the dependency cache for:
- files specified in the list from the flag that contains the list of files to be analyzed;
- files that do not yet have an entry in the dependency cache file. For example, new files added to the project;
- files that previously depended on the files specified in the list from the analysis flag of the file list. Dependency information is taken from the dependency cache file that has been created/updated during the last analysis with the file list analysis flag.
After the dependency information is updated, all files specified in the list of files to be analyzed and the files that depend on them are analyzed (the dependency information obtained in the previous step is used).
Each time before running the analysis, the compilation dependency cache is updated for all files passed for the analysis. The cache is also updated for files whose dependencies contain the files that are passed from the list of files to be analyzed. If there are changes in the file dependencies that are related to cached dependencies, these changes are considered in the current analysis, and the cache is updated for future analyses.
To keep the dependency cache up to date, run the analysis with the file list analysis flag each time you make changes to the source files. You can also do this for all changed files from multiple commits at once.
Skipping the analysis of changes to source files or separately running the analysis of modified files in an order other than their change order may result in some files not being analyzed due to changes in the project dependency structure. For example, if a dependency on an .h file has been added to a .cpp file, that .cpp file should be added to the list of files to be checked to update the dependency cache. Otherwise, when a newly added .h file gets into the list of files to be analyzed, the analyzer cannot find the translation unit for which the preprocessing should be performed.
If you cannot guarantee that all changing project files will be passed in the file list analysis mode, we recommend using the file list analysis mode with the dependency cache regeneration mode with running the analysis. In this case, the analyzer operation time is slightly increased (to regenerate the cache all project translation units should be preprocessed). However, it is still much less than the time needed to perform the full analysis (as all project source files are preprocessed without the analysis). The cache relevance is guaranteed every time the analysis is run, regardless of any missing changed files or the order of files passed for the analysis.
pvs-studio-analyzer / CompilerCommandsAnalyzer.exe (Windows, Linux and macOS)
Note. The way to analyze project files that use the MSBuild system is described in the PVS-Studio_Cmd (Windows, Visual Studio\MSBuild) section.
Depending on the operating system on which the analysis is performed, the utility will have different names:
- Windows:
CompilerCommandsAnalyzer.exe; - Linux and macOS:
pvs-studio-analyzer.
The examples in this documentation use the pvs-studio-analyzer name. The scenario to analyze files with CompilerCommandsAnalyzer.exe is similar to that described here.
To use pvs-studio-analyzer, generate either the compile_commands.json file, or a file with the results of the compilation trace (relevant only for Linux). The analyzer needs these files to have information about the compilation of specific files.
Generating compile_commands.json
See the documentation for ways to generate the compile_commands.json file.
Generating a trace file (Linux only)
See the documentation for ways to generate the trace file. By default, the result of tracing is written to the strace_out file.
There are two options for analysis using a trace file. You can either perform a full tracing of the entire projects build at each start, or you can cache the result of the tracing and use it.
The downside of the first method is that a full tracing contradicts the idea of a quick check of commits or pull/merge requests.
The second way is bad because the analysis result may be incomplete if the dependency structure of source files changes after the tracing (for example, a new #include will be added to one of the source files).
For this reason, we do not recommend the use of the file list checking with the trace log for commit or pull/merge request checking. In case you are able to do an incremental build during the commit checking, consider using the incremental analysis mode.
Example of commands to analyze files and to update dependencies
Let's look at an example of using pvs-studio-analyzer. The path to the file that contains the list of files for analysis is passed using the -S argument (detailed information about the utility arguments see in the documentation). The format of this file is described in the File list checking mode section.
Note. If the compilation information was obtained using the compilation trace mode, the trace file is passed using the -f flag (by default, its name is strace_out).
Example of a command to analyze files:
pvs-studio-analyzer analyze -S .pvs-pr.list \
                            -f compile_commands.json \
                            -o Analysis_Report.json
This command generates a report with the result of checking the files contained in .pvs-pr.list. The analysis results will be saved to the Analysis_Report.json file.
To generate or update a dependency file without starting the analysis, use the --regenerate-depend-info-without-analysis flag. Do not use the -S flag with this flag. The update command looks as follows:
pvs-studio-analyzer analyze -S .pvs-pr.list \
                            –-regenerate-depend-info-without-analysis
Use the --regenerate-depend-info flag to force an update of the dependency cache. The analysis starts as soon as the cache is updated. You can use it with the -S flag. In this case, the dependency cache is updated for all files in the project. However, only the following files are analyzed:
- files passed for the analysis (the
-Sflag specifies the path to a file that contains a line-by-line list of the paths to source files you wish to analyze); - files that depend on files passed for the analysis (the dependency information is updated and then used to determine file dependencies).
The command to update the dependency cache for the whole project and analyze the passed files looks like this:
pvs-studio-analyzer analyze -S .pvs-pr.list \
                            -f compile_commands.json \
                            -o Analysis_Report.json \
                            –-regenerate-depend-info
By default, the dependency cache file is generated in the .PVS-Studio folder, which is created in the working directory. The cache is contained in the depend_info.json file.
Getting information about the presence/absence of warnings in the analyzer report
The return code of console utilities shows whether there are any warnings in the analyzer report or not:
- Windows:
PlogConverter.exe; - Linux and macOS:
plog-converter.
Here is documentation on these utilities.
Example of using PlogConverter.exe:
PlogConverter.exe Analysis_Report.json ^
                  -t html ^
                  -n PVS-Studio ^
                  --indicateWarnings
Example of using plog-converter:
plog-converter Analysis_Report.json \
               -t html \
               -n PVS-Studio \
               --indicate-warnings
The path to the file with the analysis results is passed as the first command line argument. Use the -t argument to specify the format in which the report should be saved. The -n argument specifies the file name of the converted report. --indicateWarnings for PlogConverter.exe and --indicate-warnings for plog-converter flags allow you to set the return code 2 if there are analyzer warnings in the report.
CLMonitor (Windows)
The path to the file that contains the list of files for analysis is passed using the -f argument (detailed information about the arguments see in the documentation). The format of this file is described in the File list checking mode section.
Example of a command to run the analysis:
CLMonitor.exe analyze -l "Analysis_Report.json" ^
                      -f ".pvs-pr.list"
This command will generate a report with the result of checking the files contained in .pvs-pr.list. The analysis results will be saved to the Analysis_Report.json file.
The return code of the PlogConverter.exe console utility shows whether there are any warnings in the analyzer report or not. If there are no analyzer warnings, the return code is 0. If there are warnings, the return code is 2. Here is documentation on these utilities.
Example of using PlogConverter.exe:
PlogConverter.exe Analysis_Report.json \
                  -t html \
                  -n PVS-Studio \
                  --indicate-warnings
The path to the file with the analysis results is passed as the first command line argument. Use the -t argument to specify the format in which the report should be saved. The -n argument specifies the file name of the converted report. --indicateWarnings for PlogConverter.exe flag allow you to set the return code 2 if there are analyzer warnings in the report.
PVS-Studio_Cmd (Windows, Visual Studio\MSBuild)
If the needed files with code are included in a Visual Studio project that uses the MSBuild system, the analysis is performed with the PVS-Studio_Cmd utility.
The path to the file that contains the list of files for analysis is passed using the -f argument (detailed information about the arguments see in the documentation). The format of this file is described in the section File list checking mode.
You can check the return code to see if there are any analyzer warnings. The return codes are described in the documentation.
Example of a command to run the analysis:
PVS-Studio_Cmd.exe -t MyProject.sln ^
                   -f .pvs-pr.list ^
                   -o Analysis_Report.json
Files from the .pvs-pr.list contained in the MyProject.sln solution will be analyzed. The analysis results will be saved to the Analysis_Report.json file.
To update dependencies without running the analysis, use the -W flag. You cannot use it with the -f flag:
PVS-Studio_Cmd.exe -t MyProject.sln ^
                   -W
Use the -G flag to force an update of the dependency cache. The analysis starts as soon as the cache is updated. You can use it with the -f flag. In this case, the dependency cache is updated for all files in the project. However, only the following files are analyzed:
- files passed for the analysis (the
-fflag specifies the path to a file that contains a line-by-line list of the paths to source files you wish to analyze.); - files that depend on files passed for the analysis (the dependency information is updated and then used to determine file dependencies.).
The command to update the dependency cache for the whole project and analyze the passed files looks like this:
PVS-Studio_Cmd.exe -t MyProject.sln ^
                   -f .pvs-pr.list ^
                   -G
By default, the dependency cache file is generated at the project level and saved to the .pvs-studio folder. The file containing the cache has a name of the projectName.vcxproj.deps.json form (the part of the file name, in our case it is projectName.vcxproj, corresponds to the project name). Accordingly, if you analyze the files belonging to the same solution but to different projects, the .pvs-studio folder with the dependency file will be created in the directory of each project.
You can change the directory where the cache is saved. To do this, use the -D parameter. The path to the directory where you want to save the cache is passed as the parameters value.
To set relative paths in dependency caches, use the -R flag. You need to pass the path as an argument to the flag. According to this path, the paths in the dependency cache files will be expanded.
Getting information about the presence/absence of warnings in the analyzer report
The return code of the PVS-Studio_Cmd.exe console utility shows whether there are any warnings in the analyzer report or not. The 256 return code means that the report contains analyzer warnings.
You can also use the PlogConverter.exe (Windows) or plog-converter (Linux/macOS) console utilities with the --indicateWarnings flag. If the analyzer report contains warnings, the return code is 2 when these flags are used.
Here is an example of using PlogConverter.exe:
PlogConverter.exe Analysis_Report.json ^
                  -t html ^
                  -n PVS-Studio ^
                  --indicateWarnings
Here is an example of using plog-converter:
plog-converter Analysis_Report.json \
               -t html \
               -n PVS-Studio \
               --indicate-warnings
Analyzing Java files
To check Java files, use the pvs-studio.jar utility. You can find the detailed information about the utility and its arguments in the documentation.
Windows, Linux, and macOS
The path to the file that contains the list of files to be analyzed is passed using the --analyze-only-list flag. The format of this file is described in the File list checking mode section.
To analyze the list of files, you also need to pass the path to the project containing these files. To do this, use the -s argument. The -e argument defines the classpath. If you need to use multiple classpath entities, separate them by a space.
Example of a command to run the analysis:
java -jar pvs-studio.jar -s projectDir ^
                         --analyze-only-list .pvs-pr.list ^
                         -e Lib1.jar Lib2.jar ^
                         -j4 ^
                         -o report.json ^
                         -O json ^
                         --user-name userName ^
                         --license-key key
As a result, the files recorded in the .pvs-pr.list will be analyzed. The analysis results will be saved to the report.json file.
To get information about the presence of warnings, use the --fail-on-warnings flag. When it is used, the analyzer returns code 53 if there are warnings in the analysis results.
Modified file analysis mode
The modified file analysis mode is an alternative to the file list checking mode. Using the mode, you can analyze only the files that have been modified relative to the saved state of the project directory. The analyzer gets information about file modifications and saves it to the compilation dependency cache. The dependency cache is a list of project source code files and their dependencies. In the modified file analysis mode, the hash of each source file in the cache is calculated. On the next analysis run, the hash in the dependency cache is compared to the actual hash value of the file. If the hashes differ, the file is analyzed.
Currently, you can analyze modified files in MSBuild C, C++, and C# projects on Windows using the PVS-Studio_Cmd utility and in C# projects on Linux/macOS using the pvs-studio-dotnet utility.
You can enable the modified file analysis mode using the --analyseModifiedFiles (-F) flag.
Here is an example of a command to start the analysis mode:
PVS-Studio_Cmd.exe -t MyProject.sln -F ^
                   -D path\to\depCacheDir ^
                   -R depCacheRoot ^
                   -o analysis_report.json
The command results in the analysis of the modified and newly added files that are stored in the MyProject.sln solution. The command uses dependency cache files located at the path specified in the -D flag to get information about changes. The paths in the cache files are written relative to the path specified in the -R flag. The analysis results are stored in the analysis_report.json file.
You can use the //V_SOLUTION_DIR_AS_DEPENDENCY_CACHE_SOURCE_TREE_ROOT flag in the *.pvsconfig file to use the path to the solution directory (the directory containing the *.sln file) as the root part of the path that is used to create relative file paths in the compilation dependency cache.
You can also use the //V_DEPENDENCY_CACHE_SOURCE_ROOT to specify the root directory to create relative paths.
To specify the directory where compilation dependency cache files will be saved, use the //V_DEPENDENCY_CACHE_ROOT flag. If this setting is not specified, the dependency cache will be saved in the .pvs-studio folder in the project file directory.
If the compilation dependency cache file does not exist, it will be created, initiating the analysis of all source files in the project. To avoid that, run your first analysis in the dependency cache file generation mode to calculate hashes for the source code files (the -H flag) without starting the analysis (the -W flag). To do this, use the following command:
PVS-Studio_Cmd.exe -t MyProject.sln -W -H ^
                   -D path\to\depCacheDir ^
                   -R depCacheRoot
This generates the dependency cache files but does not start the analysis. The next run of modified file analysis (the -F flag) will check only newly added or modified source code files from projects.
Use the following algorithm to check a commit or merge request:
- run the compilation cache generation for the source branch;
- get and apply changes from the commit/merge request;
- run modified file analysis.
To track modified files and save warnings, which remained unhandled after analysis, in the report, use the //V_DEPENDENCY_CACHE_TRACKING_MODE flag in the ModifiedAndWarningsContainingFiles mode. This flag enables you to analyze both files modified since the previous analysis run and files that still contain warnings from the previous run. To analyze only modified files, set the flag to ModifiedFilesOnly.
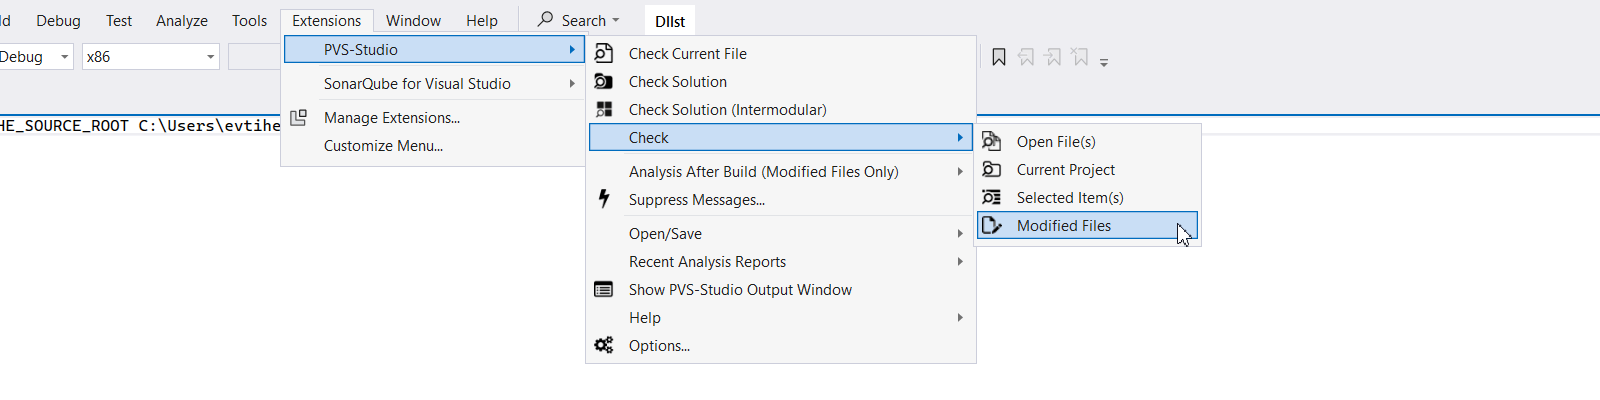
To check only modified files in the plugin for Visual Studio, use the //V_DEPENDENCY_CACHE_TRACKING_MODE flag in .pvsconfig or enable the DependencyCacheTrackingMode setting in one of the cache tracking modes. After that, you can run this analysis in the plugin via either Extension > PVS-Studio > Check > Modified Files in the plugin menu or the Analyze Modified Files with PVS-Studio item in the context menu of solutions and projects.
If //V_DEPENDENCY_CACHE_TRACKING_MODE is enabled, the compilation dependency cache will be updated with each analysis run, ensuring that modifications to source files and existing warnings are properly tracked.
Was this page helpful?