Integration of PVS-Studio analysis results into CodeChecker
CodeChecker is a static analysis infrastructure on Linux and macOS. It enables you to seamlessly view and handle PVS-Studio analysis results.
How to install CodeChecker
To run CodeChecker, create the Python virtual environment (versions >= 3.8) and install the tool using the pip package manager:
python3 -m venv .venv
source ./.venv/bin/activate
pip3 install codechecker
Note. Integration of PVS-Studio analysis results is available from CodeChecker 6.25.0 version.
To display the severity of the PVS-Studio diagnostic rules correctly, download the CodeChecker.json file and add it to the Python virtual environment at the .venv/share/codechecker/config/labels/analyzers path with the pvs-studio.json name.
To start the CodeChecker web server, run the following command:
CodeChecker serverThe default CodeChecker web server address is http://localhost:8001.
Read more about other ways to install and deploy CodeChecker in the checker documentation.
How to convert report to CodeChecker format
To handle a PVS-Studio report in CodeChecker, convert it to the required format. You can use report-converter, a built-in CodeChecker tool.
Note that report-converter can convert only the PVS-Studio JSON report. To convert PVS-Studio report of another format to JSON or filter warnings, use PlogConverter.exe for Windows and plog-converter for Linux/macOS:
An example of the PVS-Studio report conversion command using plog-converter (Linux/macOS):
plog-converter -t json -a 'GA:1,2;OWASP:1'
   -o /home/user/Logs/PVS-Studio.json PVS-Studio.log
An example of the PVS-Studio report conversion command using PlogConverter.exe (Windows):
PlogConverter.exe -t Json -a 'GA:1,2;OWASP:1' -o /home/user/Logs
                  -n PVS-Studio PVS-Studio.plog
To convert the PVS-Studio report to the CodeChecker format, run the following command:
report-converter -t pvs-studio -o ./pvs_studio_reports ./PVS-Studio.jsonThe -t flag indicates the format of the input report, -o indicates the directory with saved converted warnings. Read more about the other features of report-converter in the documentation.
To save the converted report on the web server for further work, run the following command:
CodeChecker store ./codechecker_pvs_studio_reports -n defaultAfter the -n flag, pass the name of the CodeChecker run.
How to view PVS-Studio report
Now a run with the specified name appears in the list of runs for the project.
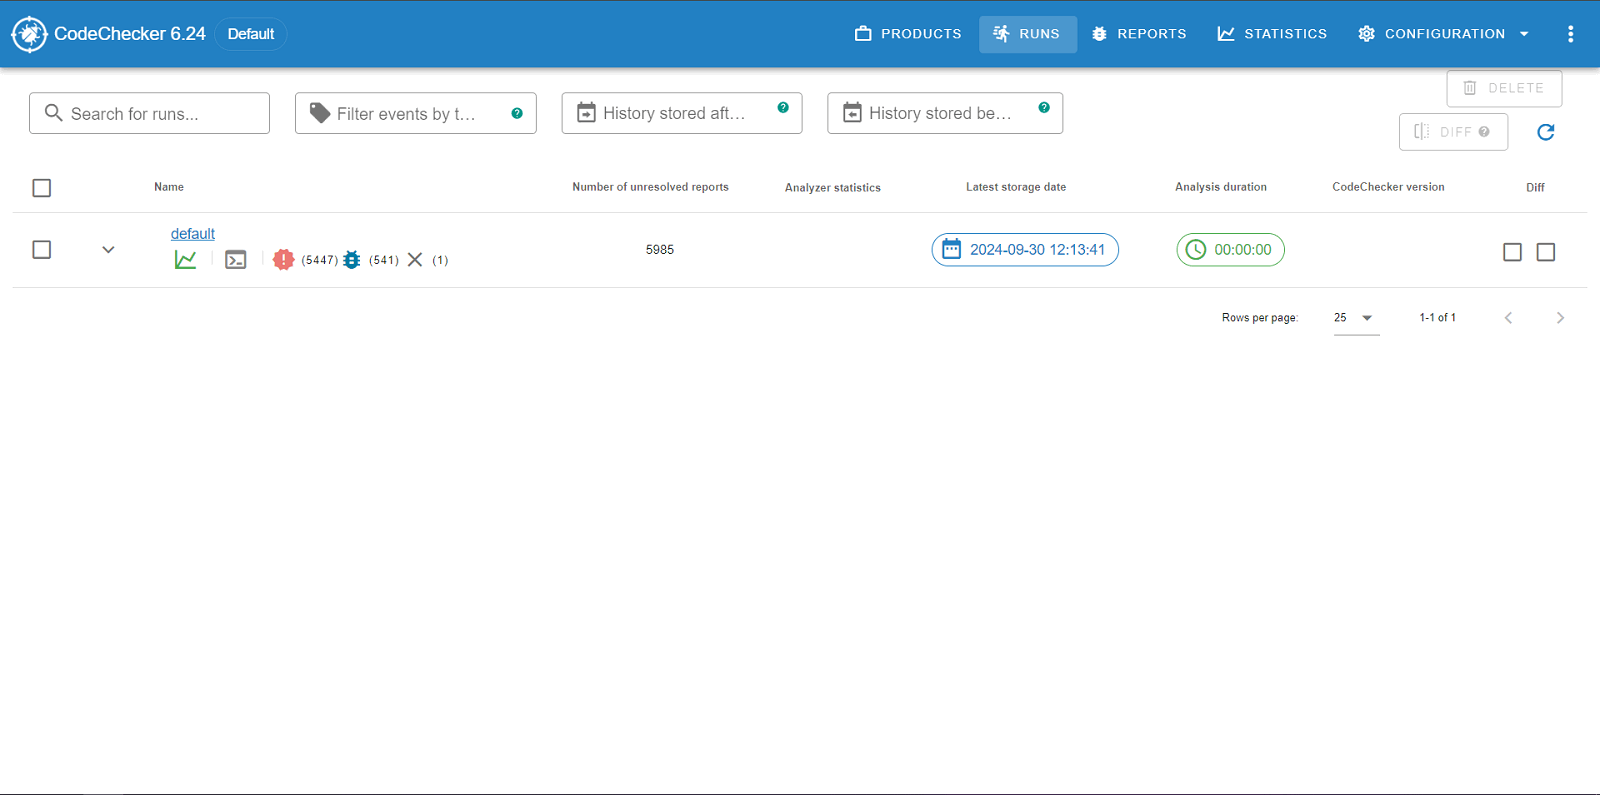
To view a list of warnings for the project, click its name:
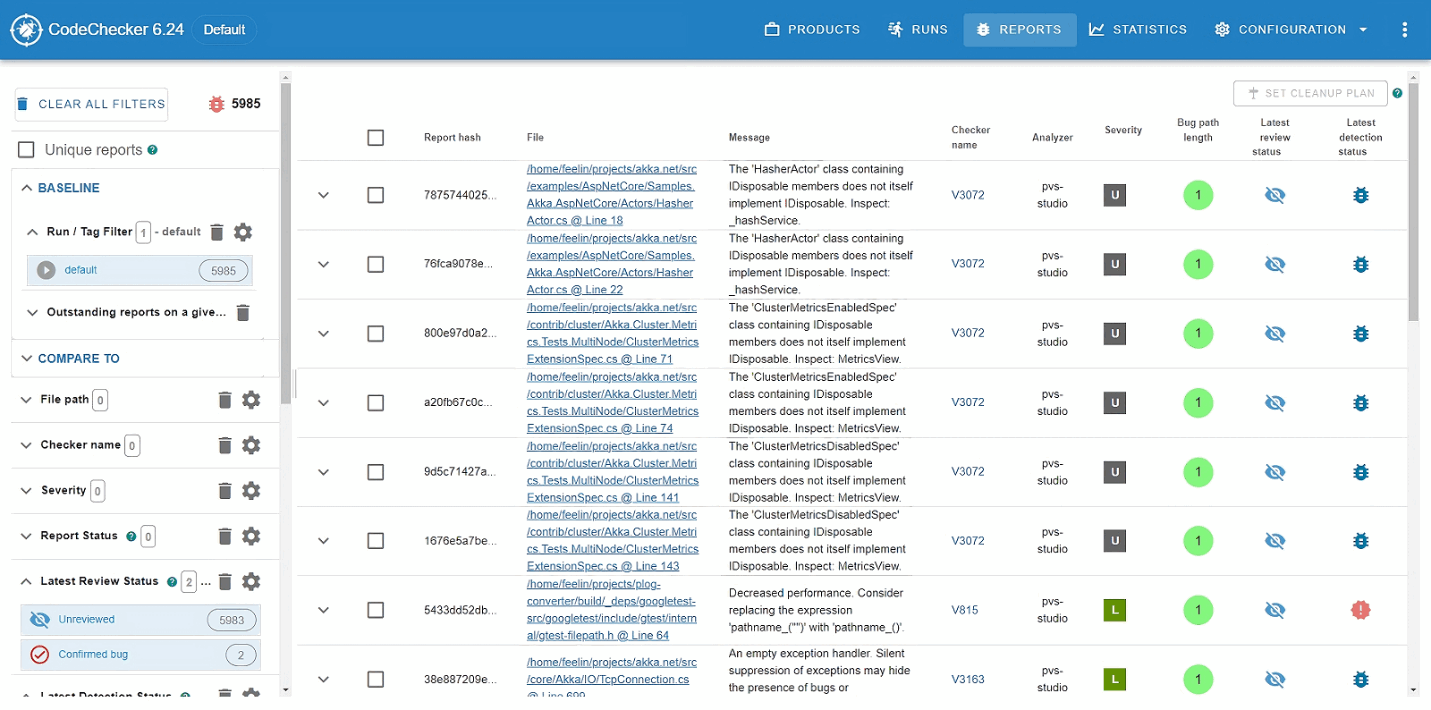
On the page, you can filter and sort warnings by certain parameters, such as severity level or diagnostic rule name.
To see for what code fragment the warning was issued, click the specific warning location:
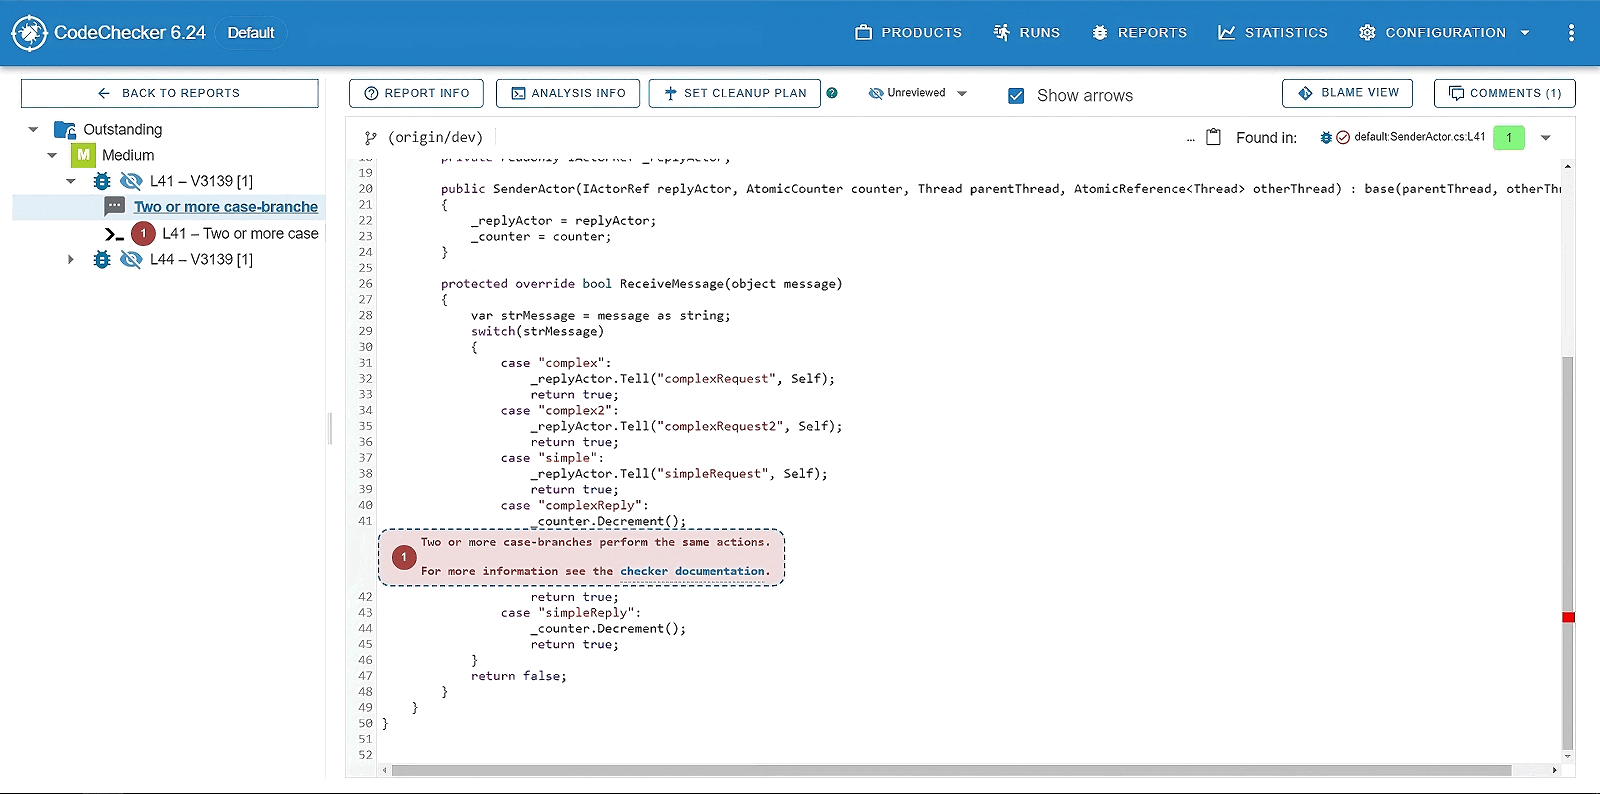
On the same page, you can change the Review status of the opened warning. The feature can be useful for marking analyzer warnings after the analysis. You can assign one of the following statuses to each warning:
- Confirmed bug means that the warning is true and needs to be fixed;
- False positive means that the warning is false;
- Intentional means that the warning is true but doesn't need to be fixed.
If a warning is marked as False Positive, it will be excluded from the report in all future runs.
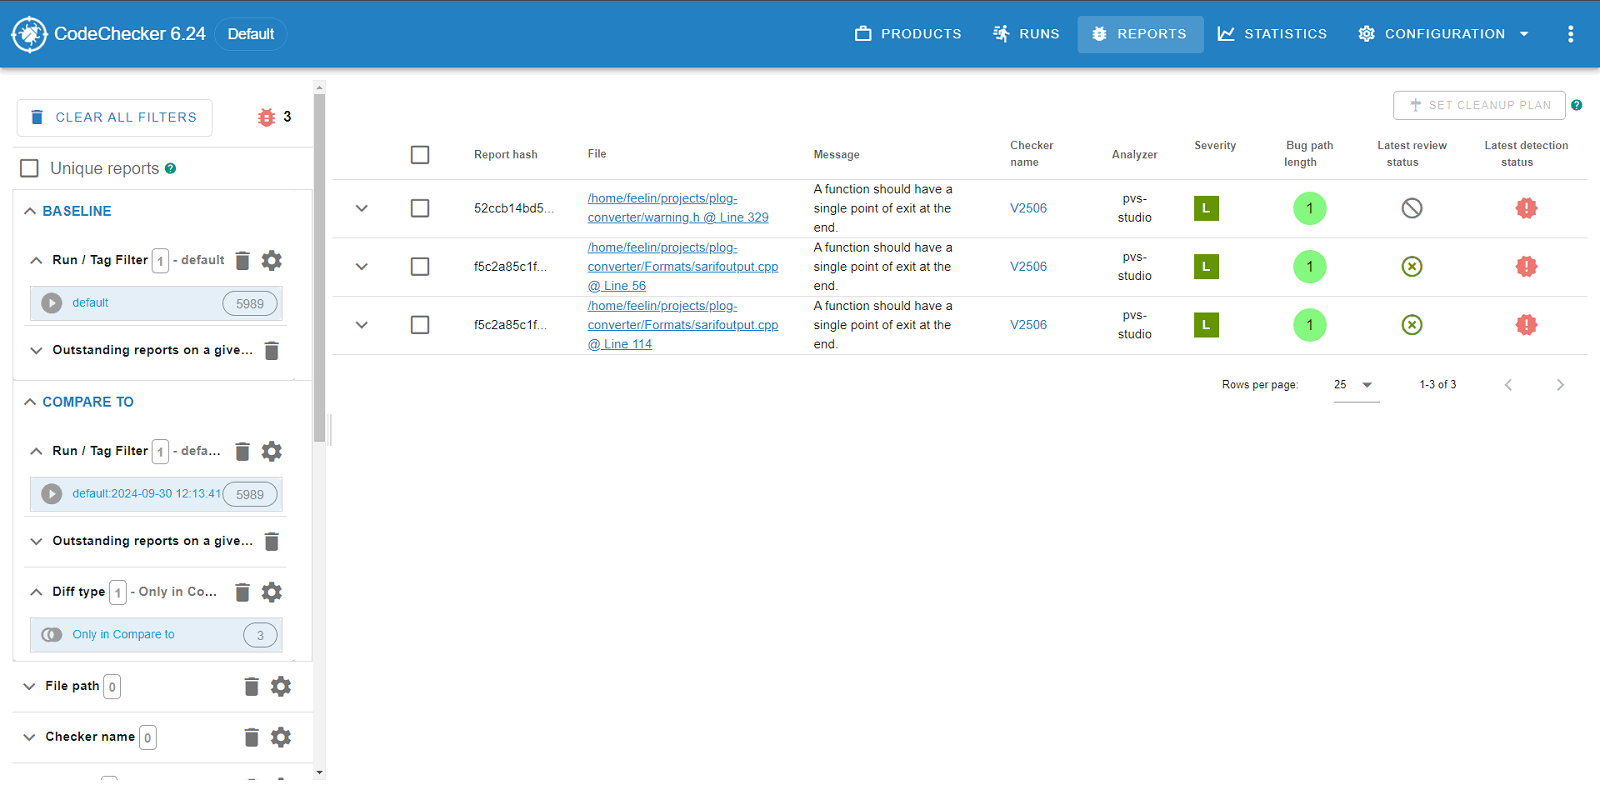
New warnings are marked with a special icon in the list. You can also view the difference between individual runs:
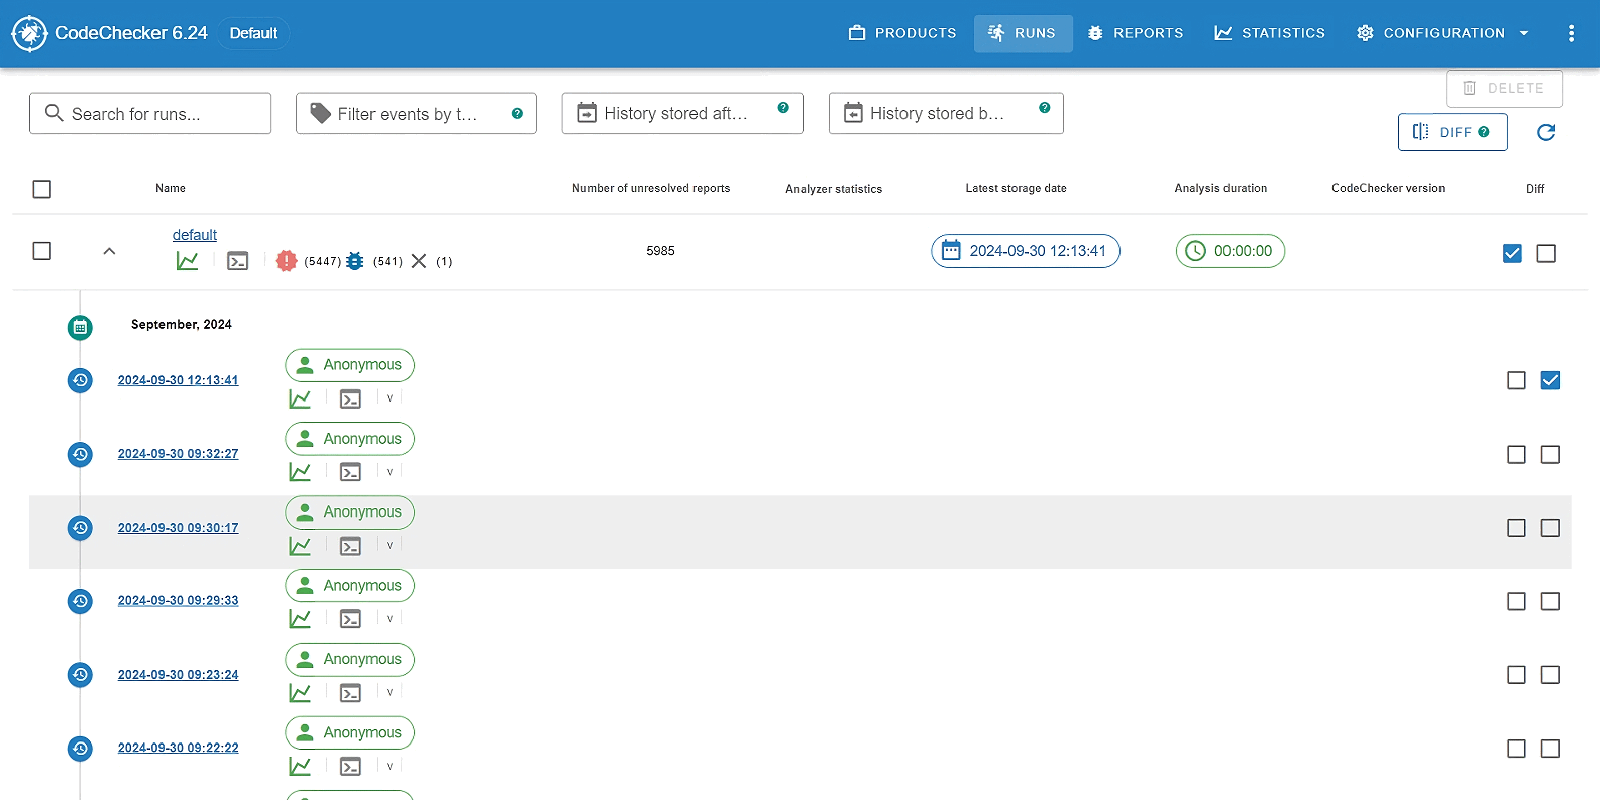
After clicking the Diff button, you can see only the list of the warnings that differ from each other:
