PVS-Studio for embedded development
- Watch, don't read (YouTube)
- Analysis of projects in Linux and macOS
- Analysis of projects in Windows
- Warnings with the V001 number
- The used compiler is not in the list
- Static Application Security Testing (SAST)
- Additional links
Development for embedded systems has its own specific characteristics and approaches, but control of code quality in this sphere is no less important than in the other ones. PVS-Studio supports the analysis of projects that use the following compilers:
- IAR embedded workbench
- Keil embedded development tools for Arm
- TI ARM code generation tools
- GNU embedded toolchain
Supported platforms for development are Windows, Linux and macOS.
Watch, don't read (YouTube)
Analysis of projects in Linux and macOS
After installing the analyzer in Linux or macOS, the pvs-studio-analyzer utility for projects analysis will become available. Learn more about how the utility works here.
Automatic definition of supported compilers is added in the utility. If a modified or advanced development package is used, you can list the names of the used embedded-compilers with the help of the ‑‑compiler parameter.
-C [COMPILER_NAME...], --compiler [COMPILER_NAME...]
    Filter compiler commands by compiler name
Analysis of projects in Windows
After installing the analyzer, a large set of different utilities meant for various analyzer working modes, will be available.
Console mode
The project analysis can be automated using successive runs of the following commands of the CLMonitor utility:
"C:\Program Files (x86)\PVS-Studio\CLMonitor.exe" monitor
<build command for your project>
"C:\Program Files (x86)\PVS-Studio\CLMonitor.exe" analyze ... -l report.plog ...
Note. The command runs the process in a nonblocking mode.
Graphic mode
In the Compiler Monitoring UI utility, you need to change the mode to the build monitoring in the menu Tools > Analyze Your Files (C/C++) or by clicking the "eye" on the toolbar:

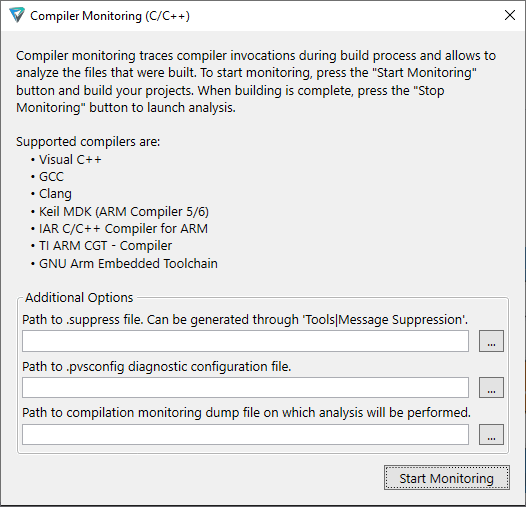
Before running the build monitoring, the following menu for additional analysis configuration will be available:

After running the monitoring, a project build is to be performed in an IDE or with the help of build scripts. Once the build is complete, click Stop Monitoring in the following window:

The analysis results will be available in the Compiler Monitoring UI utility after the analysis of files in the compilation.
Note. The default method of the compilation monitoring may miss some source files. The problem is especially relevant for Embedded projects since their files are written in C language and can be quickly compiled. To monitor all files that are being compiled, read the Wrap Compilers section of the documentation about monitoring utility.
Warnings with the V001 number
In the analyzer report, such warnings might be encountered:
V001: A code fragment from 'source.cpp' cannot be analyzed.Developers of compilers for embedded systems often diverge of standards and add non-standard extensions in the compiler. In the sphere of microcontrollers it is particularly prevalent and is not something unusual for developers.
However, for a code analyzer it represents non-standard C or C++ code, which requires additional support. If such warnings come up for your code, send us, please, the archive with the preprocessed *.i files received from the problematic source files and we'll add support of new compiler extensions.
You can enable the mode of saving such files while analyzing in the following way:
- In the Compiler Monitoring UI utility in the menu Tools > Options... > Common Analyzer Settings > RemoveIntermediateFiles set the false value;
- Pass the ‑‑verbose parameter to the utility pvs-studio-analyzer.
The used compiler is not in the list
The market of development packages for embedded systems is very wide, so if you haven't found your compiler in the list of supported ones, please, report us about your desire to try PVS-Studio via the feedback form and describe in detail the used development tools.
Static Application Security Testing (SAST)
To improve the quality of code or security of devices in the sphere of development for embedded systems, some people often follow different coding standards, such as SEI CERT Coding Standard and MISRA and also try to avoid the emergence of potential vulnerabilities, guided by a list of the Common Weakness Enumeration (CWE). PVS-Studio checks code compliance to such criteria.
Additional links
This document includes peculiarities of launching the analyzer and checking of projects for embedded systems. As for the rest, the analyzer launch and its configuration are made the same as for other types of projects. Before using the analyzer we recommend checking out the following documentation pages:
