
Analysis of Unreal Engine projects
- Analysis using compiler monitoring
- Running the analysis of Unreal Engine projects on Linux
- Issues with running the PVS-Studio analyzer on Unreal Engine 5.0.0, 5.0.1, and 5.0.2
- Troubleshooting UnrealBuildTool .pvslog file detection
- Analysis using UnrealBuildTool integration
- Integrating PVS-Studio via the compile flag
- Integrating PVS-Studio via the target file
- Integrating PVS-Studio via the Build Configuration file
- Incremental analysis
- How to use the analyzer with the project build (for Unreal Engine versions 4.22 and higher)
- How to calculate the path to the UnrealBuildTool actions cache file when modifying the build scripts
- How to check the Unreal Engine source code
- How to enable .pvsconfig configuration files
- How to enable various diagnostic groups and other additional settings
- Performance optimization of Unreal Engine project analysis
- How to run the analysis in Rider
- Handling the analysis results
- How to exclude files from the analysis with PathMasks
- Baselining analysis results in Unreal Engine projects
- SN-DBS integration
- Distributed analysis via Unreal Build Accelerator
- Troubleshooting
A specialized build system called Unreal Build System is used for building Unreal Engine projects on Windows. This system is integrated over the build system used by the Visual Studio / JetBrains Rider environment (MSBuild) by utilizing autogenerated .makefile MSBuild projects. This is a special type of Visual C++ (.vcxproj) projects in which the execution of the build is relegated to the execution of a command calling a third-party utility, for example (but not necessarily), Make. The use of .makefile projects allows working with source code of Unreal Engine from Visual Studio / JetBrains Rider environment, taking advantage of such features as code autocompletion, syntax highlighting, symbol navigation, etc.
Because .makefile MSBuild projects themselves do not contain full information, necessary to perform the compilation, and therefore, preprocessing of C/C++ source files, PVS-Studio does not support the analysis of such projects from within Visual Studio, or by PVS-Studio_Cmd.exe command line tool. Therefore, to analyze such projects with PVS-Studio, you can go two ways: monitoring of compiler invocations (Compiler Monitoring) and direct integration of the PVS-Studio.exe C/C++ analyzer in the UnrealBuildTool utility.
Analysis using compiler monitoring
Unreal Build System uses the Visual C++ compiler-cl.exe for building on Windows. This compiler is supported by the system of PVS-Studio compiler monitoring on Windows. It can be both used from the C and C++ Compiler Monitoring UI or from CLMonitor.exe command-line tool.
Compiler monitoring can be launched manually from within the Compiler Monitoring UI or it can be assigned to the event of starting\ending builds in Visual Studio. The result of the analysis by the monitoring system is a .plog XML report file, which you can open from the Visual Studio PVS-Studio extension, or convert to one of the standard formats (.txt, .html, .csv) using the PlogConverter special tool.
A more detailed description for the system of compiler monitoring is available in this section of the documentation. We recommend using this way to run the analysis when you want to check it for the first time and get acquainted with the analyzer, as this way is the easiest one to set up.
Running the analysis of Unreal Engine projects on Linux
To analyze the Unreal engine project, you need to first trace its full build. A project on Linux is built with the AutomationTool script.
pvs-studio-analyzer trace -- \
  <UnrealEngine source location>/UnrealEngine/Engine/
    Build/BatchFiles/RunUAT.sh \
  BuildCookRun -project="<Project path>/<Project name>.uproject" \
  -build -Clean -targetplatform=Linux ....
pvs-studio-analyzer analyze ....
You can find the full documentation for the pvs-studio-analyzer utility on the page "Cross-platform analysis of C and C++ projects in PVS-Studio".
Instructions for working with the report obtained after the analysis can be found here: "How to view and convert analyzer's results".
Issues with running the PVS-Studio analyzer on Unreal Engine 5.0.0, 5.0.1, and 5.0.2
Unreal Engine 5.0.0, 5.0.1, and 5.0.2 has a bug because of which Unreal Engine Build Tool cannot find the analyzer core on the default path: %ProgramFiles(x86)%\PVS-Studio\x64\PVS-Studio.exe:
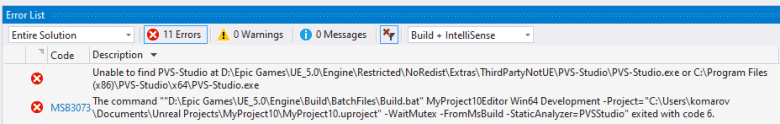
As of now, there is a temporary solution—you need to copy the PVS-Studio.exe file from the "%ProgramFiles(x86)%\PVS-Studio\x64" folder to "...\UE_5.0\Engine\Restricted\NoRedist\Extras\ThirdPartyNotUE\PVS-Studio".
Note. This bug has been fixed in Unreal Engine 5.0.3.
This section describes the analysis of Unreal Engine projects on Windows.
Troubleshooting UnrealBuildTool .pvslog file detection
UnrealBuildTool serves as an analysis driver. It initiates the analysis of individual files, saves separate reports, and, at the final stage, aggregates these reports into a comprehensive PVS-Studio analyzer report.
For the analyzer to process a file, UnrealBuildTool preprocesses it to generate a .i file for the analyzer. In some cases, UnrealBuildTool may fail at this step, causing the analyzer to be unable to process the file and generate an output report for it. Consequently, UnrealBuildTool will be unable to use this report to compile the unified PVS-Studio report.
In such cases, the UnrealBuildTool console output will display information about an unhandled exception, such as:
Unhandled exception: System.IO.FileNotFoundException:
Could not find file '<FILE>.i.pvslog'.
If you encounter this error, verify that the compiler flags used during compilation and analysis are identical. If you are certain that the flags are identical, but compilation succeeds while analysis fails, please contact our support team.
Analysis using UnrealBuildTool integration
In case of Unreal Build System, the developers from Epic Games provide the opportunity to use PVS-Studio through the direct integration with the build utility called UnrealBuildTool, starting from Unreal Engine 4.17.
Before starting the analysis, you should enter your license for the analyzer. For this you need to enter your data in IDE:
- PVS-Studio > Options... > Registration in Visual Studio;
- Toos > PVS-Studio > Settings... > Registaration in JetBrains Rider.
Please note, that before Unreal Engine version 4.20, UBT was unable to get the license information from the PVS-Studio common settings file. In case UBT does not recognize a license entered via UI, you should create a separate license file with the name of PVS-Studio.lic and place it to the %USERPROFILE%\AppData\Roaming\PVS-Studio directory.
Note. When integrating PVS-Studio with the UnrealBuildTool, the project will not be built. This is because UnrealBuildTool replaces the build process with an analysis process.
Integrating PVS-Studio via the compile flag
UnrealBuildTool allows running the PVS-Studio analysis by adding the following flag in the command line:
-StaticAnalyzer=PVSStudioFor instance, a full command line of UnrealBuildTool might look as follows:
UnrealBuildTool.exe UE4Client Win32 Debug -WaitMutex -FromMsBuild
    -StaticAnalyzer=PVSStudio -DEPLOY
To enable analysis when running from IDE, open the project properties for the chosen configuration:
- 'Properties|Configuration Properties|NMake' in Visual Studio;
- 'Properties|NMake' in JetBrains Rider;
and add the flag -StaticAnalyzer=PVSStudio in the build and rebuild options (Build Command Line / Rebuild All Command Line).
Note 1. Note that in this usage scenario, the project won't be built. Instead, all (on Rebuild command) or changed (on Build command) project files are preprocessed and then the project is analyzed.
Note 2. PVS-Studio integration with UnrealBuildTool supports not all analyzer settings, available from Visual Studio (PVS-Studio > Options...). At the moment, PVS-Studio supports adding exceptions for specific directories through PVS-Studio > Options... > Don't Check Files, enabling various diagnostic rule groups, filtration of loaded analysis results through Detectable Errors.
Note 3. This approach is not supported if .uproject file is opened directly in Rider. Please check the solutions for configuring .uproject build below.
Note 4. When using Unreal Engine version 5.3, the analysis may crash due to inability to find generated.h files of the Unreal Engine itself. The problem is in the way UE 5.3 runs the analysis. When you start analysis using the flag, Unreal Build Tool creates additional folder named UnrealEditorSA in the folder for intermediate files. This folder is defined as the one in which to look for header files. The files of a project go into this folder, but the UE's do not. At the same time, the engine header files can be used in the project. This issue has been fixed in Unreal Engine 5.4. To solve the problem while continuing to use Unreal Engine 5.3, use integration via the .target file.
Integrating PVS-Studio via the target file
You can integrate PVS-Studio into the build process by modifying the .target file. This scenario would be more convenient in case you often re-generate your project files.
For this, add the StaticAnalyzer parameter with the PVSStudio value:
For version 5.0 and below:
    public MyProjectTarget(TargetInfo Target) : base(Target)
    {
     ...
          WindowsPlatform.StaticAnalyzer = WindowsStaticAnalyzer.PVSStudio;
     ...
    }
For version 5.1 and higher:
public MyProjectTarget(TargetInfo Target) : base(Target)
    {
     ...
          StaticAnalyzer = StaticAnalyzer.PVSStudio;
     ...
    }
UnrealBuildTool will now automatically start analyzing your project.
Integrating PVS-Studio via the Build Configuration file
You can integrate PVS-Studio into the build process by modifying BuildConfiguration.xml.
This file can be found under the below paths:
Engine/Saved/UnrealBuildTool/BuildConfiguration.xmlUser Folder/AppData/Roaming/Unreal Engine/UnrealBuildTool/BuildConfiguration.xmlMy Documents/Unreal Engine/UnrealBuildTool/BuildConfiguration.xml
An example of minimal working configuration:
<?xml version="1.0" encoding="utf-8" ?>
<Configuration xmlns="https://www.unrealengine.com/BuildConfiguration">
    <BuildConfiguration>
        <StaticAnalyzer>
            PVSStudio
        </StaticAnalyzer>
    </BuildConfiguration>
</Configuration>Note. Versions of Unreal Engine below 5.1 require another configuration. Please check the relevant documentation and the minimal working configuration:
<?xml version="1.0" encoding="utf-8" ?>
<Configuration xmlns="https://www.unrealengine.com/BuildConfiguration">
    <WindowsPlatform>
        <StaticAnalyzer>
            PVSStudio
        </StaticAnalyzer>
    </WindowsPlatform>
</Configuration>
Incremental analysis
It may take a long time to analyze the whole project. Incremental analysis helps speed up the analysis by checking only those files that have been modified since the last build. Incremental analysis starts running only if you have previously performed a full build of the project. To run the incremental analysis, you need to build your Unreal Engine project (Build).
For example, if a project contains A.cpp, B.cpp and C.cpp files, the first time you "build" (analyze) a project in the Unreal Engine versions up to 4.25, all files are analyzed. The next time the project is "built" (analyzed), if no files have been modified, no files are analyzed either. However, if A.cpp and B.cpp files are modified, only these two files will be analyzed.
Note. In the UE 4.25 version or later, instead of modified files, all files from Unreal Engine modules that include modified files will be analyzed during the project "build" (analysis). For example, suppose there is a previously built project that contains two models: "A_Module" and "B_Module". "A_Module" includes A1.cpp and A2.cpp files, and "B_Module" includes B1.cpp and B2.cpp files. If you modify the B2.cpp file and "build" (analyze) the project, both B1.cpp and B2.cpp files from "B_Module" module will be analyzed. This change made incremental analysis worse because now it analyzes all files from a module if at least one file in it has been modified. However, even now the incremental analysis can speed up the project analysis time if the project is divided into modules.
How to use the analyzer with the project build (for Unreal Engine versions 4.22 and higher)
If you need to configure a simultaneous project build and its analysis in terms of one Visual Studio configuration, you can create auxiliary scripts (for example, BuildAndAnalyze and RebuildAndAnalyze) based on standard Build and Rebuild scripts.
The main change in the RebuildAndAnalyze script is a call for building a new script BuildAndAnalyze.bat, but not Build.bat.
In the BuildAndAnalyze script you need to add removal of actions cache and run of UnrealBuildTool with the analysis flag after performing a successful build.
Actions performed by UBT (builds, analysis and so on) are saved in cache.
Restoring the cache from the backup is needed to restore saved build actions. If UBT has not found saved build actions, build will be re-run.
Removing/restoring the cache is needed in order not to save the analysis actions, but not to lose actions on the project build at the same time. It is necessary not to save the analysis actions to the cache because the unmodified files will not be checked if the analysis is performed by the updated version of the analyzer, in which new diagnostic rules were added. Deleting/restoring the cache allows you to avoid this situation. Because of this, even unmodified files will be checked by the new diagnostics, as a result, these diagnostics may detect potential errors or vulnerabilities that were not detected before.
Note 1. Changes described above are based on the standard Build script and the standard script command line. In case if the modified script or non-standard order of arguments is used, additional changes may be required.
Initially, you need to define the number of variables that are needed to remove/restore the action cache file.
Note 2. Cache files in various Unreal Engine versions may differ in both extension and location. Take this into account when creating scripts.
SET PROJECT_NAME=%1%
SET PLATFORM=%2%
SET CONFIGURATION=%3%
SET UPROJECT_FILE=%~5

for %%i in ("%UPROJECT_FILE%") do SET "PROJECT_PATH=%%~dpi"
SET PREFIX=%PROJECT_PATH%Intermediate\Build\%PLATFORM%
SET ACTIONHISTORY_PATH=....
SET ACTIONHISTORY_BAC_PATH= "%ACTIONHISTORY_PATH:"=%.bac"
For various engine versions, the corresponding ACTIONHISTORY_PATH value must be set in the script fragment above.
How to calculate the path to the UnrealBuildTool actions cache file when modifying the build scripts
For versions 4.21 and 4.22
SET ACTIONHISTORY_PATH="%PREFIX%\%PROJECT_NAME%\ActionHistory.bin"For versions 4.23 and 4.24
SET ACTIONHISTORY_PATH="%PREFIX%\%PLATFORM%\%PROJECT_NAME%\ActionHistory.dat"For version 4.25
SET ACTIONHISTORY_PATH="%PREFIX%\%PROJECT_NAME%\ActionHistory.dat"For versions 4.26 and 4.27
REM If you have the build configurations for Client/Server,
REM you need to take them into account when defining the UE_FOLDER variable.
echo %PROJECT_NAME% | findstr /c:"Editor">nul ^
&& (SET UE_FOLDER=UE4Editor) || (SET UE_FOLDER=UE4)
SET ACTIONHISTORY_PATH="%PREFIX%\%UE_FOLDER%\%CONFIGURATION%\ActionHistory.bin"
For versions 5.0 and higher
REM If you have the build configurations for Client/Server,
REM you need to take them into account when defining the UE_FOLDER variable.
echo %PROJECT_NAME% | findstr /c:"Editor">nul ^
&& (SET UE_FOLDER=UnrealEditor) || (SET UE_FOLDER=UnrealGame)
SET ACTIONHISTORY_PATH="%PREFIX%\%UE_FOLDER%\%CONFIGURATION%\ActionHistory.bin"
After calling UnrealBuildTool for building (and the command popd), you need to add the following code:
SET "UBT_ERR_LEVEL=!ERRORLEVEL!"
SET "NEED_TO_PERFORM_ANALYSIS="

IF "!UBT_ERR_LEVEL!"=="0" (
  SET "NEED_TO_PERFORM_ANALYSIS=TRUE"
)

IF "!UBT_ERR_LEVEL!"=="2" (
  SET "NEED_TO_PERFORM_ANALYSIS=TRUE"
)

IF DEFINED NEED_TO_PERFORM_ANALYSIS (
  pushd "%~dp0\..\..\Source"

  ECHO Running static analysis

  IF EXIST %ACTIONHISTORY_PATH% (
    ECHO Backup %ACTIONHISTORY_PATH%
    COPY %ACTIONHISTORY_PATH% %ACTIONHISTORY_BAC_PATH%
    ECHO Removing %ACTIONHISTORY_PATH%
    DEL  %ACTIONHISTORY_PATH%
  )
  ..\..\Engine\Binaries\DotNET\UnrealBuildTool.exe
    %* -StaticAnalyzer=PVSStudio -DEPLOY
  popd

  IF EXIST %ACTIONHISTORY_BAC_PATH% (
    ECHO Recovering %ACTIONHISTORY_PATH%
    COPY %ACTIONHISTORY_BAC_PATH% %ACTIONHISTORY_PATH%
    ECHO Removing %ACTIONHISTORY_BAC_PATH%
    DEL  %ACTIONHISTORY_BAC_PATH%
  )
)
The most important operations from the code above are the cache removal and recovery as well as the run of UnrealBuildTool with the -StaticAnalyzer=PVSStudio flag to perform the analysis.
If needed, use the modified script when working from the IDE environment. For this, you need to specify it as the one you use in the project properties:
- Properties > Configuration Properties > NMake > Build Command Line in Visual Studio;
- Properties > NMake > Build Command Line in JetBrains Rider.
Note. When using modified scripts, you don't need to specify the flag -StaticAnalyzer=PVSStudio in the script launching arguments, as it is already set in the script when running UnrealBuildTool for the analysis.
How to check the Unreal Engine source code
Checking the Unreal Engine code is no different from checking any other UE project.
In both cases, all files submitted for the build are analyzed. If Unreal Engine modules are to be built when the project is built, they are also checked.
To analyze a single Unreal Engine solution, add the code shown in the Integrating PVS-Studio via the target file documentation section to UnrealEditor.Target.cs (located in the UnrealEngine/Engine/Source directory):
Next, run the build with an Editor target (for example, Development Editor).
You can also use the second way to run the analysis.
Open the UE* project properties. In the NMake item, select the Build Command Line field and add the following flag to the command:
-StaticAnalyzer=PVSStudioThen, run the Unreal Engine build.
How to enable .pvsconfig configuration files
Starting with Unreal Engine 5.8, the tool automatically uses global .pvsconfig configuration files located in the %appdata%\PVS-Studio folder. To enable user configuration files, add the StaticAnalyzerPVSConfigs parameter to the target file, then list the necessary configuration files.
public MyProjectTarget(TargetInfo Target) : base(Target)
{
 ....
 StaticAnalyzerPVSConfigs = [
     ".pvsconfig",
     @"D:\UnrealEngine\UEGame\mysettings.pvsconfig"
 ];
 ....
}
If you specify a relative path to the configuration file, it will be resolved against the project folder defined by the Target.ProjectFile property.
To enable user configuration files via the Unreal Build Tool command line, use the -StaticAnalyzerPVSConfigs parameter and list the required .pvsconfig files separated by ;:
-StaticAnalyzerPVSConfigs=.pvsconfig;D:\UnrealEngine\UEGame\mysettings.pvsconfigHow to enable various diagnostic groups and other additional settings
Via modifying target files
Starting from version 4.25 of Unreal Engine, you can enable various diagnostic rule groups.
To select the diagnostic rule groups, modify the project's target files.
For example, you can enable diagnostic rules of micro-optimizations the following way:
public MyUEProjectTarget( TargetInfo Target) : base(Target)
{
  ....
  WindowsPlatform.PVS.ModeFlags =
      UnrealBuildTool.PVSAnalysisModeFlags.Optimizations;
}
Valid values for enabling the appropriate diagnostic rule groups are:
- Check64BitPortability;
- GeneralAnalysis;
- Optimizations;
- CustomerSpecific;
- MISRA.
To enable several groups of diagnostic rules, use the | operator:
WindowsPlatform.PVS.ModeFlags =
    UnrealBuildTool.PVSAnalysisModeFlags.GeneralAnalysis
  | UnrealBuildTool.PVSAnalysisModeFlags.Optimizations;
Starting with Unreal Engine 5.1, you can use several more settings that can be specified in target files:
AnalysisTimeoutFlag;EnableNoNoise;EnableReportDisabledRules.
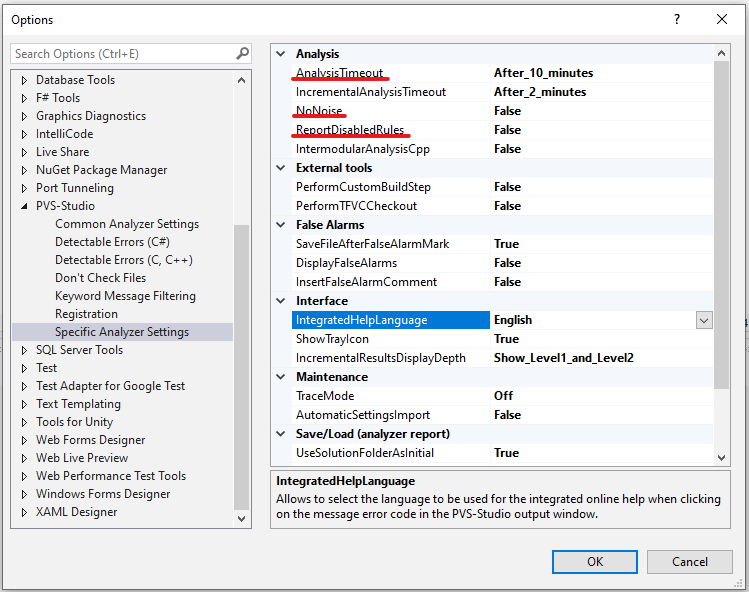
WindowsPlatform.PVS.AnalysisTimeoutFlag sets the timeout for the analysis of one file. One of the values of the AnalysisTimeoutFlags enumeration can be assigned to this property:
After_10_minutes (10 minutes per file);After_30_minutes (30 minutes per file);After_60_minutes (60 minutes per file);No_timeout (no time limit for analyzing one file).
WindowsPlatform.PVS.EnableNoNoise disables the generation of Low Certainty (Level 3) messages.
WindowsPlatform.PVS.EnableReportDisabledRules enables the display of exceptions to analyzer rules, which can be specified in comments and .pvsconfig files. Messages about where the analyzer rule exclusion information came from are displayed in the analysis results as warnings with code V012.
Via the interface of plugins for Rider/Visual Studio
If the target file enables using settings from the Settings.xml file:
public MyUEProjectTarget( TargetInfo Target) : base(Target)
{
  ....
  WindowsPlatform.PVS.UseApplicationSettings = true;
}
then you can specify the settings via the interface of plugins for Visual Studio or Rider.
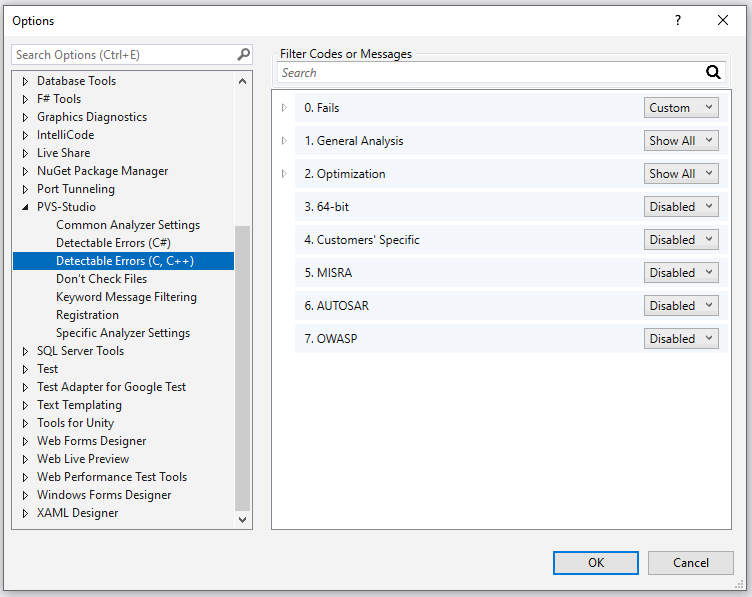
In Visual Studio, the settings to enable or disable diagnostic rule groups are located in Extensions > PVS-Studio > Options... > Detectable Errors (C, C++):
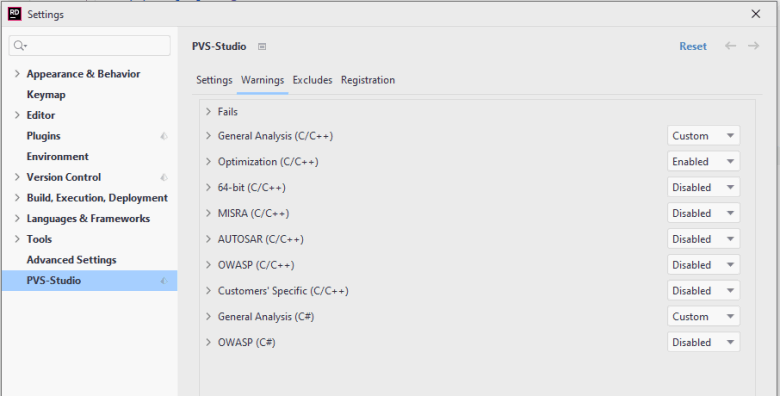
In Rider, the settings to enable or disable diagnostics groups are located in Tools > PVS-Studio > Settings... > Warnings:
Starting with Unreal Engine 5.1, some additional settings became available via the interface of plugins for Rider and Visual Studio.
In Visual Studio, go to Extensions > PVS-Studio > Options... > Specific Analyzer Settings > Analysis:
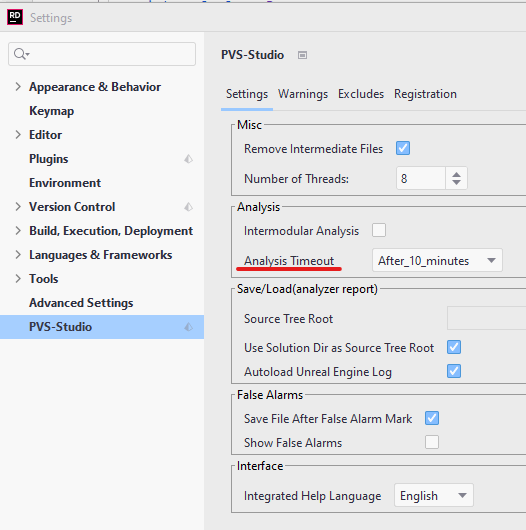
In Rider, go to Tools > PVS-Studio > Settings... > Analysis > Analysis Timeout:
Performance optimization of Unreal Engine project analysis
Disabling Unity Build during the analysis
By default, UnrealBuildTool merges translation units into large files to optimize the build. Such behavior helps optimize build time but can interfere with the code analysis. You may run out of memory because the analyzer checks large files.
We strongly recommend disabling Unity Build to avoid the memory shortage issue during the analysis.
You can disable Unity Build in the *.Traget.cs file by setting bUseUnityBuild = false;
If you want the setting to affect only the analysis process without slowing down the build, add the following to the *.Target.cs file:
For Unreal Engine 5.0 and lower:
  public UE4ClientTarget(TargetInfo Target) : base(Target)
  {
    ...
    if (WindowsPlatform.StaticAnalyzer == WindowsStaticAnalyzer.PVSStudio)
    {
      bUseUnityBuild = false;
    }
    ...
  }
For Unreal Engine 5.1 and higher:
public UE5ClientTarget(TargetInfo Target) : base(Target)
  {
    ...
    if (StaticAnalyzer == StaticAnalyzer.PVSStudio)
    {
      bUseUnityBuild = false;
    }
    ...
  }
To run the analysis, specify the -StaticAnalyzer=PVSStudio flag in the NMake build command. UnrealBuildTool will disable Unity Build when the StaticAnalyzer parameter is set to PVSStudio.
Disabling the Unreal Engine core analysis
Since Unreal Engine 5.4, a setting to run the analyzer only on project files (skipping the Unreal Engine core module) is available. It enables you to significantly speed up the analysis process.
To enable the setting, add the following flag to the UnrealBuildTool command line:
-StaticAnalyzerProjectOnlyIn the .target.cs file, you can enable this setting as follows:
bStaticAnalyzerProjectOnly = true;Disabling the analysis of auto-generated files
To disable the analysis of auto-generated files, use the guidelines for excluding files from the analysis using PathMasks. Add the *.gen.cpp mask to the PathMasks plugin setting.
Note: starting with Unreal Engine 5.4, the analysis of auto-generated files is disabled by default. You can use the ‑StaticAnalyzerIncludeGenerated flag to enable it again.
Configuring the warning output of UnrealBuildTool
Unreal Engine 5.4 introduced a setting that sets the level of warnings issued by UnrealBuildTool during the analysis. It does not affect PVS-Studio's work but may cause a slowdown when receiving a report. The setting is enabled by default (value = 1).
Disabling (value = 0) helps to avoid the above problem. To do this, add the following flag to the UnrealBuildTool command line:
-StaticAnalyzerPVSPrintLevel=0In the .target.cs file, you can do it as follows:
StaticAnalyzerPVSPrintLevel = 0;How to run the analysis automatically
To run the analysis automatically (for example, in CI/CD systems or scripts), just call the project build command.
To get the build command, open the project properties and select the NMake item. The Build Command Line field contains the searched command.
If you integrate PVS-Studio using the .target.cs file or BuildConfiguration.xml file, just use the given build command. If you integrate PVS-Studio using the UnrealBuildTool flag, add it to the build command.
The build command may look like this:
"Path_to_UE\Engine\Build\BatchFiles\Build.bat" ProjectGame Win64 DebugGame ^
-Project="Path_to_projet\ProjcetGame.uproject" ^
-WaitMutex -FromMsBuild -StaticAnalyzer=PVSStudio
How to run the analysis in Rider
There are several options for running the analysis in Rider directly from the .uproject file.
The first two options are covered in the sections above: Integrating PVS-Studio via the target file and Integrating PVS-Studio via the Build Configuration file.
The third option is to generate a .sln file and open the project using it. You can then add the -StaticAnalyzer=PVSStudio flag to the NMake build command.
Note. You can open Unreal Engine projects directly using the .uproject file in Rider 2022.3 and later. In other versions, you can open a project only using the .sln file.
Handling the analysis results
The path to the file with the analysis results will be displayed in the Output (Build) Visual Studio window (or stdout, if you launched Unreal Build manually from the command line). This file with results is unparsed: it can be opened in IDE:
- by the command PVS-Studio > Open/Save > Open Analysis Report by choosing the
unparsed outputfile type in Visual Studio; - by the command Tools > PVS-Studio > Open Report in JetBrains Rider.
Or you can convert the analysis results using the utility PlogConverter in the way it was described in the section for the XML log above.
You can read more about handling the list of warnings in the article "Handling the diagnostic messages list". As for working with the analyzer report, check out the article "Managing XML Analyzer Report (.plog file)".
Automatic loading/uploading of logs in IDE
Automatic loading of the analysis log in the PVS-Studio output window when working in IDE is more convenient. For such a scenario, you need to enable the appropriate option:
- PVS-Studio > Options > Specific Analyzer Settings > Save/Load (analyzer report) > AutoloadUnrealEngineLog in Visual Studio;
- Tools > PVS-Studio > Settings... > Settings > Save/Load (analyzer report) > Autoload Unreal Engine Log in JetBrains Rider.
How to exclude files from the analysis with PathMasks
You can specify the directory masks in the settings of the PVS-Studio plugin for Visual Studio, the PVS-Studio plugin for Rider, and C and C++ Compiler Monitoring UI utility (Standalone.exe). If the full path to the file contains a fragment that matches with one of the PathMasks masks, this file will be excluded from the analysis.
Note. For Unreal Engine projects, only directory masks (PathMasks) are relevant, but not file name masks (FileNameMasks).
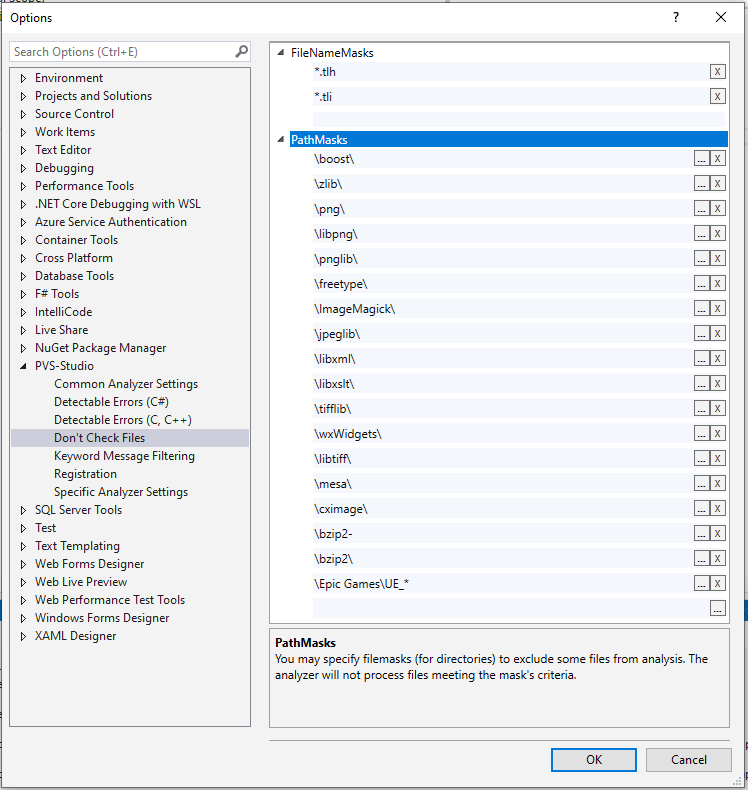
In the plugin for Visual Studio, these settings are located in Extensions > PVS-Studio > Options... > Don't Check Files:
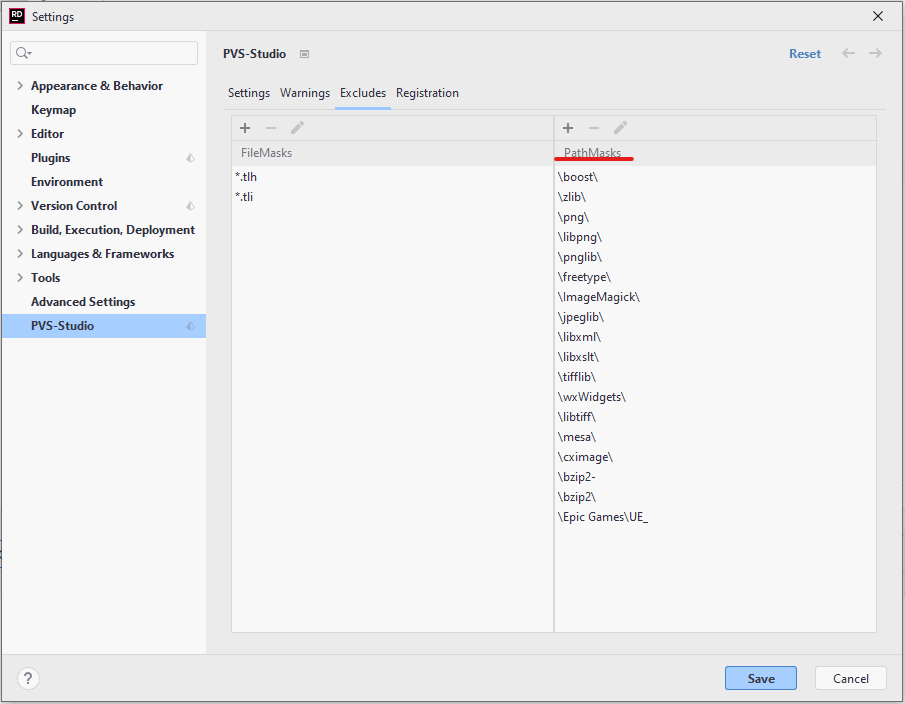
In Rider, masks for excluding directories are located in Tools > PVS-Studio > Settings > Excludes:
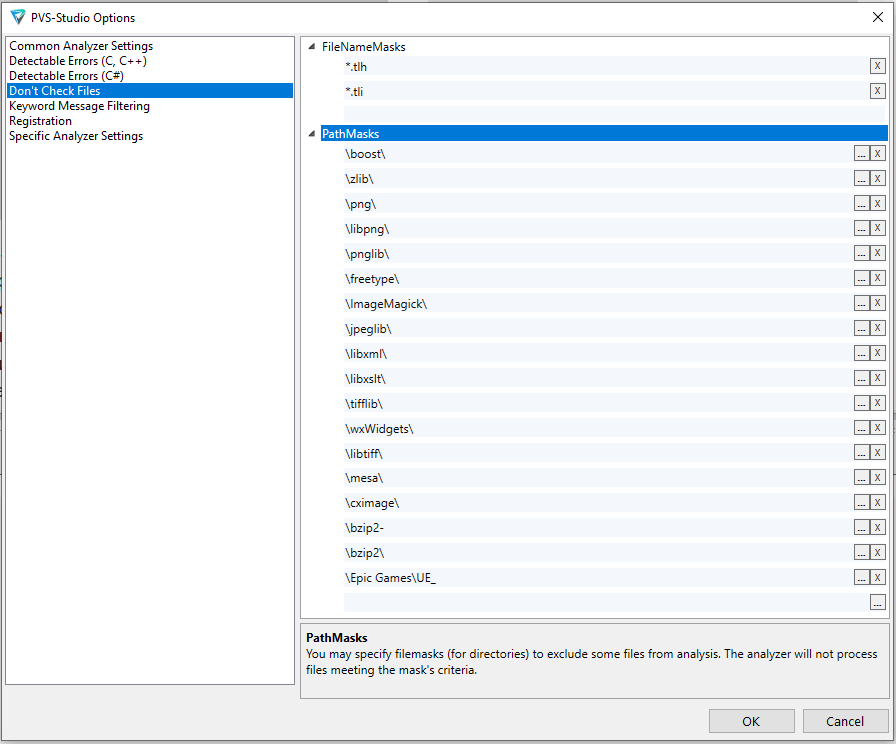
Similar settings are available for C and C++ Compiler Monitoring UI (Standalone.exe) in Tools > Options... > Don't Check Files:
Among these masks, there is a special default mask to exclude the Unreal Engine source code: \Epic Games\UE_. This mask is added by default to prevent the analysis results from being cluttered with unnecessary warnings, information about which is unlikely to be useful for most developers.
Note. If Unreal Engine is installed in a non-default path, the analyzer's report will contain warnings issued for the Unreal Engine source code. If they bother you, then add the directory in which Unreal Engine is installed to PathMasks.
For more information on excluding files from analysis, see "Settings: Don't Check Files".
Baselining analysis results in Unreal Engine projects
Baselining of analyzer warnings is based on the message suppression feature.
Numerous analyzer warnings on legacy code often disrupt the regular use of static analysis. The legacy code is usually well tested and works stably, so it may be unnecessary to edit all the warnings there. Moreover, if the size of the code base is large enough, such edits can take a huge amount of time and effort. However, if you leave warnings for the existing code unhandled, they will disrupt the work with the warnings for the fresh code.
To solve this problem and start using static analysis on a regular basis, you can disable warnings for the legacy code. To do this, the PVS-Studio plugins for Visual Studio and JetBrains Rider have interface elements that allow you to suppress analyzer warnings in the corresponding IDEs.
The warning suppression mechanism for Unreal Engine projects in these IDEs has only one difference for the user. For UE projects, the user needs to manually add one suppress file to the solution. For non-UE projects, suppress files can also be added automatically to each project.
If you try to suppress warnings in Visual Studio or Rider for the UE project when the solution suppress file does not exist, you will get a warning. In Visual Studio:
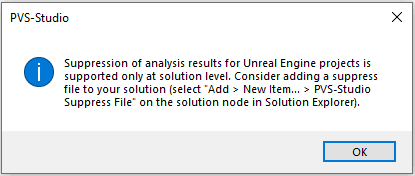
In Rider:
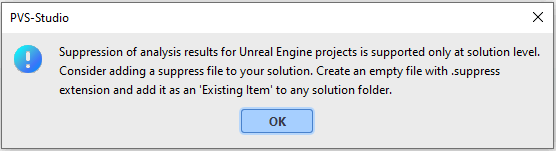
These messages describe the steps to add a solution-level suppress file.
You can see a detailed description of the suppression mechanism in these IDEs in the corresponding sections of the documentation:
- Suppression of analyzer warnings in the PVS-Studio plugins for CLion and Rider;
- Suppression of analyzer warnings in legacy code in Visual Studio.
For more information about the warning suppression mechanism, see the documentation section "Baselining analysis results (suppressing warnings for existing code)".
Suppressing analyzer warnings from the command line
If you are building your Unreal Engine project from the command line (using UnrealBuildTool.exe via the Build.bat or Rebuild.bat batch files), it may be convenient for you to use the PVS-Studio_Cmd.exe console utility to suppress the analyzer warnings. To do this, PVS-Studio_Cmd.exe has the SuppressOnly and FilterFromSuppress modes. The SuppressOnly mode allows you to save the previously received analyzer warnings to a suppress file. A command example to create a suppress file:
PVS-Studio_Cmd.exe -t path/to/solution/file ^
                   -a SuppressOnly ^
                   -o path/to/report.pvslog ^
                   -u path/to/suppress_file.suppress
As a result of executing this command, all the issued warnings from the path/to/report.pvslog report will be added to path/to/suppress_file.suppress. If suppress file from the -u flag does not exist, it will be created.
FilterFromSuppress allows you to use the suppress file to filter the messages. Here is the example of filtering the analyzer's report with a suppress file:
PVS-Studio_Cmd.exe -t path/to/solution/file ^
                   -a FilterFromSuppress ^
                   -o path/to/report.pvslog ^
                   -u path/to/suppress_file.suppress
As a result of executing this command, the path/to/report_filtered.plog file will be created next to the path/to/ report.pvslog report. It will contain all analyzer warnings missing from path/to/suppress_file.suppress.
To have analyzer warnings in the report only for new or changed code, you first need to get a suppress file that will serve as a "starting point" (baseline). To get a suppress file, you need to do the following:
- run the analysis of the Unreal Engine project and get a
.pvslogreport (by default it is located in theProjectDir/Saved/PVS-Studiofolder); - get a suppress file for the analyzer report using the
SuppressOnlymode; - filter the received analyzer reports with the
FilterFromSuppressmode. Filter the reports using the previously obtained suppress file.
The analyzer report in the .plog format obtained after filtering in the FilterFromSuppress mode can be opened in Visual Studio with the plugin for PVS-Studio. You can also use the C and C ++ Compiler Monitoring UI utility. It is also possible to convert the .plog report to other formats using the PlogConverter.exe utility in Windows.
Suppressing analyzer warnings using the .Build.cs file
Starting with the Unreal Engine 5.5, you can suppress warnings using the .Build.cs file. To do it, add the following line to the file:
StaticAnalyzerPVSDisabledErrors.Add("V####");where "V####" stands for the code of the diagnostic rule to be disabled.
If you need to suppress multiple warnings, list their codes separated by spaces:
StaticAnalyzerPVSDisabledErrors.Add("V### V###");Note that the .Build.cs file is generated for each project directory, and the diagnostic rules defined in this file are disabled only for the directory where the file is located.
SN-DBS integration
SN-DBS is a distributed software build system developed by the SN Systems. Prior to the UE 5.5, PVS-Studio integration did not work correctly with SN-DBS integration. When trying to run a parallel analysis of a project, the analysis was performed only on the files that were analyzed on the SN-DBS master node. The build logs contained the message "fatal error C1510: Cannot load language resource clui.dll."
Solutions:
1) Switch to the UE 5.5 version.
2) Apply this patch to the file Engine/Source/Programs/UnrealBuildTool/Platform/Windows/PVSToolChain.cs in case you are building UBT from source files.
This issue was fixed in the UE 5.5 release.
Distributed analysis via Unreal Build Accelerator
Unreal Engine 5.5 introduces a new tool called Horde, a platform that allows users to use CPU cycles on other machines to accelerate workloads.
Horde includes Unreal Build Accelerator (UBA), a tool that implements virtualization for third-party programs (such as C++ compilers or PVS-Studio analyzer), allowing them to run on a remote machine while requesting information from the initiator as needed.
Installation
To install the Horde server on your machine, you need to:
- Link your Epic Games account to GitHub in the Apps and Accounts tab in the Epic Games account settings.
- Accept the received invitation to join the Epic Games organization for performing following stages.
To install the Horde server on Windows, run the appropriate installer. You can download it via the link.
Alternatively, you can deploy the Horde server using Docker. First, generate a Personal Access Token on GitHub, then use it to authenticate with the GitHub Container Registry by running:
docker login ghcr.ioIf authorization completes successful, the following command will work, and the Horde image will be downloaded:
docker pull ghcr.io/epicgames/horde-server:latestTo start the Horde server, the external instances of Redis and MongoDB are required. They should be configured via a configuration file or environment variables.
Alternatively, you can deploy the Horde server with the required components using Docker Compose. To do this, take the docker-compose.yaml file from the Unreal Engine source code and run the following command in the directory where the file is located:
docker-compose upIn this file, you can preconfigure the ports where the Horde server will be deployed. The first port is used for the server management interface, while the second port hosts the API for connecting agents:
....
horde-server:
    image: ghcr.io/epicgames/horde-server:latest
    restart: always
    environment:
      Horde__HttpPort: 13340
      Horde__Http2Port: 13342
      Horde__RedisConnectionConfig: redis:30002
      Horde__DatabaseConnectionString:
 mongodb://horde:dbPass123@mongodb:27017/Horde?authSource=admin
    ports:
      - 13340:13340 # HTTP/1
      - 13342:13342 # HTTP/2
    volumes:
      - ./data:/app/Data
....
How to connect agents
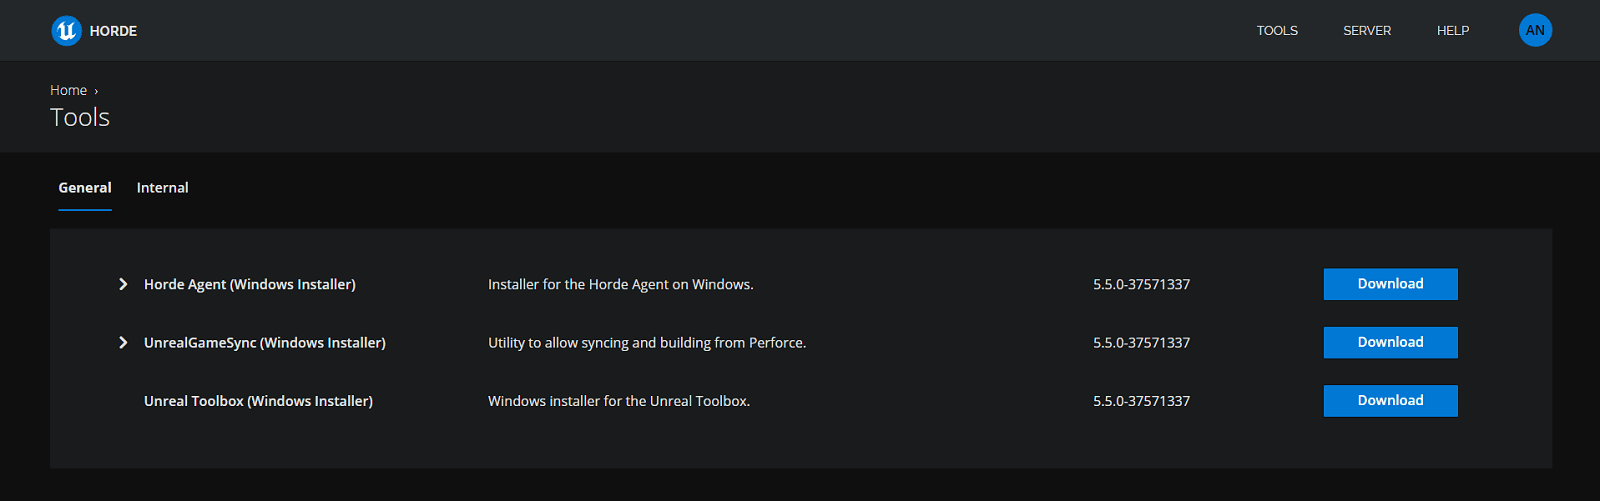
To add agents to the Horde server, install Horde Agent on the machines that will act as agents. A download link for the installer is available on the Horde server at the URL: { HordeHost }/tools:
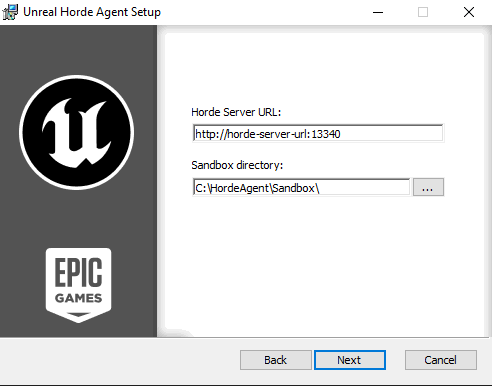
When installing Horde Agent using .msi, specify the server URL that the agent should connect to:
After installation, leave the Enroll agent with the Horde Server option enabled. This ensures that the agent is added to the list of agents available for connection on the Horde server. This list is located at /agents/registration. Once Horde Agent is installed on the remote machine, information about this agent will appear on this page:
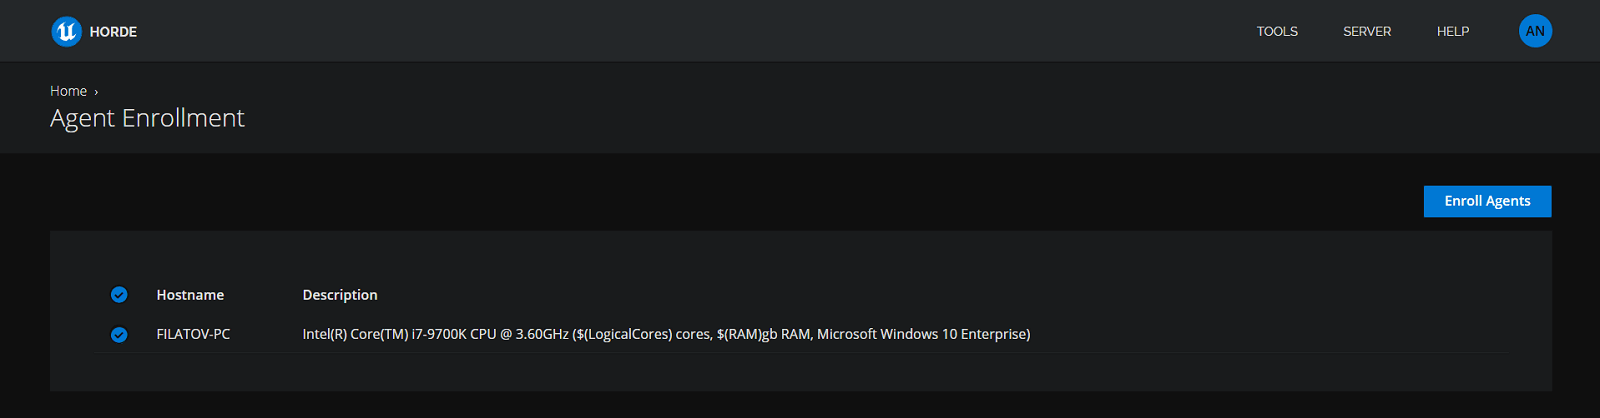
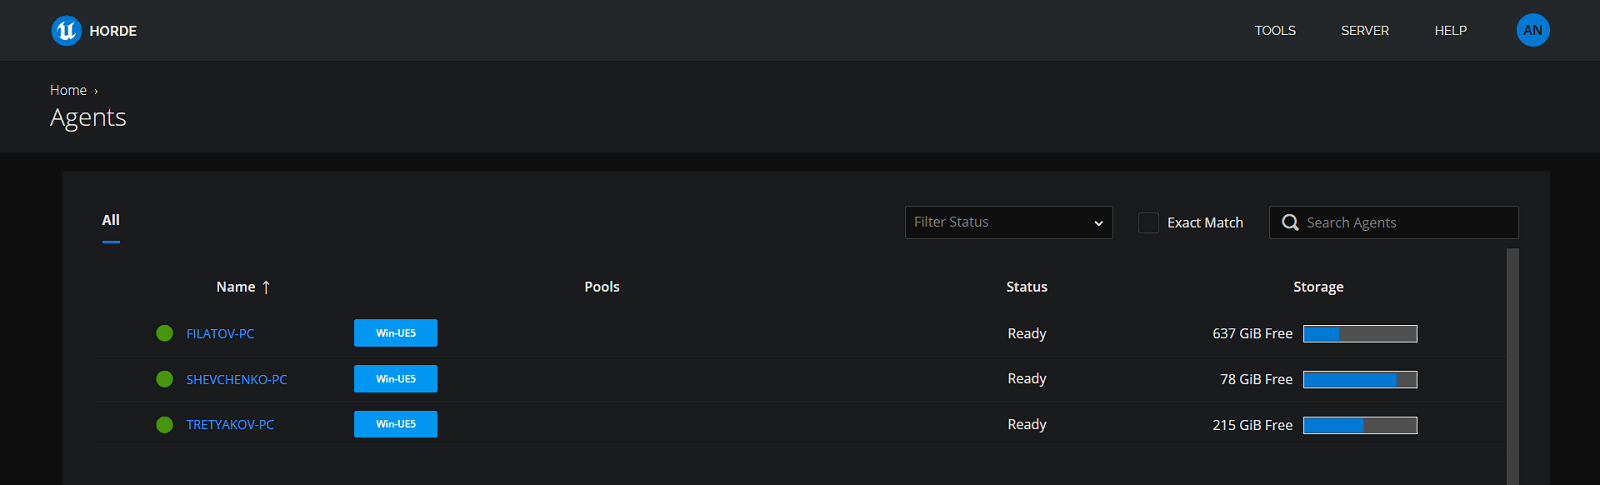
To connect the agent, select it from the list and click Enroll Agents. Once the installation is complete, the newly added agent will show up on that page (URL: /agents):
How to use remote computers for load balancing in Unreal Engine-related tasks
To distribute build tasks across multiple machines, update the BuildConfiguration.xml file (see the Unreal Engine documentation for its location). Add several properties to this file that enable Horde and UBA:
<?xml version="1.0" encoding="utf-8" ?>
<Configuration xmlns="https://www.unrealengine.com/BuildConfiguration">
  <BuildConfiguration>
         <bAllowUBAExecutor>true</bAllowUBAExecutor>
     </BuildConfiguration>

     <Horde>
         <Server>http://horde-server-url:13340</Server>
         <WindowsPool>Win-UE5</WindowsPool>
     </Horde>

     <UnrealBuildAccelerator>
         <bForceBuildAllRemote>false</bForceBuildAllRemote>
         <bLaunchVisualizer>true</bLaunchVisualizer>
     </UnrealBuildAccelerator>
</Configuration>
bAllowUBAExecutor set to true indicates that UBA will be used during the build process. The Horde group contains settings for the used Horde server. The UnrealBuildAccelerator group contains the UBA configuration:
bForceBuildAllRemotewithfalseindicates that the build will run not only on remote machines but also on the server;bLaunchVisualizerwithtrueenables the visualizer during the build.
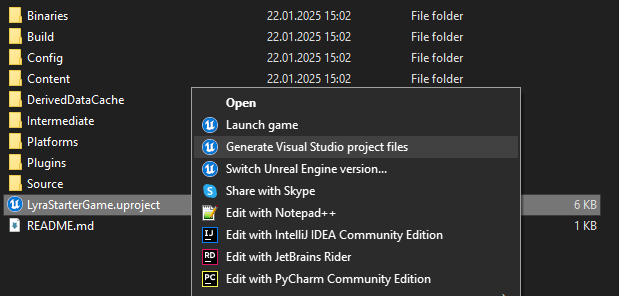
Next, move on to the project and generate project files for Visual Studio from .uproject to open it in the IDE.
In the class constructor in the .target file, add the following field to enables PVS-Studio:
StaticAnalyzer = StaticAnalyzer.PVSStudioNote. When building a project using Horde and UBA, you may encounter an issue where Unreal Engine files in the installation directory are not accessible to the build system. If this happens, check that the file mentioned in the error is not marked as Readonly and that all users have full access to it.
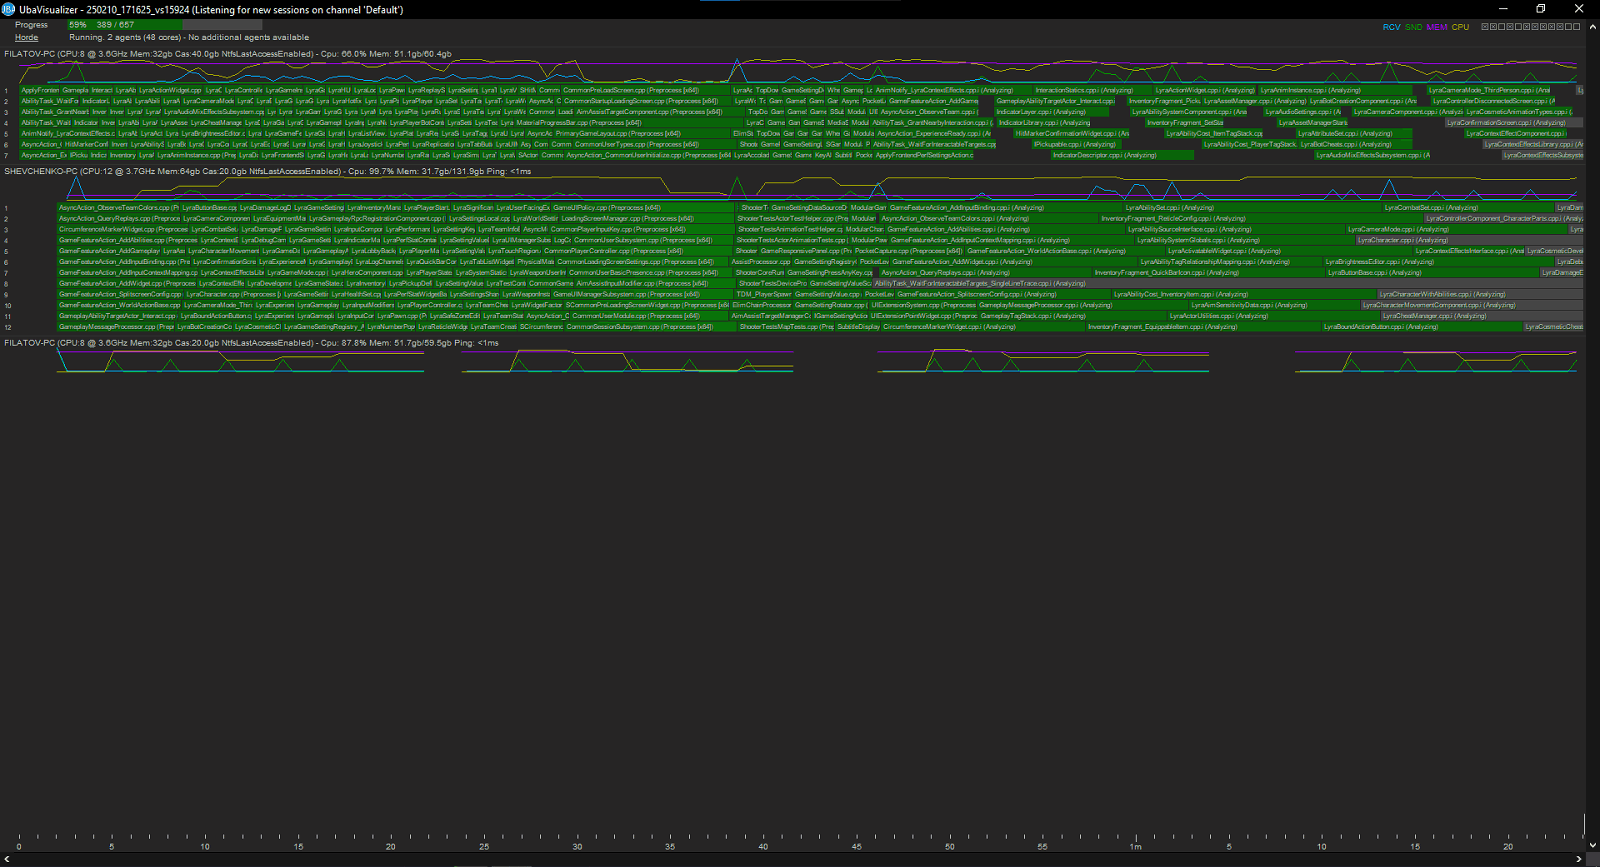
During the build, the visualizer will appear on the screen showing the processes running on each Horde agent:
Troubleshooting
UnrealBuildTool and PVS-Studio work as follows:
- UnrealBuildTool collects the necessary information for PVS-Studio (start commands, compiler options, and so on);
- UnrealBuildTool runs the PVS-Studio C++ analyzer core for each compilation unit (
. Cpp):- PVS-Studio creates a preprocessed file (
.i); - PVS-Studio runs the analysis;
- PVS-Studio saves the report in
.pvslog;
- PVS-Studio creates a preprocessed file (
- After analyzing all the files, UnrealBuildTool merges all the
.pvslogfiles in a single file, which is usually stored in$PROJECT\Saved\PVS-Studio\*.pvslog;
However, a problem may appear at any of the above steps. For example, the analyzer could not check one of the source files. Therefore, if the analysis fails, please contact us immediately. We'll try to find out what caused the failure and fix the issue as soon as possible.
Additional files will help us understand the cause of an issue and reproduce it. Please, attach the following additional files to the email:
- the build log that was received with the
-verboseoption; - the
.pvslogfiles. The paths to.pvslogmay differ. They depend on the Unreal Engine version. But usually the paths to.pvslogare based on{PLATFORM}and{CONFIGURATION}. For example, in UE 4.26 you can find the paths to.pvslogin{PROJECT}\Intermediate\Build\{PLATFORM}\UE4|UE4Editor\{CONFIGURATION}\{PROJECT}\PVS\.
Was this page helpful?