
Baselining analysis results (suppressing warnings for existing code)
- Principle of operation
- Windows: Visual Studio (C, C++ and C# analysis)
- Windows: C and C++ Compiler Monitoring UI
- Projects in C and C++ on Linux/macOS
- Java projects under Windows/Linux/macOS
- Suppression of analyzer warnings in Unreal Engine projects
- Suppression of analyzer warnings in the PVS-Studio plugins for CLion and Rider
- Version control system
- Suppression of analyzer warnings in SonarQube
- Shared use of the baselining features for projects in CI instruments and IDEs
- What can I do after suppressing all warnings?
- Additional links
Baselining analysis results can be useful in the following scenarios:
- PVS-Studio is introduced in a project for the first time and issues a large number of warnings for the entire code. The development manager decides to initiate regular usage of the analyzer only for newly written code and to return to warnings on the current code later.
- PVS-Studio is used in the project on a regular basis. During the development process false positives get in the analyzer report, and you want to suppress them without modifying source code files.
In such cases, analyzer warnings can be suppressed in a special way so that they won't get into newly generated reports. This mode doesn't require modification of the project's source files.
The analyzer supports the analysis of source code in C, C++, C# and Java programming languages. The analysis can be performed under Windows, Linux and macOS. In this regard, ways of warning suppression might differ depending on the used platform and projects' type. For this reason, please go to the section that suits you and follow the given instruction.
Principle of operation
Mechanism of warning suppression is based on using special files, which are added next to the project (or in any specified place). These files contain messages, tagged for this project as "unnecessary". We should note that modification of the source file that contains the tagged messages, and, in particular, line shift, will not lead to the re-emergence of these messages. However, the edit of the line containing this analyzer message can lead to its repeated occurrence, since this message has already become "new".
A warning is considered suppressed if the suppress file contains an entry with elements that match the corresponding warning fields in the analyzer report (there are 6 in total):
- the hash code of the previous line;
- the hash code of the current line (indicated by the analyzer warning);
- the hash code of the next line;
- the name of the file (case-sensitive);
- the unique diagnostic code (VXXX or VXXXX, where X is a number character from '0' to '9');
- the message from the analyzer warning.
The warning message is standardized when it is written to the suppress file, i.e:
- the consecutive numeric characters (0 – 9) are replaced by a single underscore character ('_');
- the consecutive space characters are replaced by a single space character.
When calculating hash codes, not the entire line is processed but only characters up to the first false-positive comment (a line comment that matches one of the following patterns: //-VXXXX, //-VXXX, //-vXXXX, or //-vXXX, where X is a number from '0' to '9'). Tab and space characters are ignored.
The following changes to the source code cancel warning suppression.
- Changing the line indicated by the analyzer warning and/or the previous/next line (tab and space characters are ignored).
- Changing the name of the file (case-sensitive) that contains the suppressed warning.
- Changing the analyzer message. The analyzer message often shows the code snippet from the line for which the warning has been issued. In this case, if you change the code in the line, the analyzer message changes as well. Note: the analyzer developers can also change the analyzer message. However, this is rarely the case because we try not to change the analyzer warning messages.
- Changing the unique diagnostic ID (VXXX or VXXXX, where X is a number between '0' and '9').
Changes to the source code that do not cancel warning suppression.
- Shifting three adjacent lines (the line to which the analyzer issued a warning, as well as the previous and next lines) to any number of lines up or down.
- Adding (or deleting) any number of tab characters or spaces to the line indicated by the analyzer warning or to its adjacent lines.
- Adding false-positive comments to the end of the line (deleting from the end of the line) indicated by the analyzer warning and/or the previous/next line (a line comment that matches one of the following patterns: //-VXXXX, //-VXXX, //-vXXXXXX, or //-vXXX, where X is a number from '0' to '9'). Several false-positive comments may be added at the end of the line.
Windows: Visual Studio (C, C++ and C# analysis)
For Microsoft Visual Studio, you can use the PVS-Studio plugin, which conveniently integrates in IDE. It allows you to check the entire solution, specific projects or files, and it also supports incremental analysis.
Suppressing analyzer warnings in the plugin for Visual Studio
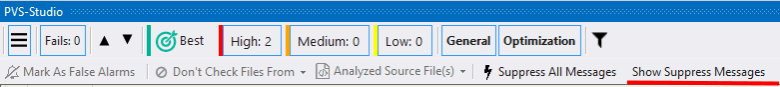
In PVS-Studio menu, the Suppress Messages section opens a window for working with suppressed analyzer warnings.
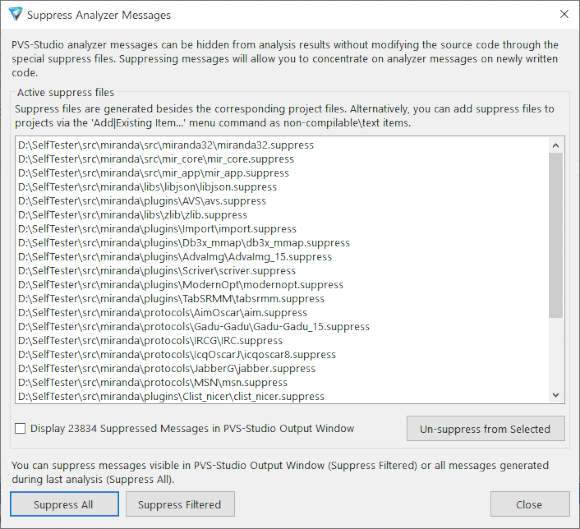
In that window, several actions are available:
- Suppress All – suppresses all of the analyzer's warnings;
- Suppress Filtered - suppresses only the warnings that are currently displayed in the PVS-Studio results window, excepting the messages that are filtered out;
- Un-Suppress from Selected - restores suppressed warnings for selected projects;
- Display Suppressed Messages - displays suppressed analyzer warnings in the PVS-Studio Output Window together with the rest of the warnings. In this mode, you can return to fixing previously suppressed warnings. Such messages will be marked in a special way (crossed out) to avoid confusing them with the un-suppressed ones.
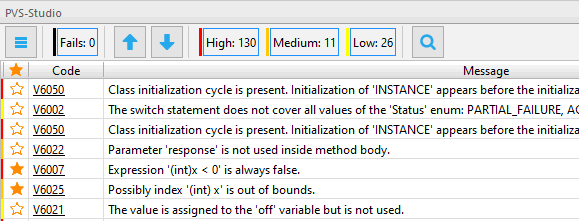
A special window can be used to view analysis results in Visual Studio.
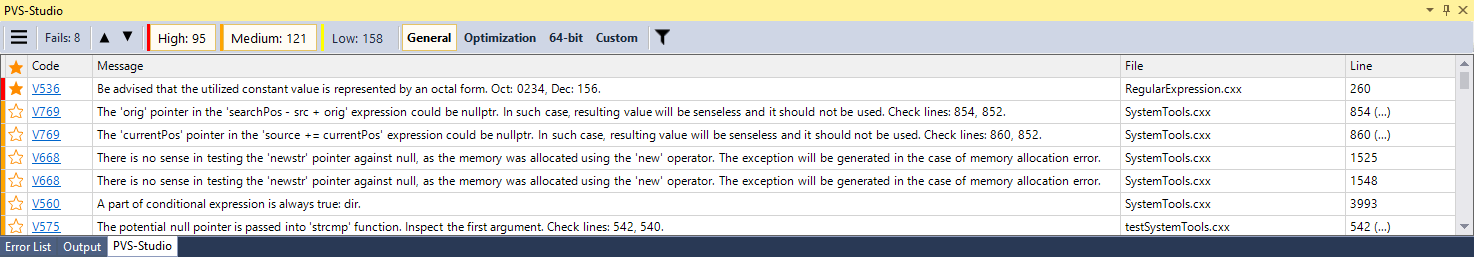
This window allows navigating along analyzer warnings and jump to the code to fix them. The PVS-Studio window provides a wide range of options for filtering and sorting the results. It is also possible to quickly navigate to the documentation of the selected diagnostic.
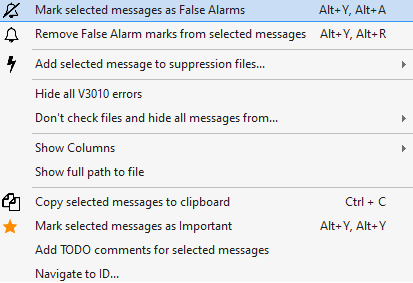
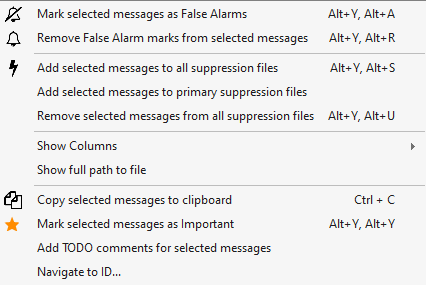
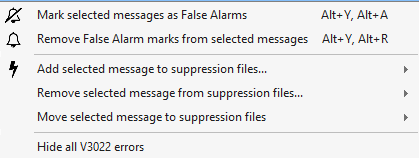
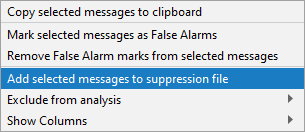
Additional actions for each message are available in the context menu by clicking the right mouse button on the message.
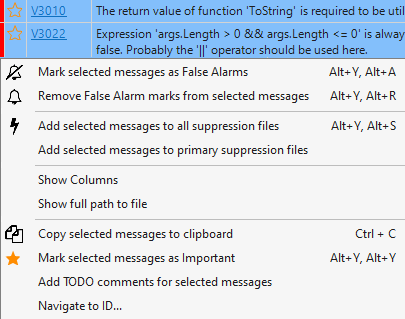
To add multiple selected messages to all suppress files related to the warnings, use the menu item "Add selected messages to all suppression files". Besides this you can also use the menu item "Add selected messages to primary suppression files". This allows you to suppress multiple selected warnings only to the primary suppress files related to the selected warnings.
'Primary' is a mark for suppress files that allows you to prioritize the files (that have this mark) when suppressing warnings. By default, when using normal suppress files, selected warnings in all suppress files of a project/ solution are suppressed. If you want to suppress new warnings only in a specific suppress file, but you have other suppress files with previously suppressed warnings that you do not want to modify, then mark the suppress file for new warnings as 'Primary'.
The 'Primary' mark helps you to separate the first warnings that were suppressed when PVS-Studio was just introduced into the project from the warnings that were suppressed during further regular use of the analyzer. In this case, the user usually needs to further handle the initially suppressed warnings (as they are usually not carefully examined). The warnings issued as a result of regular use of the analyzer are considered to be have already been viewed by the user.
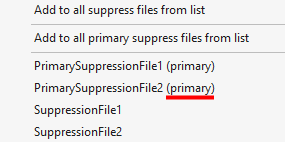
Primary suppress files in drop-down lists are marked with additional text in parentheses:
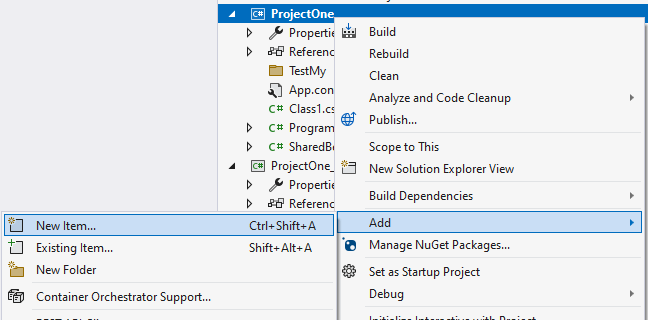
Adding a Primary suppress file to a project or solution is the same as adding a normal suppress file via the "New item..." on the project/solution context menu:
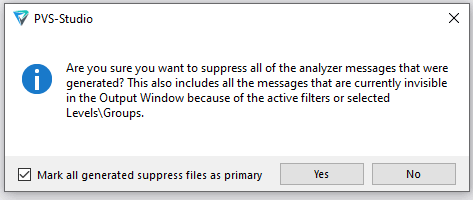
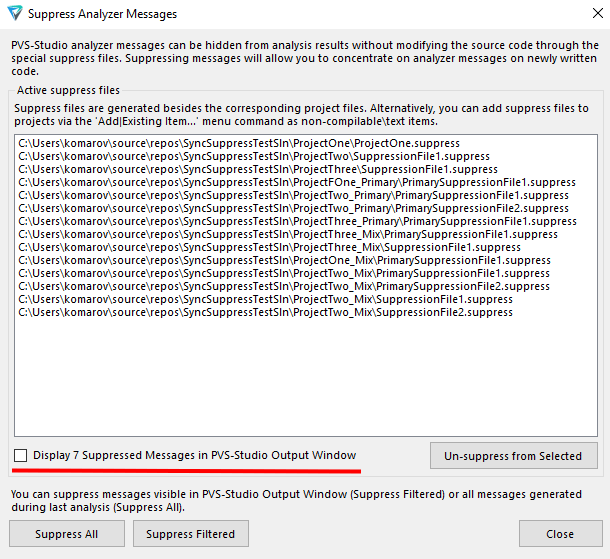
It is also possible to mark all suppress files as primary when suppressing all messages ("Suppress All") or only filtered messages ("Suppress Filtered"). To do this, click the check box in the window that appears during the message suppression:
To unsuppress multiple selected messages, use the menu item "Remove selected messages from all suppression files". This item appears in the context menu of the PVS-Studio Output Window if more than one messages is selected and at least one of them is suppressed:
When one message is selected, the context menu allows you to not only suppress/unsuppress, but also to move the message. When you move the message, it is removed from all suppress files and added to the selected suppress files:
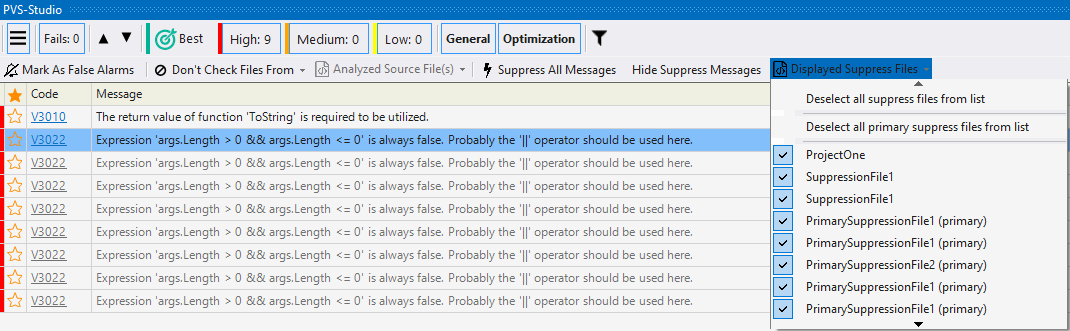
Also, when you select one message in the PVS-Studio Output Window, the drop-down lists of suppress files appear when you hover your mouse over menu items related with suppress files:
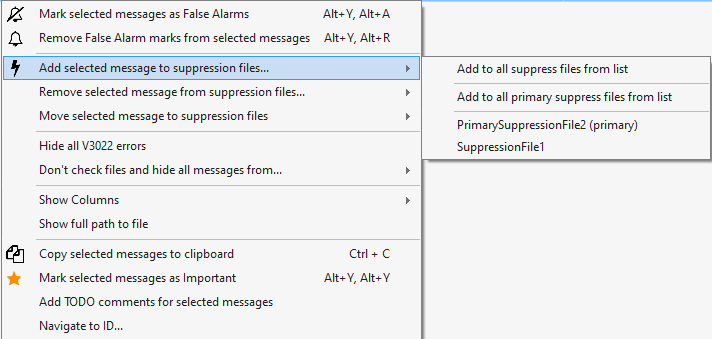
In these drop-down lists you can select one suppress file, all suppress files or all primary suppress files from the list. The selected suppress files will be used when executing the suppress/unsuppress, move command.
You can scroll through the list of suppress files by using the interface items at the top and bottom of the list with arrows, or by using the "Up" and "Down" arrow keys. You can select an item from the list with the "Enter" key or the left mouse button.
Working with suppressed warnings in the plugin for Visual Studio
You can enable the display of suppressed messages from the submenu of the PVS-Studio Output Window:
It is also possible to enable the display of suppressed messages in the window of the file suppression "Extensions -> PVS-Studio -> Suppress Messages...":
In addition, a list of displayed suppress files appears in the submenu of the PVS-Studio output window when suppressed warnings are displayed. By ticking or unticking the boxes in this list, you can enable or disable the display of suppressed messages from specific suppress files:
The changes of displaying of suppressed messages from chosen suppress files is applied when the list of displayed suppress closes.
You can scroll through the list of displayed suppress files by using the interface items at the top and bottom of the list with arrows, or by using the "Up" and "Down" arrow keys. You can select an item from the list with the "Enter" key or the left mouse button.
Adding suppress files to MSBuild \ Visual Studio projects
You can add a suppress file to a project as an uncompiled\text file using the 'Add New Item...' or 'Add Existing Item...' menu commands. This enables you to keep suppress files and project files in different directories. You can add multiple suppress files to the project.
Adding suppress files to Visual Studio solution
You can add a suppress file to the solution via the 'Solution Explorer' using the 'Add New Item...' or 'Add Existing Item...' menu command. As with projects, adding multiple suppress files is also supported for solutions.
Suppress file of the solution level allows suppressing warnings in all projects of the corresponding solution. If projects have separate suppress files, the analyzer will take into account both warnings suppressed in a suppress file of the solution, and in a suppress file of a project.
Suppressing of analyzer warnings from a command line
Suppressing all analyzer warnings
Warnings suppression can also be used right from a command line. The command-line PVS-Studio_Cmd.exe utility automatically catches up existing suppress files when running an analysis. It can also be used to suppress previously generated analyzer warnings saved in a plog file. To suppress warnings from an existing plog file, run PVS-Studio_Cmd.exe with the '--suppressAll' flag. For example (in one line):
"C:\Program Files (x86)\PVS-Studio\PVS-Studio_Cmd.exe"
-t "Solution.sln" -o "results.plog" --suppressAll SuppressOnly
Execution of this command will generate suppress files for all of the projects in the Solution.sln for which warnings in results.plog have been generated.
The '--suppressAll' flag supports 2 modes:
- AnalyzeAndSuppress will first perform the analysis, write an output file (.plog, .json), and only after that it will suppress all the warnings from it. In this mode, you'll see only new analyzer warnings on every analysis run thereafter (warnings from previous runs will be suppressed).
- SuppressOnly will suppress all warnings for the given analyzer report without restarting the analysis.
You can also use the -u argument to specify the path to the suppress file. This suppress file will be created if it does not already exist. All analyzer warnings will be added to this suppress file.
Suppressing certain analyzer messages from the command line
PVS-Studio-Cmd.exe has the "suppression" operating mode. It is designed to:
- filter (FilterFromSuppress) warnings from the analyzer's report;
- filter suppressed warnings in suppress files (UpdateSuppressFiles);
- calculate statistics for suppress files (CountSuppressedMessages);
- suppress and unsuppress messages from the analyzer's report.
In this mode, like in the main PVS-Studio-Cmd.exe mode, you can pass paths to suppress files using -u flag. These suppress files will be used on the level with suppress files of projects and solutions.
In the "suppression" mode in PVS-Studio_Cmd.exe, you can specify the operating mode via the -m flag:
- CreateEmptySuppressFiles creates empty suppress files next to project files (.csproj/.vcxproj) by the specified pattern of the file name (--suppressFilePattern flag). If the flag of the pattern is omitted, empty suppress files are created with the project name. This mode takes into account the flag marking suppress files with the primary tag (--markAsPrimary).
- Suppress allows suppression of individual warnings from the analyzer's report file (--analyzerReport). The suppressed warnings from the analyzer report are selected using filters: groups (--groups), diagnostic codes (--errorCodes), paths to source code directories or paths to source code files (you may specify just source code file names). The order in which the filters are applied is: groups, diagnostic codes, paths. If no filter is specified, all warnings from the passed analyzer report (--analyzerReport) are suppressed. If a suppress file name pattern (--suppressFilePattern) is specified, messages are only suppressed into suppress files whose names match the specified suppress file name pattern (suppress file will be created if it does not exist). This mode takes into account the flag marking suppress files with the primary tag (--markAsPrimary).
- UnSuppress mode unsuppresses warnings from the passed analyzer report. UnSuppress is similar to Suppress mode in terms of the flags used, except for the --markAsPrimary flag. It is not used in this mode;
- FilterFromSuppress filters the messages in the existing report file (.plog, .json, or unparsed output of the C++ core) without running the analysis. This mode filters the messages using suppress files located next to project/solution files. Another option: pass the path to the suppress files using the –useSuppressFile (-u) flag. The file with results is saved next to the report file passed. The file is named with postfix '_filtered'.
- CountSuppressedMessages calculates the number of suppressed warnings in all suppress files. This mode can also calculate the number of relevant warnings in suppress files. If you pass the full report file (via the --analyzerReport flag), you can see how many warnings in the suppress base are still relevant. You can also learn statistics for each suppress file if you run this mode with the '-r' flag.
- UpdateSuppressFiles updates suppress files and deletes the warnings that are not included in the report file passed. Please note that this mode requires a full report containing suppressed warnings. A full report is created each time the analysis is started if there are suppressed warnings. The full report file is named "*_WithSuppressedMessages.*" and is located next to the main report file. If you run this mode with a report file that doesn't contain suppressed warnings, all suppress files will be cleared.
The CreateEmptySuppressFiles, Suppress, and UnSuppress modes will only use suppress files whose names match the suppress file name pattern (flag -P). This pattern has a variable %projName% which is expanded to the project name.
Marking suppress files as primary (flag -M) only applies to CreateEmptySuppressFiles and Suppress modes.
In Suppress and UnSuppress modes it is possible to specify filters for warnings from the analyzer report via the filter flags:
- --groups (-g): the filter of warnings from the analyzer report (-R) by diagnostic groups (GA, 64, OP, CS, MISRA, AUTOSAR, OWASP) with warning certainty level (1-High, 2-Medium, 3-Low). Example: GA:1,2,3|OWASP|64:2;
- --errorCodes (-E): the filter of warnings from the analyzer report (-R) by the analyzer diagnostic codes. Example: V501,V1001,V3001;
- --files (-f): the filter of warnings from the analyzer report (-R) by absolute/relative paths to directories with source code files, by paths to source code files or by source code file names. Additionally, for each path, it is possible to specify the number of the line to which the message was issued. Example: --files absolute/path/directory*3,8,11|relative/path/file*1|fileName.
Example of command to run PVS-Studio_Cmd.exe in suppression mode:
"C:\Program Files (x86)\PVS-Studio\PVS-Studio_Cmd.exe" suppression
-t "Solution.sln" -R "results.plog" --mode Suppress
-g GA:1,2,3|OWASP:2|64 -E V501,V1001,V3001
-f filename*11,54|absolute/path/filename*1|relative/path/to/directory
-P Prefix_%projName%_Postifx -M
Windows: C and C++ Compiler Monitoring UI
PVS-Studio on Windows can be used not only for MSBuild \ Visual Studio projects. Using compiler monitoring system, you can run static analysis for all types of projects that use one of the compilers supported by PVS-Studio C++.
When running the analysis after build monitoring, using the command
clmonitor.exe analyze --useSuppressFile %PathToSuppressFile%you can pass a path to suppress file that will be used during the analysis, via the additional '--useSuppressFile' (-u) flag.
Besides the command line CLMonitor.exe tool, you can also use compiler monitoring through the C and C++ Compiler Monitoring UI tool. This tool allows you to check code regardless of the used compiler or build system, and then lets you work with the analysis results by providing a user interface similar to the PVS-Studio plugin for Visual Studio.
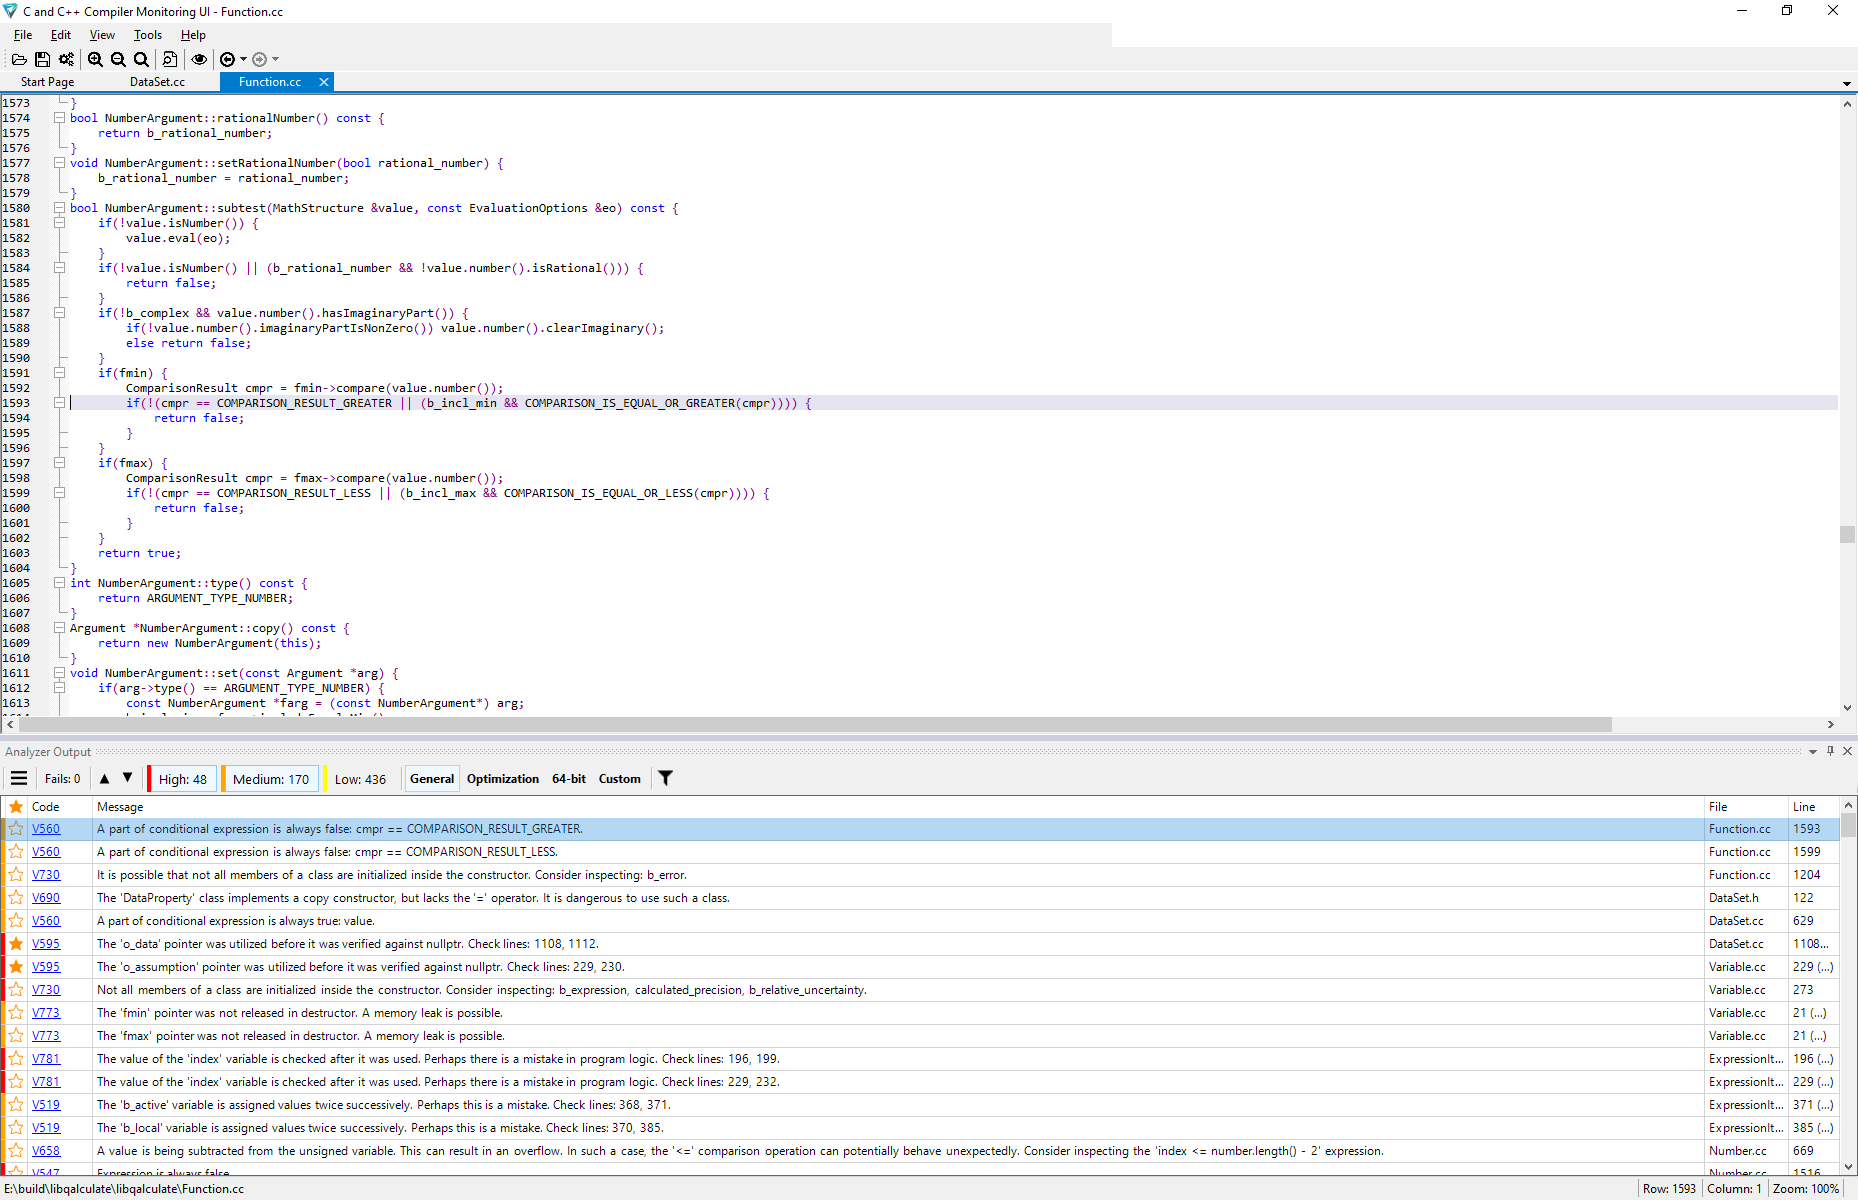
However, if you have a project which can be opened in Visual Studio, we recommend using the PVS-Studio plugin for Visual Studio to view the analysis results. The reason for it is that capabilities of a built-in code editor in Compiler Monitoring UI are far more limited than the code editor of Visual Studio. To open analysis report in Visual Studio, you can save the analyzer report in Compiler Monitoring UI, then reopen it.
The menu for running the analysis and suppressing warnings looks as follows.
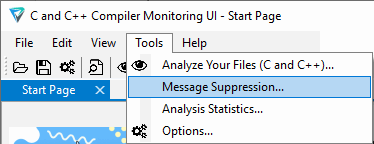
After clicking "Analyze Your Files" menu item, you will see the "Compiler Monitoring (C and C++)" window.
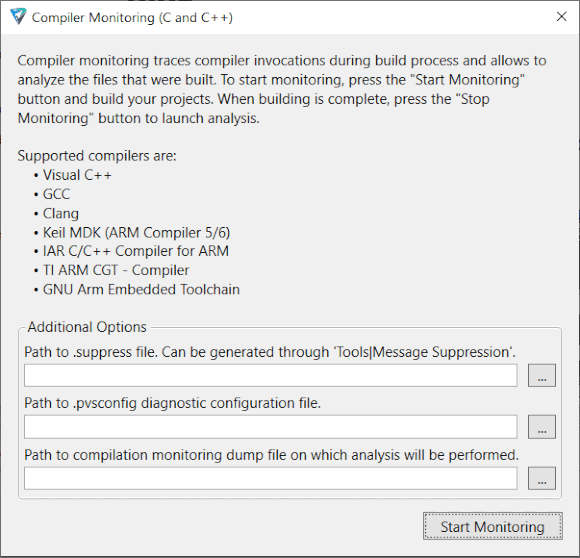
To filter analyzer warnings, you need to specify a file with suppressed warnings before starting the analysis. You can create and maintain such file through the "Message Suppression..." menu, which is the same as the one presented in the section about Visual Studio. After the analysis is finished, only new errors will be shown in the PVS-Studio output window. Without specifying the file, the analyzer will show all the results.
Projects in C and C++ on Linux/macOS
Under Linux and macOS, the commands for suppression and filtration of analyzer warnings can only be performed from the command line. If necessary, this process can be automated on a server that performs an automated analyzer launch. There are several ways of using this mechanism, depending on the way of analyzer integration.
Analysis using pvs-studio-analyzer utility
To suppress all of the analyzer's warnings (first time and in subsequent cases), you need to execute the command:
pvs-studio-analyzer suppress /path/to/report.logIf you want to suppress a warning for a specific file, use the --file(-f) flag:
pvs-studio-analyzer suppress -f test.c /path/to/report.logIn addition to the file itself, you can explicitly specify the line number to suppress:
pvs-studio-analyzer suppress -f test.c:22 /path/to/report.logThis entry suppresses all warnings that are located on line 22 of the 'test.c' file.
This flag can be specified repeatedly, thus suppressing warnings in several files at once.
In addition to explicit file specification, there is a mechanism for suppressing specific diagnostics:
pvs-studio-analyzer suppress -v512 /path/to/report.logThe --warning(-v) flag can also be specified repeatedly:
pvs-studio-analyzer suppress -v1040 -v512 /path/to/report.logThe above-mentioned --file and --warning flags can be combined to suppress warnings more precisely:
pvs-studio-analyzer suppress -f test.c:22 -v512 /path/to/report.logSo the above command will suppress all v512 diagnostic warnings on line 22 of the 'test.c' file.
Analysis of the project can be performed as always. At the same time, the suppressed warnings will be filtered out:
pvs-studio-analyzer analyze ... -o /path/to/report.log
plog-converter ...
This way, the suppressed warnings will be saved in the current directory, in a file named suppress_file.suppress.json, which should be stored with the project. New suppressed warnings will be appended to this file. If there is a need to specify a different name or location of the file, then the commands above may be supplemented by specifying the path to the file with suppressed warnings.
Direct integration of the analyzer into the build system
Direct integration of the analyzer might look like this:
.cpp.o:
  $(CXX) $(CFLAGS) $(DFLAGS) $(INCLUDES) $< -o $@
  pvs-studio --cfg $(CFG_PATH) --source-file $< --language C++
     --cl-params $(CFLAGS) $(DFLAGS) $(INCLUDES) $<
In this integration mode, the C++ analyzer core is called directly, so the analyzer cannot perform analysis on the source files and filter them at the same time. So, filtration and warnings suppression would require additional commands.
To suppress all the warnings, you must run the command:
pvs-studio-analyzer suppress /path/to/report.logTo filter a new analysis log according to the previously generated suppression file, you will need to use the following commands:
pvs-studio-analyzer filter-suppressed /path/to/report.log
plog-converter ...
The default name for the file with the suppressed warnings remains as suppress_file.suppress.json, and can be changed, if necessary.
Java projects under Windows/Linux/macOS
Warnings suppression in IntelliJ IDEA
You can use a special window to view analysis results in IntelliJ IDEA.
This window allows navigating along found warnings and jumping to the source code, to fix these warnings. PVS-Studio window provides a wide range of options for filtering and sorting the results. It is also possible to quickly navigate to the documentation of the selected analyzer rule.
Additional options of working with each warning are available in the context menu by clicking the right button on the warning itself. The command for suppressing a selected warning is also available here.
PVS-Studio plugin for IntelliJ IDEA also allows you to suppress all of the generated messages in one click.
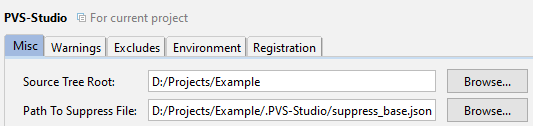
By default, a suppression file is available at {projectPath}/.PVS-Studio/suppress_base.json, but you can change this path in the settings of the plugin.
Whichever suppression method you use, the suppressed warnings will not appear in the subsequent analysis reports.
Suppression of analyzer warnings in Gradle
To suppress all of the warnings, use this command:
./gradlew pvsSuppress "-Ppvsstudio.report=/path/to/report.json"
  "-Ppvsstudio.output=/path/to/suppress_base.json"
Suppression of analyzer warnings in Maven
To suppress all of the warnings, use this command:
mvn pvsstudio:pvsSuppress "-Dpvsstudio.report=/path/to/report.json"
  "-Dpvsstudio.output=/path/to/suppress_base.json"
Direct Integration of the Analyzer in the Build System
To suppress all of the warnings, use this command:
java -jar pvs-studio.jar --convert toSuppress
  --src-convert "/path/to/report.json"
  --dst-convert "/path/to/suppress_base.json"
Suppression of analyzer warnings in Unreal Engine projects
You can read more about baselining in Unreal Engine projects in a separate section "Analysis of Unreal Engine projects".
Suppression of analyzer warnings in the PVS-Studio plugins for CLion and Rider
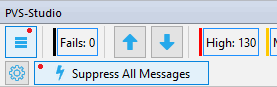
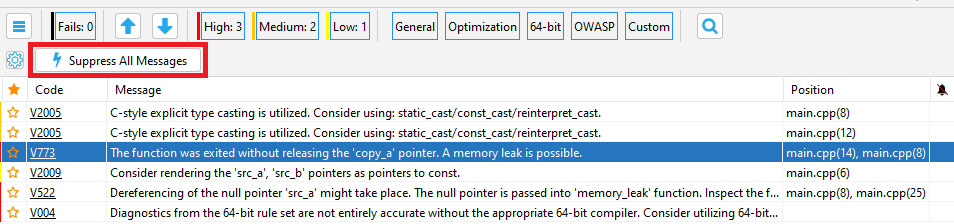
The PVS-Studio plugins for CLion and Rider now can suppress all analyzer warnings. To suppress warnings on the old code, use the 'Suppress All Messages' in the analyzer toolbar:
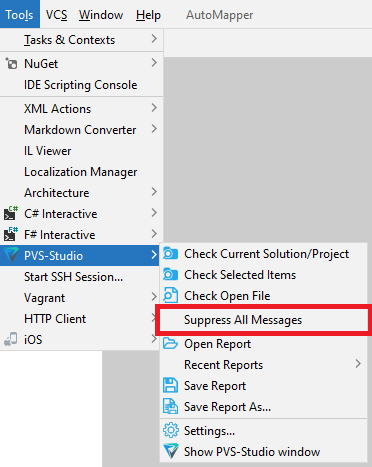
To suppress all warnings in the PVS-Studio plugin for Rider, go 'Tools -> PVS-Studio -> Suppress All Messages':
The suppression mechanism works via* .suppress files. After the analyzer runs the 'Suppress All Messages' command, the suppressed analyzer messages are added to this file. At the next start of the analysis, all messages from the * .suppress file will not be included in the analyzer report. The suppression system with * .suppress files is flexible enough and is able to "track" suppressed messages even if you modify and shift the code fragments that triggered the analyzer.
When you work with Rider, * .suppress files are created at the project level, next to each project file. However, they can be added to any project/solution (for example, use one * .suppress file for several projects or the whole solution). To return suppressed analyzer messages, you need to delete the * .suppress files for the corresponding projects and restart the analysis.
In CLion, suppressed messages are added to the suppress_file.suppress.json file. This file is written to the .PVS-Studio directory, which is located in the root directory of the CLion project. To return all analyzer messages, you must delete this file and restart the analysis.
Version control system
Starting with PVS-Studio 7.27, the inner content of suppress files is sorted. This is required for proper use of files in the version control system and to prevent merge conflicts.
Messages are sorted in the following order: source file name, diagnostic rule code, string hash, diagnostic rule description.
Suppression of analyzer warnings in SonarQube
SonarQube (formerly Sonar) is an open source platform designed for continuous inspection and measurement of code quality. SonarQube combines the results of the analysis to a single dashboard, keeping track of the history of previous analysis runs, which allows you to see the overall trend of software quality during development. An additional advantage is the ability to combine results of different analyzers.
So, after getting the analysis results from one or more analyzers, you should go to the list of warnings and click the "Bulk Change" button, which opens the following menu.
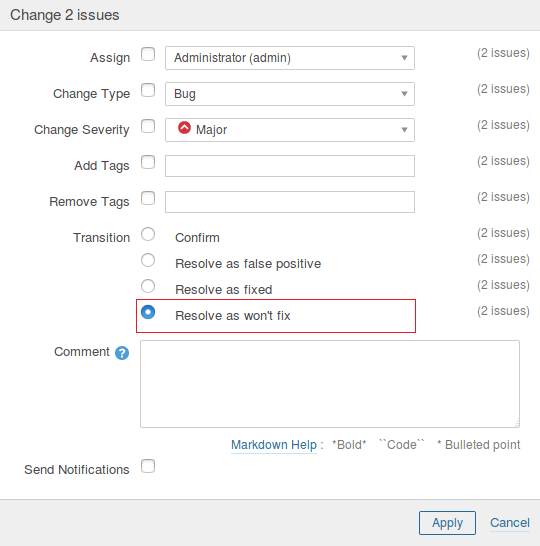
In this window, you can mark up all warnings of the analyzer as "won't fix" and further work only with new errors.
Shared use of the baselining features for projects in CI instruments and IDEs
You can quickly integrate PVS-Studio into a new project, configure its automatic daily check in CI and at the same time gradually deal with suppressed warnings in IDEs.
It looks like this:
- After integrating PVS-Studio into your project, you get the first report from the analyzer.
- Next, suppress all warnings via PVS-Studio_Cmd.exe in the SuppressOnly mode or via the PVS-Studio plugins for IDEs. As a result, you'll get a suppress file which will further be used to filter warnings from the analyzer reports.
- Commit this suppress file to a version control system or save in any way suitable for you.
- Next, configure a task in CI. This task runs the project analysis and filters warnings from the resulting report. The filter uses the previously obtained suppress file. PVS-Studio_Cmd.exe in the FilterFromSuppress mode filters the messages. After the task is completed, you get a report with warnings issued only for new or changed code.
- After that the report is sent to the team members via the BlameNotifier.exe utility;
- Each team member corrects the code based on the received report.
- Your team can also return to the suppressed messages and gradually fix the legacy code. This requires enabling the display of the suppressed warnings in the IDE. After a warning is processed, delete it from the suppress file and commit the change. Thus, this warning won't bother you when you use this suppress file to filter subsequent reports.
- Besides deleting, you can also add new warnings to the suppress file. Access this feature in the interface of the PVS-Studio plugin for Visual Studio or use PVS-Studio_Cmd.exe in SuppressOnly mode. Just specify the path to the previously created suppress file in the '-u' flag. This allows you to set warning processing aside for later (which I do not advise abusing), and configure the report so as to contain only the necessary warnings.
What can I do after suppressing all warnings?
Configure static analysis on the build server and developers' computers. Regularly correct new analyzer warnings and do not let them accumulate. It is also worth planning a review to correct suppressed warnings in the future.
Additional control over code quality can be achieved by sending results via mail. It is possible to send warnings to only those developers who had written erroneous code using BlameNotifier tool, which is included in PVS-Studio distribution.
For some users it may be convenient to view results in Jenkins or TeamCity using the PVS-Studio plugin, and send a link to such a page.
Additional links
This section describes all the possible ways of suppressing analyzer warnings at the moment. The collected material is based on the documentation for the PVS-Studio analyzer, but the details on that topic were considered more than in documentation. General information may not be very informative for new users, so you should check out the documentation below.
- Viewing analysis results with C and C++ Compiler Monitoring UI;
- How to run PVS-Studio on Linux and macOS
- Integrating PVS-Studio into the continuous integration process;
- Integration of PVS-Studio analysis results into SonarQube;
- Managing the analysis results (.plog file).
Was this page helpful?