
How to use PVS-Studio in JetBrains GoLand
- How to install from the disk
- How to install PVS-Studio
- How to enter a license
- How to configure a plugin
- How to analyze the project using PVS-Studio
- How to handle analysis results
PVS-Studio analyzer can be used with the JetBrains GoLand IDE. PVS-Studio IDE plugin provides a user-friendly interface for running analysis on Go projects and individual files, as well as for handling the analyzer's warnings.
During the Early Access Program (EAP), the plugin is available for download only from our website.
How to install from the disk
To install PVS-Studio plugin from the downloaded installation archive, open the settings window: File > Settings > Plugins, click the gear icon, and select Install Plugin from Disk.

In the Installed section, PVS-Studio for GoLand will be displayed.
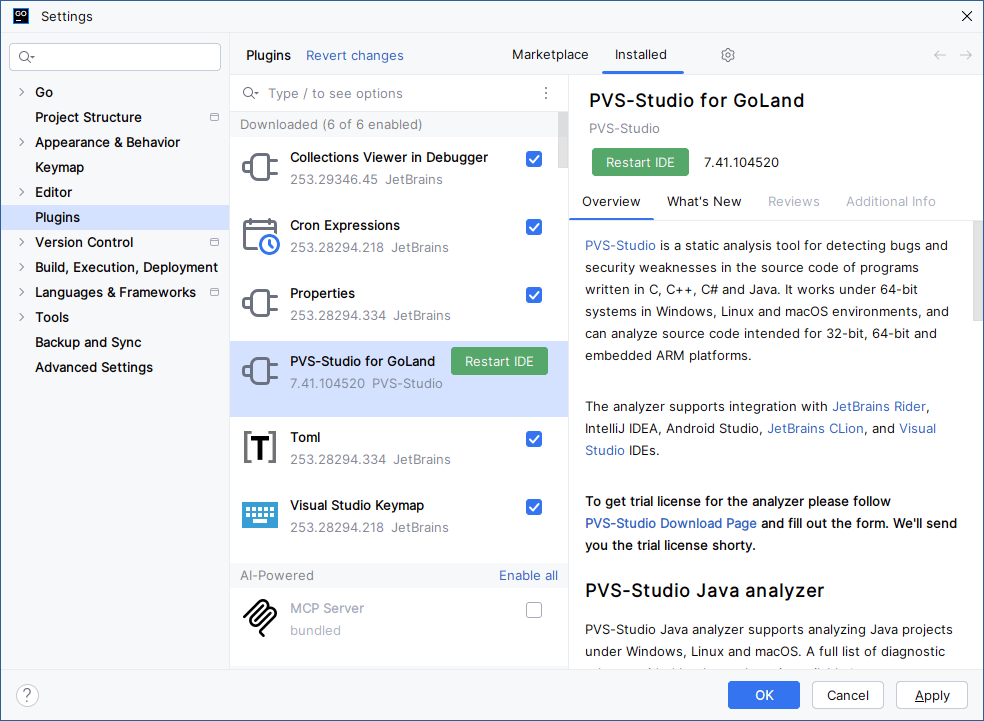
To apply the changes, click Restart IDE. After restarting the IDE, PVS-Studio plugin will be ready to use.
How to install PVS-Studio
To use PVS-Studio analyzer in JetBrains GoLand, install the IDE plugin, as well as the analyzer core and its dependencies.
If the plugin is installed via the PVS-Studio installer on Windows, all the necessary components will be automatically installed and the step can be skipped.
If the plugin was installed separately, download and install PVS-Studio for the required platform. The C++ compiler components are also required to be installed.
How to enter a license
For detailed information on how to enter a license in GoLand, please refer to the documentation.
How to configure a plugin
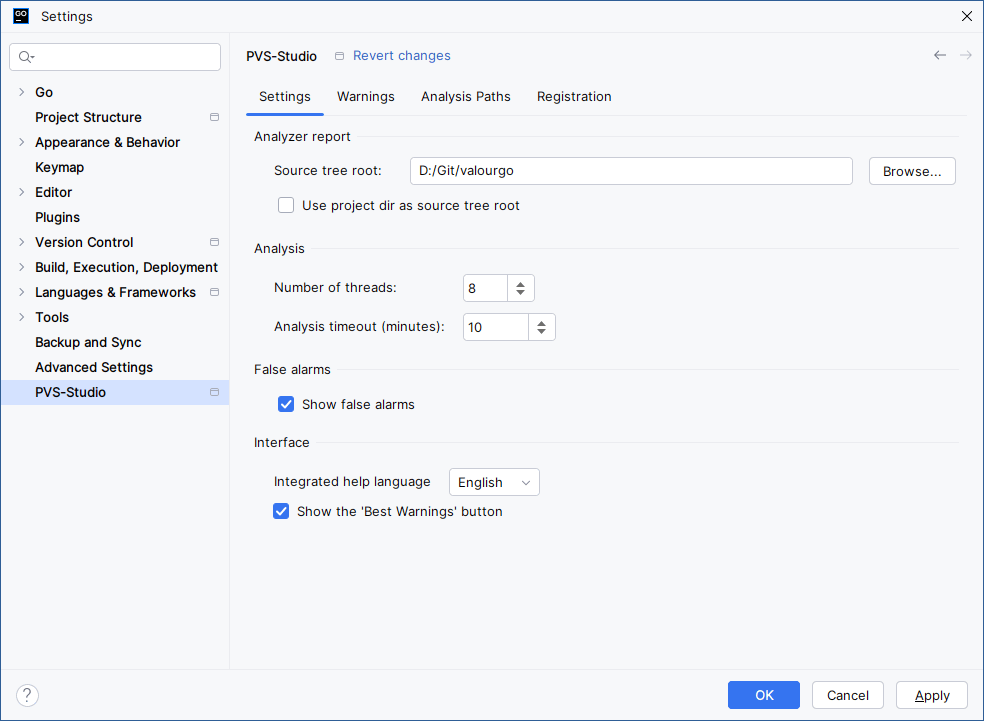
The plugin's settings panel includes several tabs.
Settings contains settings of PVS-Studio analyzer core. To display the settings description, hover the mouse over a setting's name.
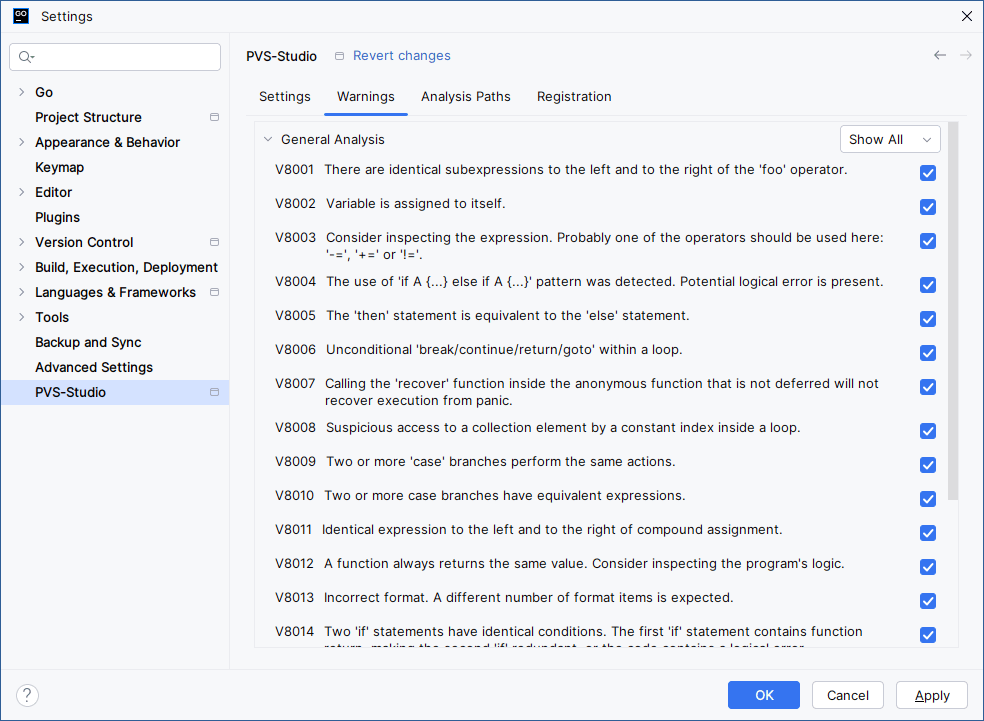
Warnings contains a list of all supported warning types. If you uncheck the warning, all warnings of this type will be filtered out of the results table.
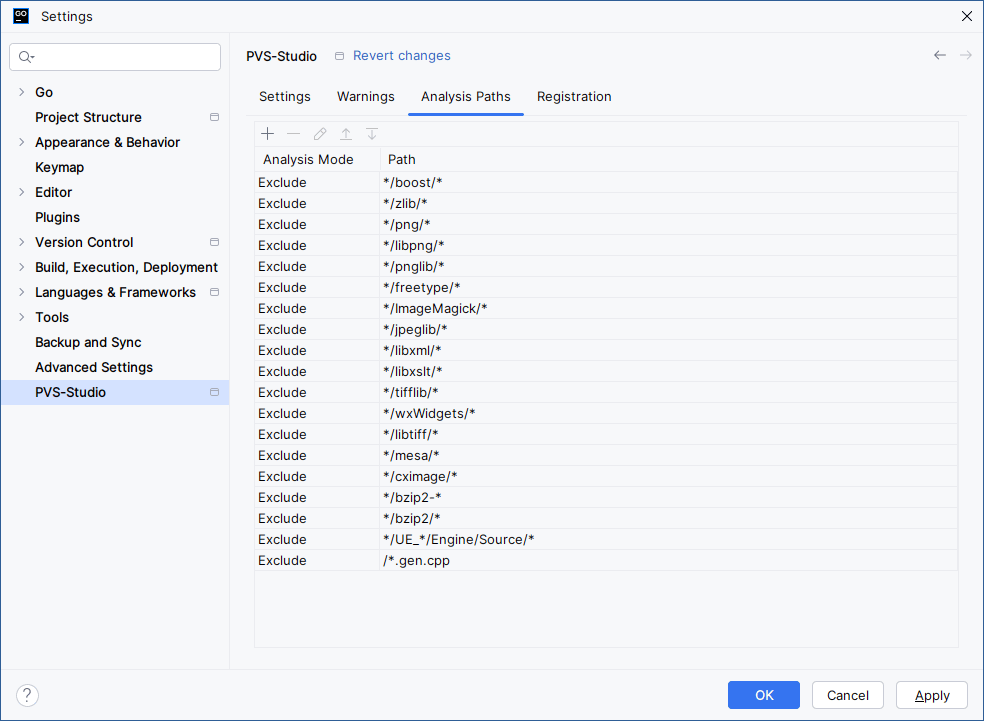
Analysis Paths contains patterns for file names and paths that will be additionally included or excluded from the analysis.
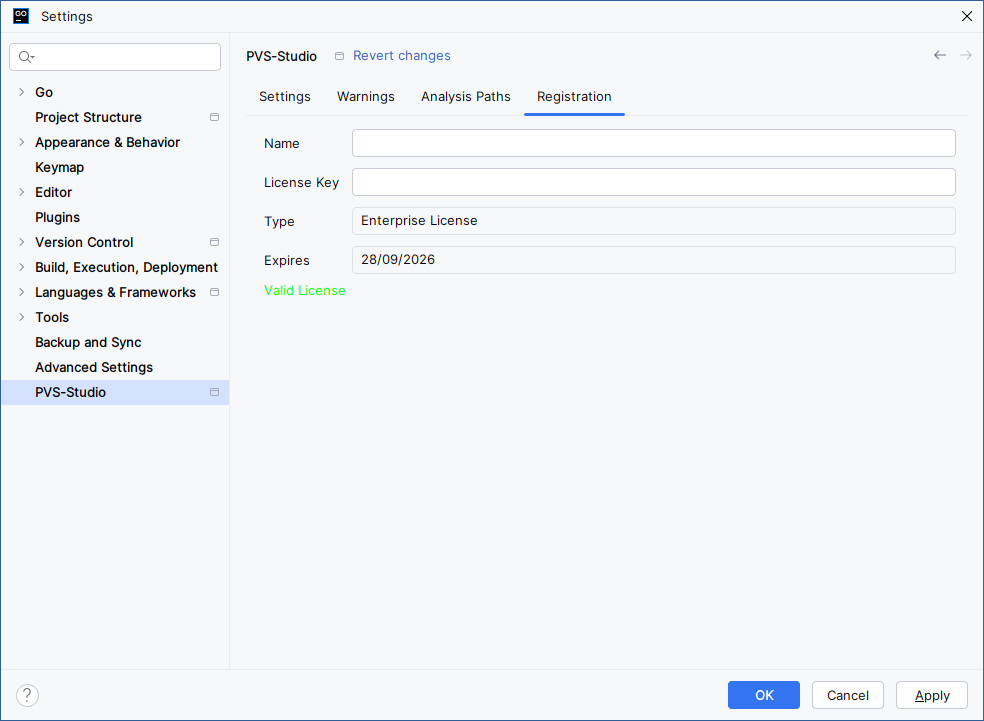
Registration: contains information about the current license.
How to analyze the project using PVS-Studio
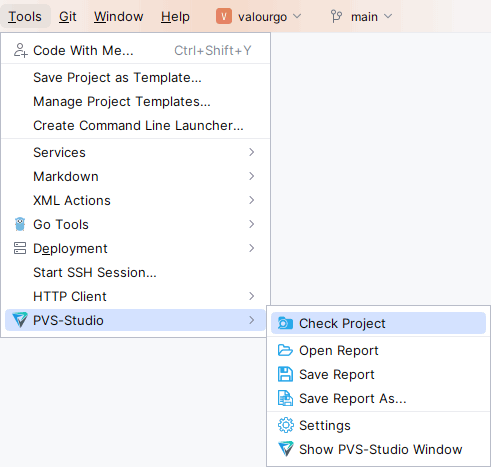
To analyze the current project, go to Tools > PVS-Studio > Check Project.
How to handle analysis results
During the analysis, the table displays results in the PVS-Studio window. You can sort the entries in the table by any of them. To change the sort order, click the column header.

The table consists of seven columns (from left to right):
- Favorite marks the warning to ease its find.
- Code and CWE open a browser page that contains detailed descriptions of a warning or potential vulnerability.
- SAST displays the compliance status of warnings according to various safety or security standards, such as SEI CERT, MISRA, AUTOSAR, etc.
- Message contains a brief warning description.
- Position contains a list of files related to the message.
- False Alarms displays messages marked as false positives. The relevant subsection provides more details on handling false positives.
Double-click a row in the table to open the file at the line where the analyzer issued the warning:
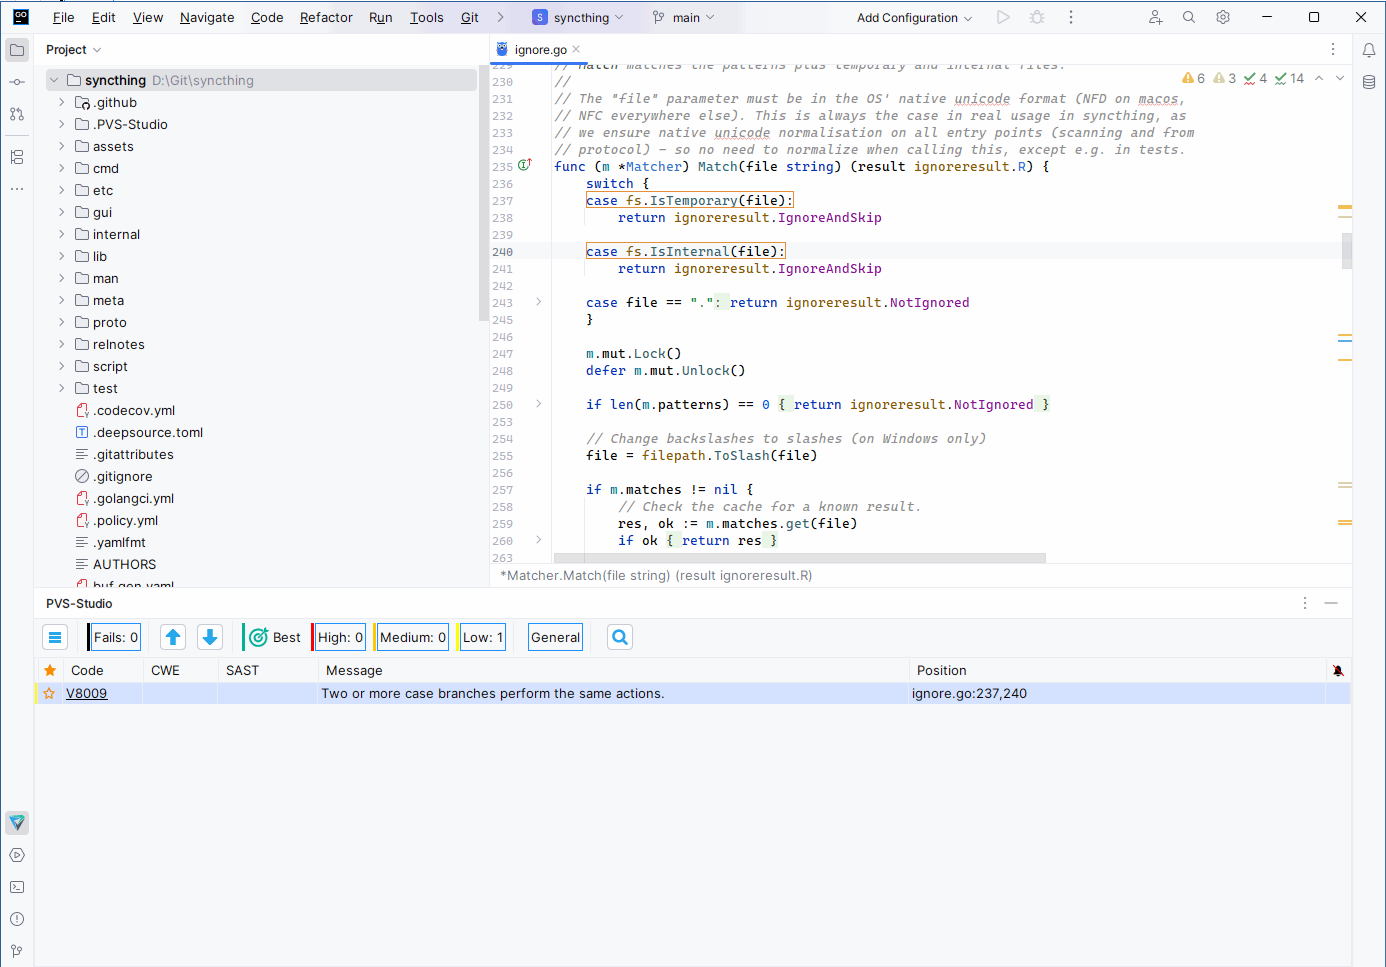
Above the table, arrow buttons allow switching to the previous (Alt + [) or next (Alt + ]) analyzer message and opening the file in the code editor.
There are also filters for warning certainty levels: High, Medium, Low, and Fails (analyzer errors).
Click the magnifying glass icon to open an additional panel with input fields for the columns: Code, CWE, SAST, Message, and Position. Enter text in these fields to filter the records in the table by the selected field or fields.

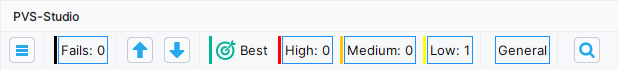
To open the additional settings panel, click the button in the upper-left corner:

To open the plugin main settings window, click the gear icon or go to Tools > PVS-Studio > Settings.
How to view interesting analyzer warnings
If you are just getting started with a static analysis tool and want to evaluate their features, try to use the Best Warnings mechanism. It displays the most important and reliable warnings.
To view them, click the Best button:
How to handle false positives
In some cases, the analyzer may report a warning for a line of code that does not actually contain an error. Such warnings are referred to as false positive.
In PVS-Studio plugin, you can mark an analyzer warning as a false positive. Once marked, these warnings can be hidden in future analysis runs.
To mark false positives, select one or more analyzer messages in the PVS-Studio table, right-click any row, and select Mark Selected Messages as False Alarms from the context menu:

The analyzer adds a special comment to the line for which a warning is issued: //-Vxxx, where xxx is the PVS-Studio diagnostic rule number. You can add a comment to the code manually.
To display false positives marked earlier in the PVS-Studio window table, use the Show False Alarms setting via the Tools > PVS-Studio > Settings menu command:

To remove the false positive mark from selected messages, use the Remove False Alarm Marks From Selected Messages context menu command.
For detailed information on how to suppress issued warnings, as well as information on other suppression methods, please refer to the documentation.
The context menu for the warning table and keyboard shortcuts
To open a context menu that contains additional commands for the selected analyzer messages, right-click a row with the analyzer message in the PVS-Studio window table. To change keyboard shortcuts, go to File > Settings > Keymap menu and enter PVS-Studio in the search field:

- Copy Selected Messages To Clipboard (
Ctrl + C) copies all warnings selected in PVS-Studio plugin's analysis results window to the clipboard. - Mark Selected Messages As Important (
Alt + Y,Alt + Y) marks a warning with a star to ease its find later when sorting by the Favorite column. - Mark Selected Messages As False Alarms (
Alt + Y,Alt + A) marks selected analyzer messages as false alarms by adding a special comment to the code for which the warning was issued (for more details, see the relevant subsection). - Remove False Alarm Marks From Selected Messages (
Alt + Y,Alt + R) removes the false positive marks from the selected analyzer warnings. - Hide All
<diagnostic number>Errors (Alt + Y,Alt + H) hides all warnings with this number. - Exclude From Analysis enables adding a path or part of a path to the file where the analyzer warning was detected to the list of directories excluded from analysis. The filter will exclude from the analysis all files whose paths match the specified paths.
The Show Columns submenu opens a list of column names that can be hidden or displayed.

How to save and load analysis results
To save or download the analyzer results, use the main menu commands in Tools > PVS-Studio:

- Open Report opens the
.jsonreport file and loads its contents into a table in the PVS-Studio window. - Save Report saves all warnings from the table (including filtered ones) to a
.jsonreport file. If the current analysis results have not yet been saved, enter a name and select a location to save the report. - Save Report As saves all warnings from the table (including filtered ones) to the
.jsonreport file and allows selecting a location on the disk where to save the report.
Was this page helpful?