
How to run PVS-Studio in GitLab CI/CD
- How to run PVS-Studio in GitLab CI/CD
- The environment for building and analyzing
- The pipeline
- How to upload analysis results to Code Quality
How to run PVS-Studio in GitLab CI/CD
GitLab is an online repository management service. Users can access it directly in their browser on the official website by registering an account, or they can install and deploy it on their own server.
Note. You can see the integration example provided in the documentation in our demo project on GitLab.
The documentation offers an example of integrating PVS-Studio to analyze a C# project on Linux. The commands for running PVS-Studio to analyze C, C++, or Java code are different. Refer to the corresponding sections of the documentation: "How to Run PVS-Studio on Linux and macOS" and "Direct use of Java analyzer from command line."
When a task is run, GitLab CI takes instructions from the .gitlab-ci.yml file. You can add it by clicking the Set up CI/CD button or by creating it in a local repository and uploading to the website.
The environment for building and analyzing
In GitLab, you can execute CI/CD pipelines both on host machines and in Docker containers. GitLab also enables storing container images in an image registry located directly in the project. We will leverage this feature to illustrate how to use PVS-Studio.
The first step is to create a Dockerfile that describes the process of setting up dependencies for building and analyzing a project. In our case, the example is based on a .NET project:
FROM ubuntu:24.04

RUN apt update && apt install gpg wget software-properties-common -y

RUN add-apt-repository ppa:dotnet/backports && apt install dotnet-sdk-9.0 -y

RUN wget -qO- https://files.pvs-studio.com/etc/pubkey.txt | \
      gpg --dearmor -o /etc/apt/trusted.gpg.d/viva64.gpg \
 && wget -O /etc/apt/sources.list.d/viva64.list \
      https://files.pvs-studio.com/etc/viva64.list \
 && apt update && apt install pvs-studio pvs-studio-dotnet -y
Once you have prepared the Dockerfile, build an image with the appropriate tag and upload it to the project's Registry. The tag must include the Gitlab URL, namespace, and project name.
docker build -t registry.gitlab.com/namespace/name .
docker push registry.gitlab.com/namespace/nameNote. If using a container is not convenient, you can install the analyzer directly in the pipeline.
The pipeline
As mentioned above, the pipeline is executed in the created Docker container. We describe this in the .gitlab-ci.yml file. We also specify that this pipeline is executed during Merge Requests, commits to the main branch, and tag commits. And we need to describe the pipeline stages:
image: registry.gitlab.com/namespace/name

workflow:
  rules:
    - if: $CI_PIPELINE_SOURCE == 'merge_request_event'
    - if: $CI_COMMIT_TAG
    - if: $CI_COMMIT_BRANCH == $CI_DEFAULT_BRANCH

stages:
  - build
  - analyze
Building our demo project is quite easy:
build:
  stage: build
  script:
    - 'dotnet build'
After ensuring that the project compiles, we can analyze it using the PVS-Studio analyzer. The analysis tools are pre-installed in the container. All that is left to do is enter the license, which is stored in the relevant project variables, run the analysis, and convert the report as needed.
analyze:
  stage: analyze
  needs: [build]
  dependencies: []
  script:
    - 'pvs-studio-analyzer \
           credentials $PVS_STUDIO_LICENSE_NAME $PVS_STUDIO_LICENSE_KEY'
    - 'pvs-studio-dotnet -t dotnetcore.csproj -o pvs.json || :'
    - 'plog-converter -t gitlab -a all -o pvs_codequality.json pvs.json'
    - 'plog-converter -t html   -a all -o pvs_report.html      pvs.json'
    - 'plog-converter -t totals -a all -o pvs_metrics.txt      pvs.json'
  artifacts:
    expose_as: 'PVS-Studio report'
    paths: ['pvs_report.html', 'pvs_metrics.txt']
    reports:
      codequality: pvs_codequality.json
Variables are defined in the settings under Settings > CI/CD > Variables.
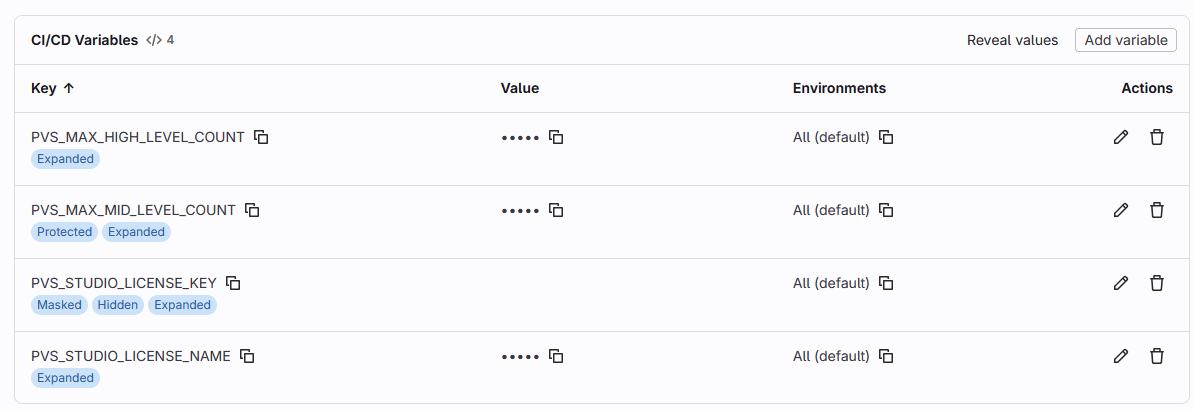
To enter the license, run the pvs-studio-analyzer utility with the credentials flag. The analyzer username associated with the license key and key should be passed there, respectively. You can store these keys in project variables, as shown in our example.
Note how the analyzer (in our case, the pvs-studio-dotnet utility) creates the pvs.json file. This is the analyzer report. You can then convert it to other formats using the plog-converter utility, which is a PVS-Studio report converter. The resulting reports are saved as task artifacts and can be shown later in the Merge Request for implementing Quality Gate. They are also uploaded to Code Quality.
The next step is to use PVS-Studio analysis results as Quality Gate. Quality Gate is a mechanism designed to control project quality via the evaluation of various metrics. In our case, the metric is the number of different warnings contained in the PVS-Studio analyzer reports.
quality_gate:
  stage: analyze
  needs: [analyze]
  dependencies: [analyze]
  script:
    - read PVS_HIGH_LEVEL_COUNT PVS_MID_LEVEL_COUNT \
    < <(grep "Total L1:" pvs_metrics.txt | \
      sed -E 's/.*L1:([0-9]+) \+ L2:([0-9]+).*/\1 \2/')
    - '[ "$PVS_HIGH_LEVEL_COUNT" -gt "$PVS_MAX_HIGH_LEVEL_COUNT" ] && \
    { echo "ERROR: Higl Level warnings number ($PVS_HIGH_LEVEL_COUNT)\
    exceed maximum allowed ($PVS_MAX_HIGH_LEVEL_COUNT)"; exit 1; } || :'
    - '[ "$PVS_MID_LEVEL_COUNT"  -gt "$PVS_MAX_MID_LEVEL_COUNT"  ] && \
    { echo "ERROR: Mid Level warnings number ($PVS_MID_LEVEL_COUNT) \
    exceed maximum allowed ($PVS_MAX_MID_LEVEL_COUNT)"; exit 1; } || :'
We use the pvs_metrics.txt file obtained from the initial PVS-Studio report in the previous step. It contains information about the number of different errors found in the project being checked. In this example, we get the number of High and Medium-level errors, then compare them to predefined threshold values stored in project variables. To implement Quality Gate, it is also recommended to use specialized tools for continuous code quality monitoring, such as SonarQube.
How to upload analysis results to Code Quality
We have already covered the process of uploading a report to Code Quality. We used the plog-converter utility to do this:
plog-converter -t gitlab -a all -o pvs_codequality.json pvs.jsonThis utility creates a report that is uploaded to Code Quality as an artifact:
  artifacts:
    reports:
      codequality: pvs_codequality.json
You can view Code Quality results from the Merge Request window, for example:
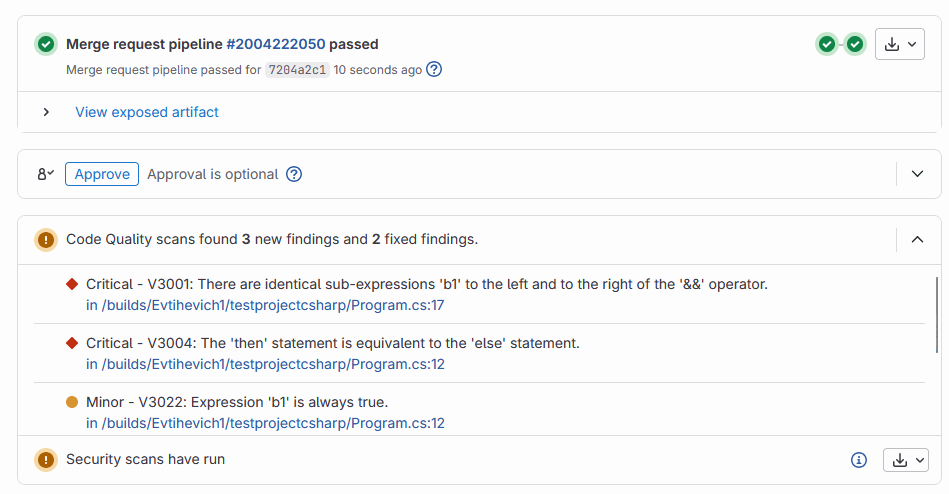
It displays new and fixed analyzer warnings.
You can view a list of all warnings in an HTML report, also created using the plog-converter utility:
plog-converter -t html -a all -o pvs_report.html pvs.jsonYou can then save this report as an artifact and attach it to a Merge Request via expose_as:
artifacts:
  expose_as: 'PVS-Studio report'
  paths: ['pvs_report.html', 'pvs_metrics.txt']
Was this page helpful?