Using PVS-Studio with JetBrains Rider and CLion
- Watch, don't read (YouTube)
- Installing the plugin from the official JetBrains repository
- Installing the plugin from the PVS-Studio repository
- Installing the PVS-Studio analyzer
- Entering a license
- Plugin settings
- Checking code from Rider using PVS-Studio
- Checking code from Rider using PVS-Studio
- Checking code from CLion using PVS-Studio
- Managing analysis results
This documentation page covers the use of PVS-Studio analyzer with Rider IDE and CLion IDE. To analyze projects and individual files, use PVS-Studio plugins that provide a convenient GUI. The plugins also help manage analyzer warnings.
Download and install PVS-Studio plugins for Rider and CLion from the official JetBrains plugin repository or from the repository on our website. You can also use the PVS-Studio installer for Windows, which is available on our download page.
Watch, don't read (YouTube)
Installing the plugin from the official JetBrains repository
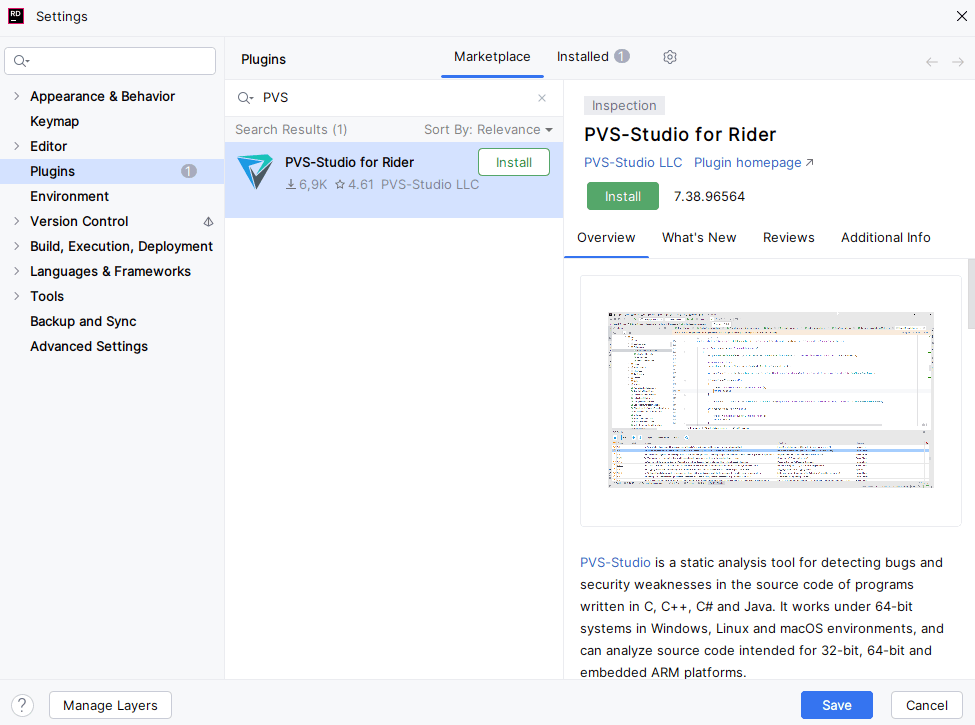
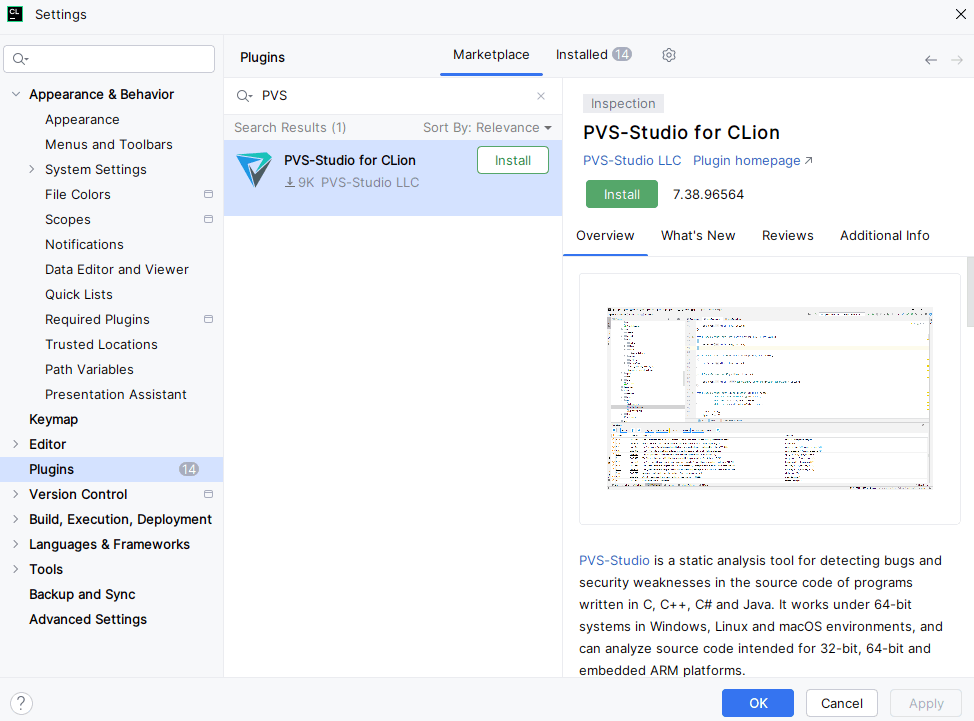
To install PVS-Studio plugin from the official JetBrains repository, open the settings window by clicking File > Settings > Plugins. Then, select the Marketplace tab, and enter PVS-Studio in the search bar. PVS-Studio plugin will appear in the search results:
Installing the plugin in Rider:
Installing the plugin in CLion:
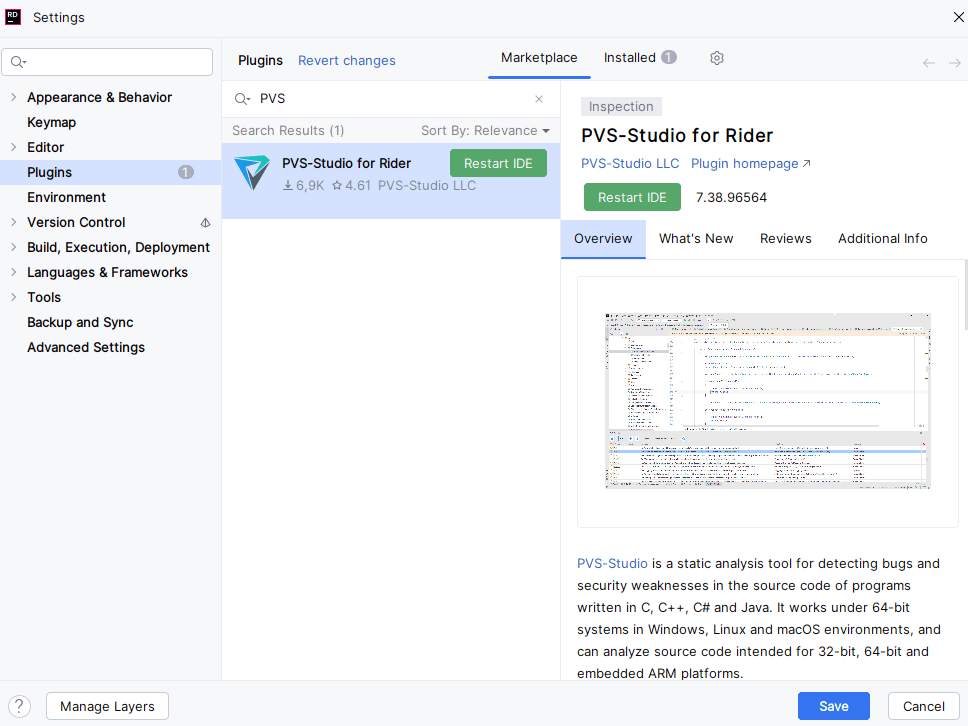
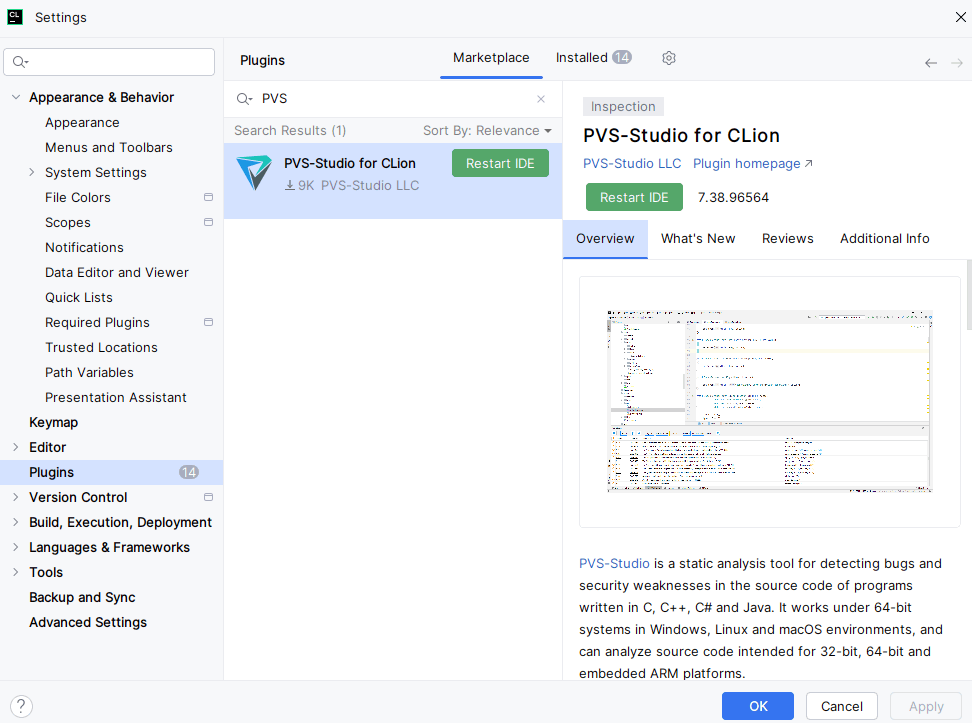
Click Install next to the plugin name. After the installation, click Restart IDE.
In Rider:
In CLion:
After restarting the IDE, PVS-Studio plugin is ready to analyze your code. The next step is to install the PVS-Studio analyzer.
Installing the plugin from the PVS-Studio repository
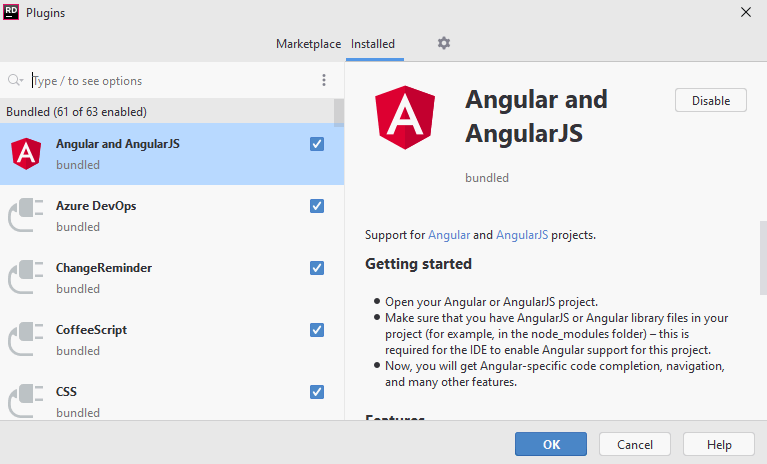
In addition to the official JetBrains repository, PVS-Studio plugin is also available in the PVS-Studio repository. To install the plugin from there, add this repository to the IDE. To do this, click the File > Settings > Plugins command to open the plugin installation window.
For Rider:
For CLion:

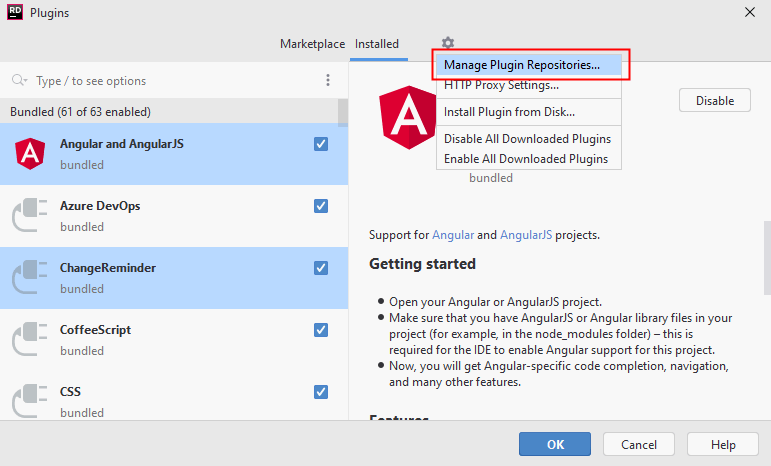
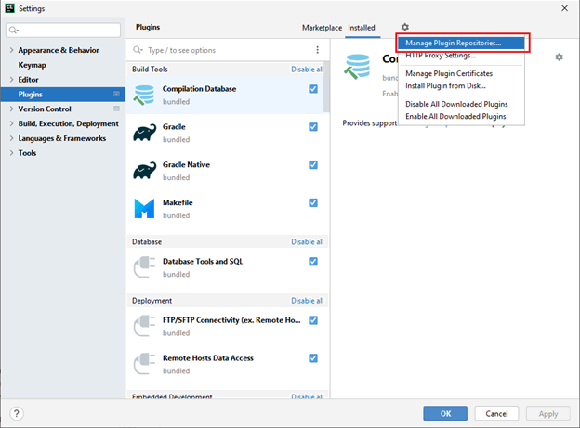
In that window, click the gear icon in the top-right corner and select Manage Plugin Repositories in the drop-down menu.
For Rider:
For CLion:
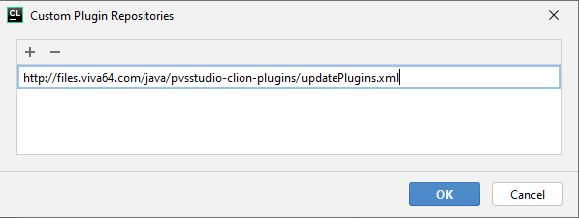
In the opened window, add:
- Rider:
http://files.pvs-studio.com/java/pvsstudio-rider-plugins/updatePlugins.xml; - CLion:
http://files.pvs-studio.com/java/pvsstudio-clion-plugins/updatePlugins.xml.
and click OK.
For Rider:

For CLion:
The final installation step is the same as in the previous scenario of installing the plugin from the official repository: open the Marketplace tab and enter PVS-Studio in the search box. Select PVS-Studio for Rider or PVS-Studio for CLion in the search results, click Install, and restart the IDE.
Installing the PVS-Studio analyzer
To run PVS-Studio in the Rider IDE and CLion IDE, install the analyzer core and its dependencies in addition to the plugin.
If you installed the plugin using the PVS-Studio installer for Windows, then all the required components have already been installed on your system, and you can skip this step.
If you installed the plugin separately (by adding the repository or from the official JetBrains repository), fist download and install the PVS-Studio C++ or C# analyzer core for the relevant platform.
Entering a license
Enter the license after the installation. See the documentation for more information about entering the license in Rider/CLion.
Plugin settings
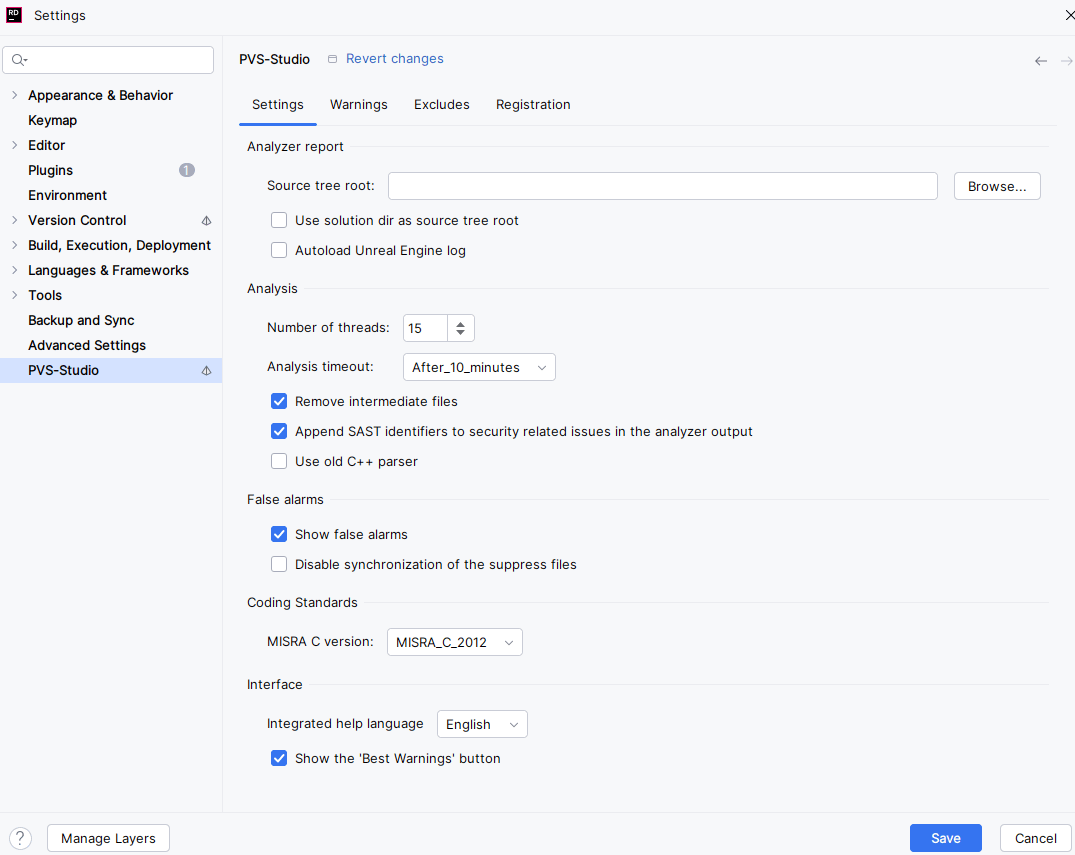
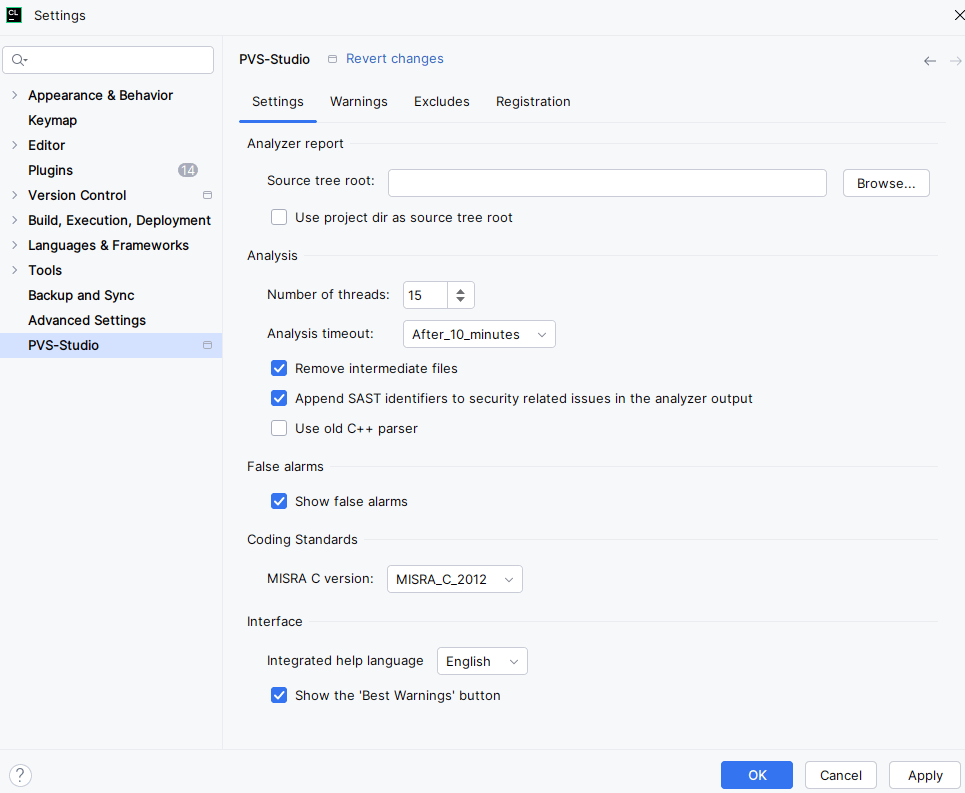
The Settings window of PVS-Studio plugin has multiple tabs. Settings contains settings of the PVS-Studio analyzer core. Hover the cursor over the setting name to see a pop-up tooltip for it.
For Rider:
For CLion:
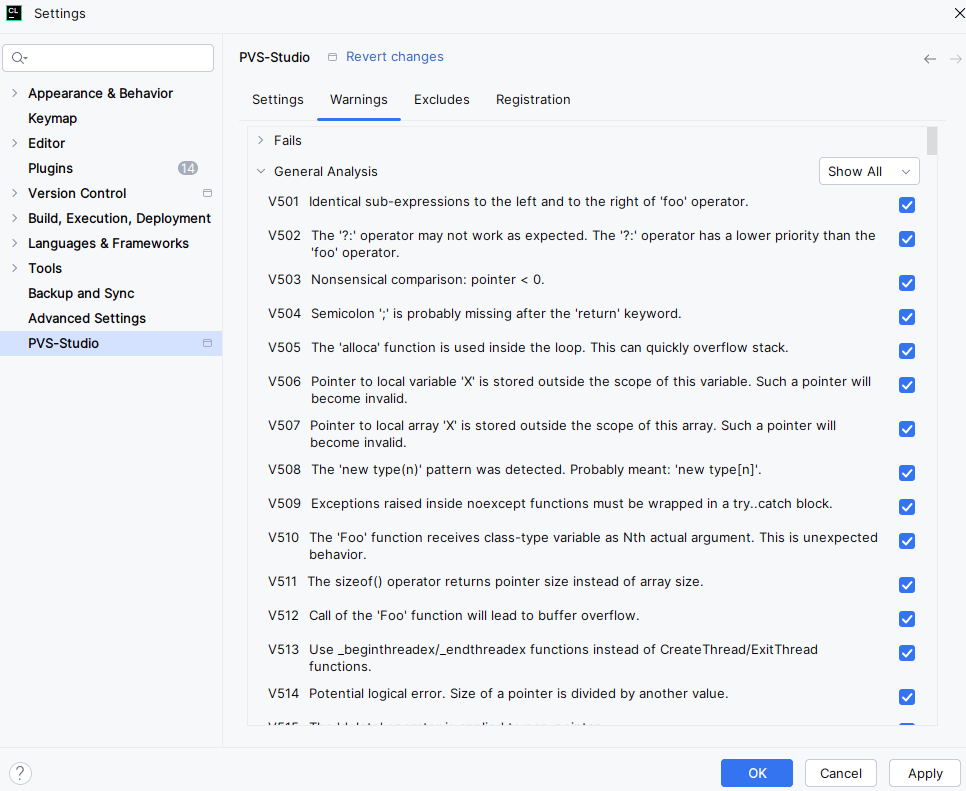
Warnings contains a list of all diagnostic rules supported by the analyzer. Unchecking a diagnostic rule prevents all warnings associated with it from being displayed in the analyzer output window.
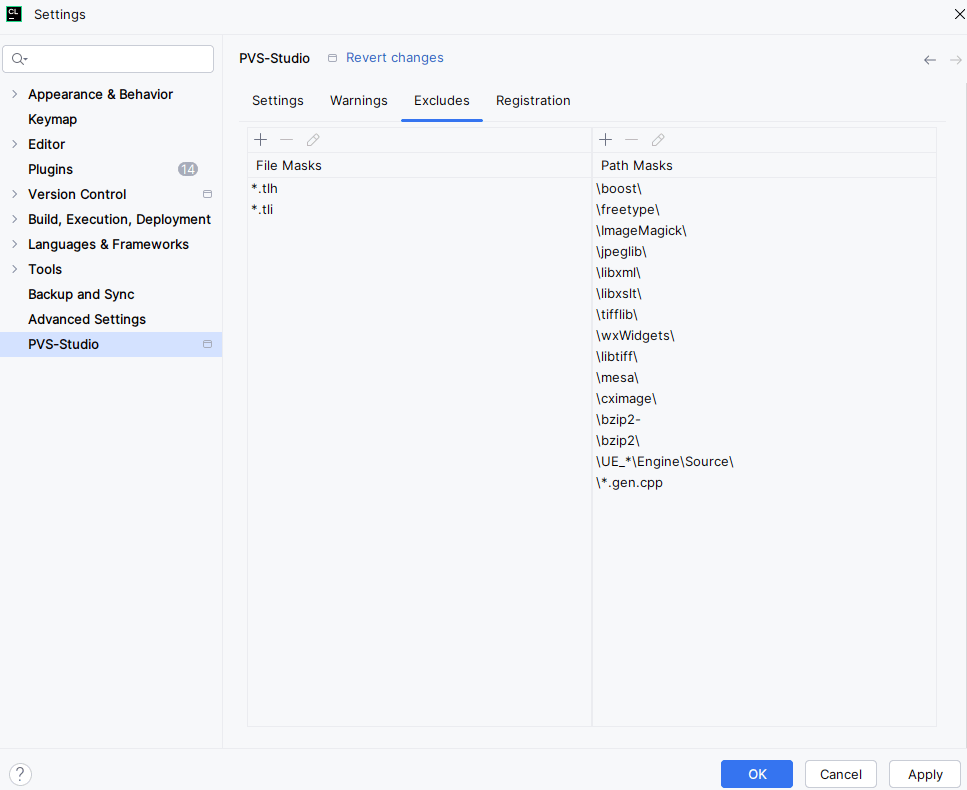
Excludes contains masks for filenames and paths that should be excluded from the analysis.
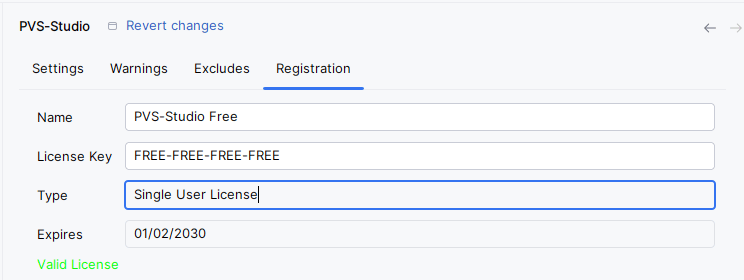
Registration contains information about the current license.
Checking code from Rider using PVS-Studio
JetBrains Rider can open projects in two modes: the project itself or the project source folder. When opening a project, Rider can open both individual .csproj files and a solution file containing one or more project files.
With a project or solution opened, you can check:
- a current project/solution;
- a current project/solution in the intermodular mode;
- items selected in the Explorer window;
- a file currently opened in the code editor.
To analyze the current project or solution, you can use the Tools > PVS-Studio > Check Current Solution/Project menu item. There is also a menu item to run the intermodular analysis. In the intermodular mode, the analyzer performs a deeper analysis of the C and C++ code by increasing the analysis time (the C# analyzer provides intermodular analysis by default):
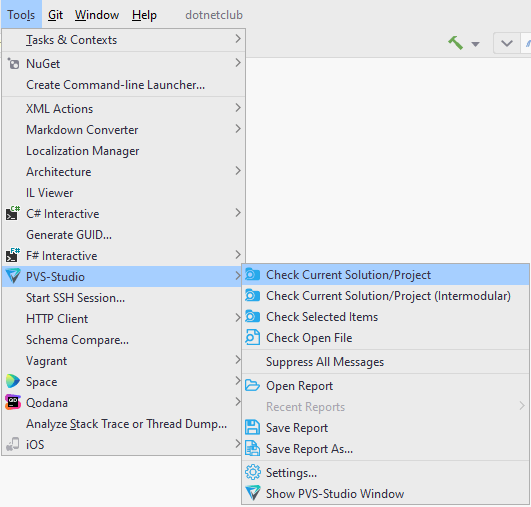
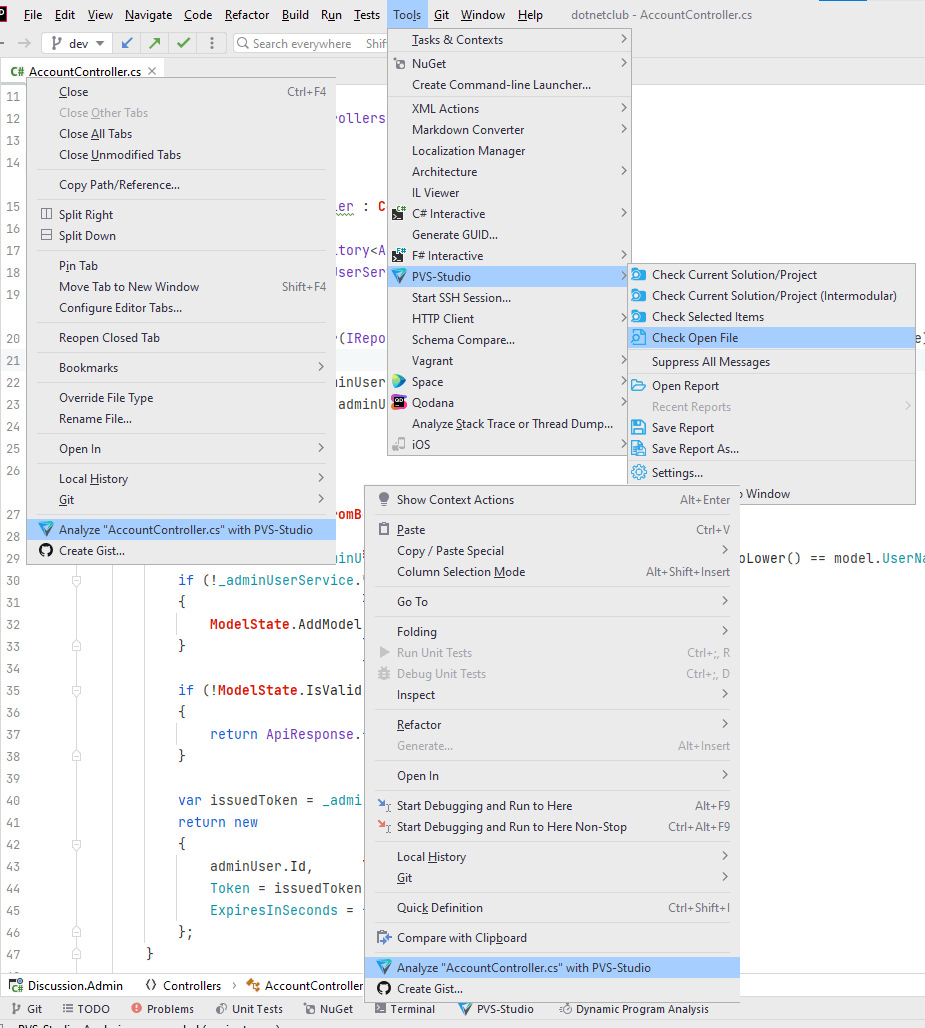
To check a currently opened file, you can use:
- the Tools > PVS-Studio > Check Open File menu item;
- the context menu item of the file;
- the context menu item of the file header in the file editor.
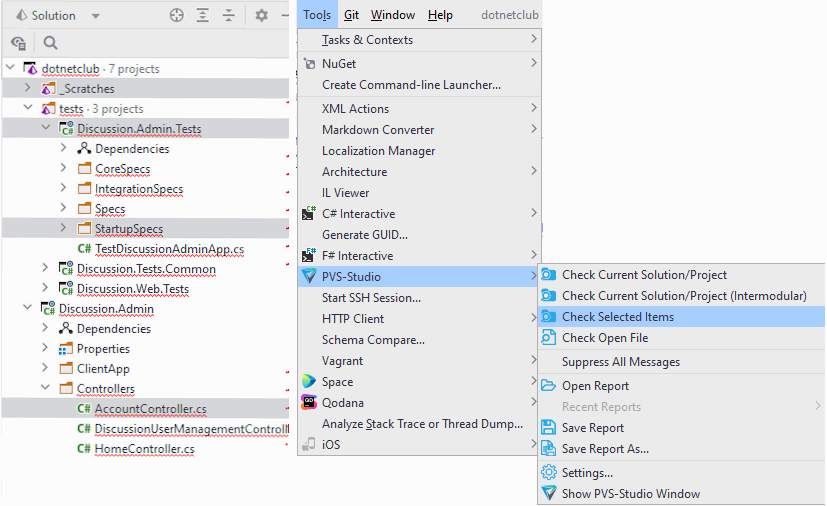
You can also select several items in the Explorer window using the CTRL/SHIFT + mouse Left Click. Then, choose the Tools > PVS-Studio > Check Selected Items command:
Another way to do this is to open the drop-down menu by right-clicking in the Explorer window and selecting the Check Selected Items menu item:

In the examples above, all of the *.cs and *.csproj files from the Core and Controllers folders, as well as the Startup.cs file are analyzed.
When a project folder is opened in Rider, PVS-Studio doesn't know which project, file, or solution exactly should be analyzed, so the Check Current Solution/Project and Check Open File menu items are inactive. The only available option is to check the solution using the Tools > PVS-Studio > Check Selected Items command:
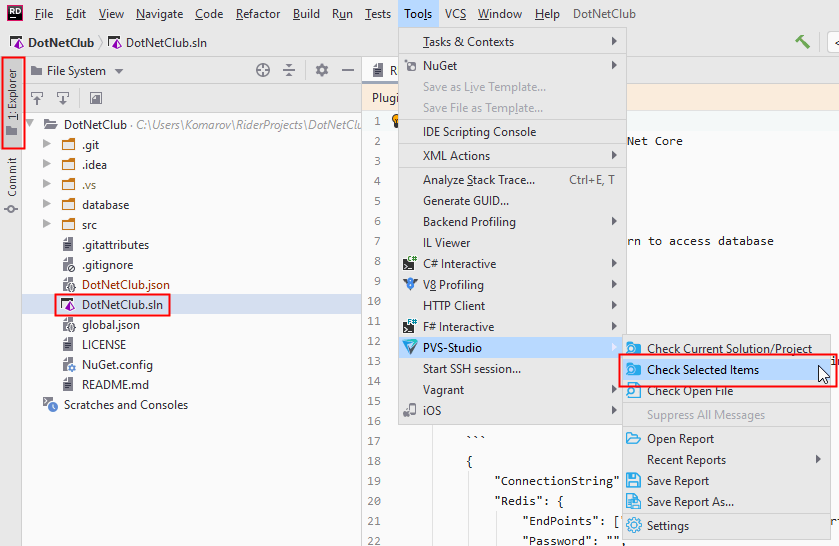
Another way to do this is to open the drop-down menu by right-clicking in the Explorer window and selecting the Check Selected Items menu item.

Checking code from Rider using PVS-Studio
Rider supports Unreal Engine projects. The standard analysis workflow is different from the one described here. See the details in the following documentation.
Checking code from CLion using PVS-Studio
JetBrains CLion supports CMake projects.
You can check:
- a current project;
- a current project in the intermodular mode;
- items selected in the Explorer window;
- a file currently opened in the code editor.
To analyze the current project, you can use the Tools > PVS-Studio > Check Project menu item. There is also a menu item to start the intermodular analysis. In the intermodular mode, the analyzer performs a deeper code analysis by increasing the analysis time:
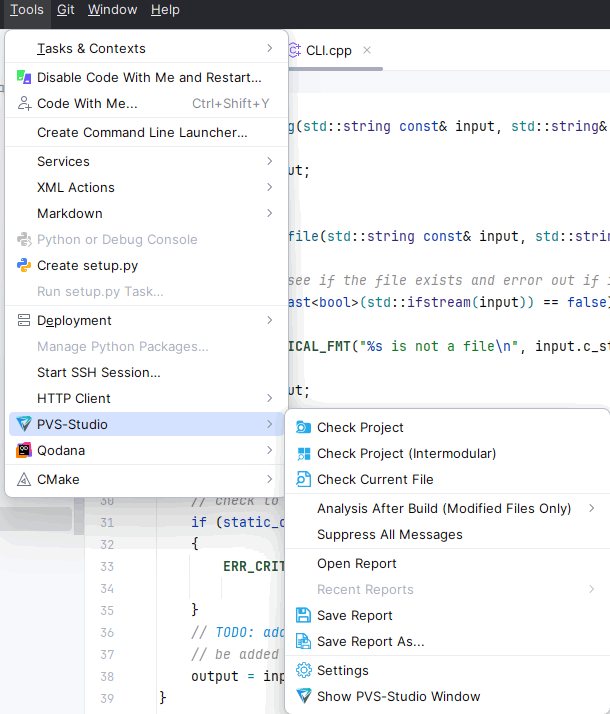
To check a currently opened file, you can use:
- the Tools > PVS-Studio > Check Current File menu item;
- the context menu item of the file;
- the context menu item of the file header in the file editor.

You can also select several items in the Explorer window (CTRL/SHIFT + mouse Left Click) and choose Analyze with PVS-Studio:
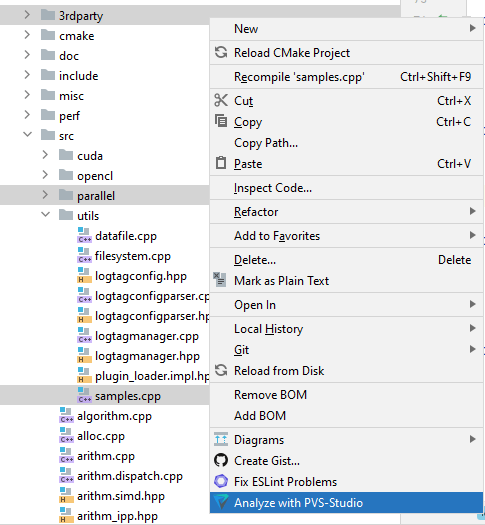
In the examples above, all the *.cpp files from 3rdparty and parallel folders, as well as the samples.cpp file are analyzed.
Managing analysis results
The analysis results issued by PVS-Studio analyzer are displayed in a table within the PVS-Studio window. In Rider:

In CLion:

The table consists of 8 columns arranged from left to right: Favorite, Code, CWE, SAST, Message, Position, Projects, False Alarms. You can sort the analyzer messages by any column. To change the sorting order, click the column heading. The Favorite column on the far left is used to bookmark warnings If you enable sorting by the Favorite column, you can quickly find all marked warnings.
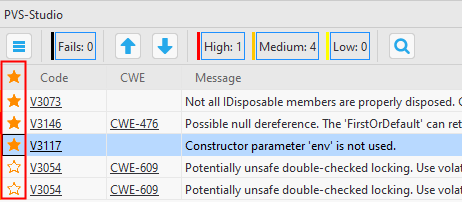
Clicking a warning in the Code/CWE columns opens a webpage in your browser providing a detailed description of the warning or potential vulnerability. The Message column provides brief descriptions of the warnings. The Position column contains a list of files the warning refers to. The Projects column is a list of projects containing the file the warning refers to. The False Alarms column contains warnings marked as false positives. You can find more details on managing false positives in the relevant section.
Double clicking a table row opens the file at the line that triggered the analyzer:
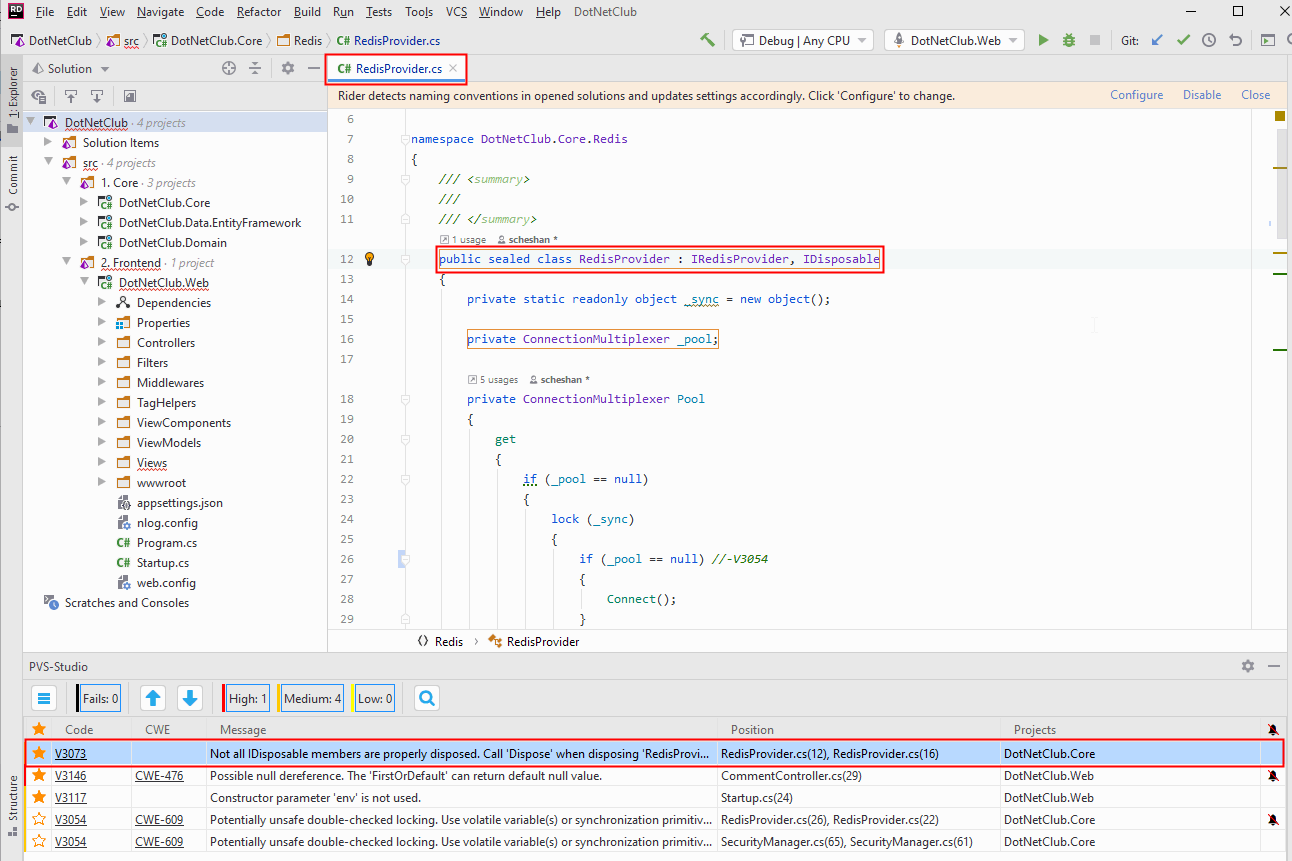
There are also two arrow buttons above the table. You can use them to move between the warnings and open the associated files in the source code editor. To the right of the arrow buttons, you can set filters by the warning level: High, Medium, and Low. The Fails filter contains errors of the analyzer.
When clicking the search icon, an additional panel opens with text fields for searching across the Code, CWE, Message, and Position columns. Each field is a string filter that enables you to filter the messages by the text you have entered.

The button with three horizontal lines across it is in the top-left corner above the table. Clicking it opens an additional settings panel:

Clicking the gear icon opens the plugin settings main window, which is also available at Tools > PVS-Studio > Settings.
Viewing the most interesting analyzer warnings
If you are new to the static analysis tool and would like to learn about its capabilities, you can use the Best Warnings mechanism. This mechanism shows the most important and reliable warnings.
To view the most interesting analyzer warnings, click the Best button, as shown in the screenshot below:
When the analysis is complete, the result table will display a list of ten most critical warnings.
Managing false positives
In some cases, the analyzer may issue a warning for a section of code that does not contain any errors. Such a warning is called a false positive.
PVS-Studio plugin allows you to mark the analyzer warnings as false positives to prevent them from appearing in future checks.
To mark false positives, select one or more warnings in the PVS-Studio table, right-click any row to open the drop-down menu, and select the Mark selected messages as False Alarms command:

The analyzer will add the special \\-Vxxx comment (xxxx is the PVS-Studio diagnostic rule number) to the line where the analyzer issues a warning. You can also add such comments manually.
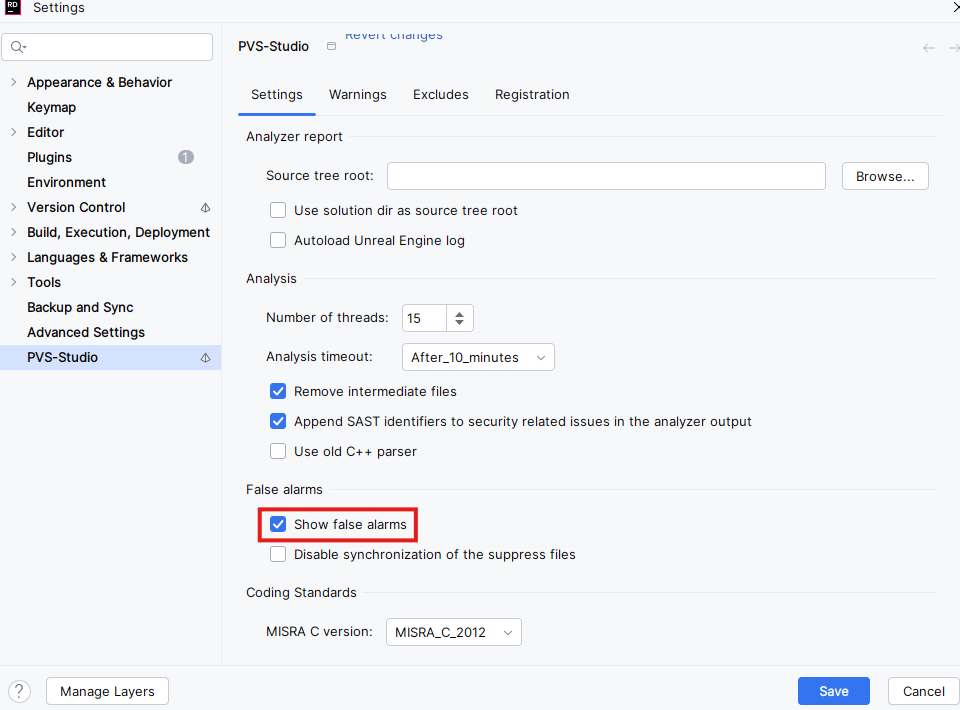
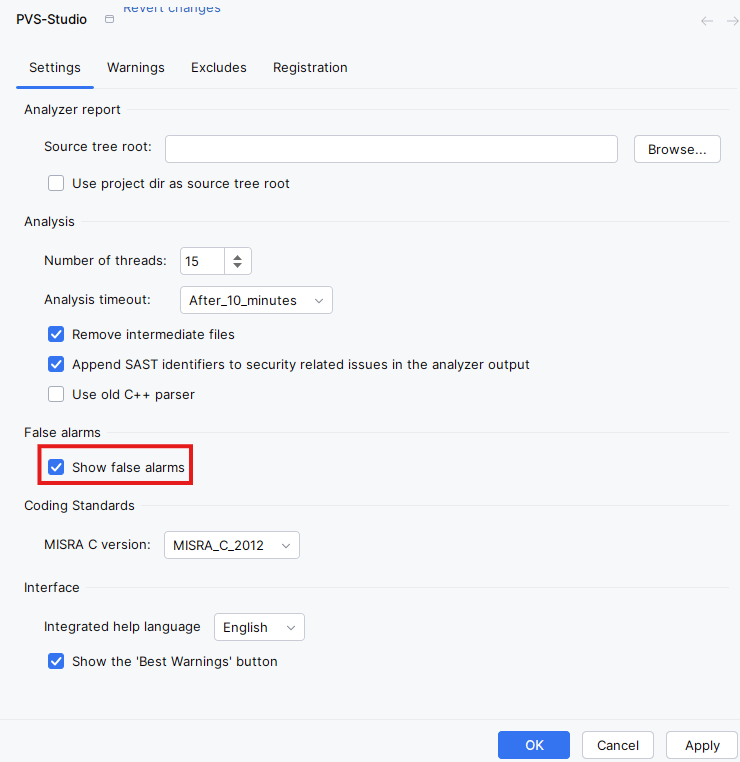
To display warnings previously marked as false positives in the table, click Tools > PVS-Studio > Settings and enable Show False Alarms: In Rider:
In CLion:
Use the Remove False Alarm marks from selected messages drop-down menu item to unmark selected warnings as false positives.
To learn more about suppressing warnings issued by the analyzer and other ways of suppressing warnings using configuration files (.pvsconfig) added to the project, see the Suppression of False Alarms documentation section.
Suppressing analyzer warnings in legacy code
Warnings issued for legacy code often interfere with regular static analysis and the viewing of warnings for new or under-development code.
To resolve this issue, PVS-Studio analyzer has a feature to disable warnings for old code. To do this, you can use the Tools > PVS-Studio > Suppress All Messages command in the main menu or the Suppress All Messages button on the PVS-Studio window panel. The suppression mechanism uses a special suppress file. Suppressed analyzer warnings are added to the file after the Suppress All Messages command is executed. During the next analysis run, any warnings added to the suppress file will be excluded from the report.
In Rider, the *.suppress files are created at the project level, in the same directory where the project file is stored, but you can also add them to any project or solution (for example, if you want to use one suppress file for several projects or an entire solution). To get those warnings back in the report, delete the suppress files associated with the affected projects and restart the analysis.
In CLion, suppressed warnings are added in the suppress_file.suppress.json file, which is written in the .PVS-Studio directory, in the root directory of project opened in CLion. To get those warnings back in the analyzer report, delete this file and run the analysis again.
To learn more about warning suppression and to see the guide on handling *.suppress files, see the Mass suppression of analyzer warnings documentation section.
You can also read the "How to introduce a static code analyzer in a legacy project and not to discourage the team" article.
The dropdown menu of the warning table
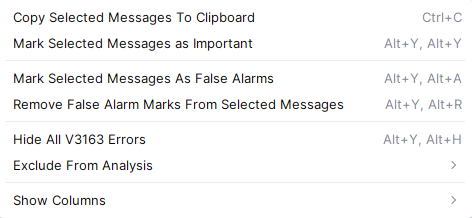
Right-clicking a warning in the PVS-Studio window table opens a drop-down menu, which contains additional items for managing selected warnings.
The Copy Selected Messages To Clipboard command copies all selected warnings in the PVS-Studio plugin analysis results window to the clipboard.
The Mark Selected Messages As Important command marks the warning with a star. This makes it easier to find the warning later when sorting by the Favorite column (the leftmost column).
Clicking the Mark Selected Messages As False Alarms / Remove False Alarm Masks From Selected Messages item marks selected warnings as false positives by adding a special comment to the lines of code they refer to (see the section above on managing false positives).
The Hide All V3163 Errors menu item hides all warnings that have this number.
The Exclude From Analysis item is used to add the full or partial pathname of the file containing a warning to the list of folders excluded from the analysis. Every file whose pathname matches the filter will be excluded from the analysis.
The Show Columns menu item opens a list of column names that you can hide or show.
Saving and loading analysis results
You can save or load analysis results using the items of the Tools > PVS-Studio submenu:
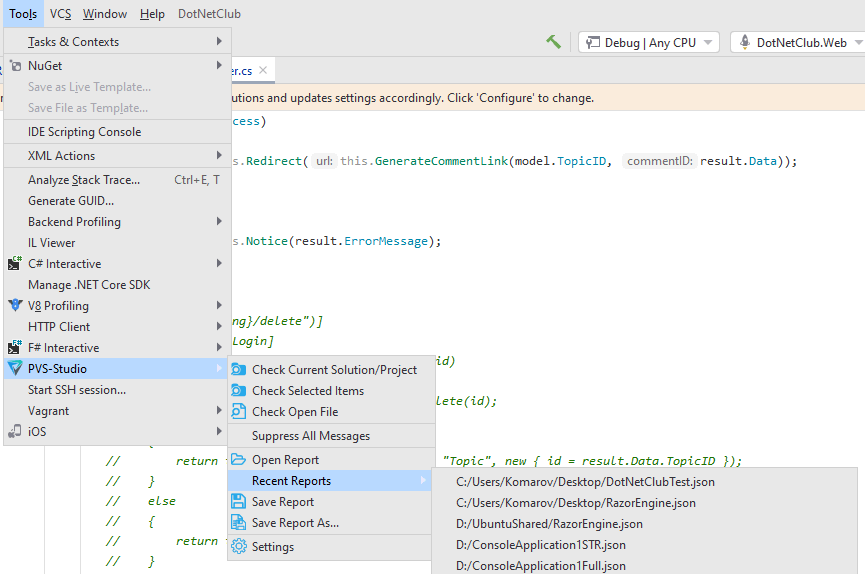
The Open Report command opens the .json report file and loads its contents into the table in the PVS-Studio output window.
The Recent Reports submenu contains a list of recently opened reports. Clicking an item in this list opens the report file (if the file still exists at that path) and loads its contents to the table in the PVS-Studio window.
Selecting the Save Report item saves all the messages from the table (including the filtered ones) to a .json report file. If the current list of messages has never been saved before, you will be prompted to enter a name for the report and choose where to save it.
Similarly, the Save Report As item saves all warnings from the table (including the filtered ones) to the .json file and always prompts you to specify the location where to save the report.
Keyboard shortcuts in PVS-Studio plugins for Rider and CLion
PVS-Studio plugins for Rider and CLion add a dedicated window for viewing PVS-Studio analysis results. It has a dropdown menu that appears when you right-click the analysis result window:

Some of the actions have keyboard shortcuts. Thus, you can perform them without using a mouse.
The arrow keys for navigating the analyzer warnings also have shortcuts:
- move to the next message:
Alt + [; - move to the previous message:
Alt + ].
Using shortcuts is helpful, since they speed up the analysis result processing. You can set and customize the shortcuts in the settings: File > Settings > Keymap. To find shortcuts faster, enter PVS-Studio in the search field of the Keymap window.
