
How to run PVS-Studio on Linux and macOS
- Introduction
- Installing and updating PVS-Studio
- License file information
- Running the analysis
- Incremental analysis mode
- File list analysis mode
- PVS-Studio integration into build systems and IDEs
- PVS-Studio integration into CI systems
- Filtering and viewing the analyzer report
- Notifying the developer teams (blame-notifier utility)
- Mass suppression of analyzer messages
- Common issues and their solutions
Introduction
PVS-Studio static analyzer for C and C++ code is delivered as the pvs-studio console application along with several supporting utilities. There are also integrations into VS Code, Qt Creator, and CLion via plugins, providing a user-friendly interface for analyzing projects. To run the analyzer, your project should have a properly configured build environment.
A new run of the analyzer is performed for every code file. The analysis results of several source code files can be added to one analyzer report or displayed in stdout.
The analyzer supports three basic operating modes:
- Project analysis using the pvs-studio-analyzer utility without any integrations.
- Integrating the analyzer using the CMake modules.
- Integrating the
pvs-studiocore directly into the build system.
Installing and updating PVS-Studio
See these web pages for command examples for installing the analyzer from packages and repositories:
License file information
To get started with PVS-Studio, fill out the feedback form to request a license. You can find more information on how to enter the license on Linux and macOS here.
Running the analysis
Before running the analysis, create a build model of your project.
Note. The project must be successfully compiled.
JSON Compilation Database
One way to analyze projects is to generate the compile_commands.json file in advance.
This approach works well with many popular build systems, including:
- CMake
- Ninja
- GNU Make
- Qt Build System
- Xcode.
To learn more about running the analysis based on the compile_commands.json files, refer to this documentation.
Note. This approach facilitates the analysis, as it does not require fully tracing compiler invocations. (The approach is described below).
Compilation tracing (for Linux only)
If generating the compile_commands.json file is not possible, use the compiler call trace mode, installing the strace utility. The utility allows the analyzer to get the required compilation information during the project build.
Note. Before using the mode, the project should be cleaned. This ensures the analyzer captures complete information about all compiled files.
To build the project and track the compilation process, use the following command:
pvs-studio-analyzer trace -- makeInstead of the make command, you can use any command to start the project's build with all the necessary parameters.
For example:
pvs-studio-analyzer trace -- make debugBy default, tracing generates a file named strace_out. For more details, refer to the documentation.
Possible difficulties
In some Docker images ptrace is disabled by default, which prevents the pvs-studio-analyzer utility from working in tracing mode.
Below are the methods to enable ptrace inside a container. Please note that full compatibility of PVS-Studio in such configurations is not guaranteed. If you encounter any issues, feel free to contact PVS-Studio support.
First method makes the container use the PID namespace of the host:
- Enable
ptraceon the host system; - Run the container with the
‑‑pid=hostoption:docker run -it ‑‑pid=host <image_name> bin/bash. Replace<image_name>with the name of your image.
Important: when using ‑‑pid=host, the container shares the PID namespace with the host, which reduces isolation and affects security of the system.
Second method injects a correctly configured ptrace_scope file into the image during build:
- Make sure
ptraceis enabled on the host; - Copy the file containing the value
0to the Dockerfile directory:bash cp /proc/sys/kernel/yama/ptrace_scope ./ptrace_scope; - In your
Dockerfile, add the copy instruction:COPY ptrace_scope /proc/sys/kernel/yama/ptrace_scope; - Rebuild the image:
bash docker build -t <new_image_name>.
Please follow this documentation to run PVS-Studio in Docker.
Running the project analysis
Once you have obtained the compilation tracing file (strace_out) or JSON Compilation Database (compile_commands.json), run the following command to start the analysis:
pvs-studio-analyzer analyze -o /path/to/PVS-Studio.log \
                            -e /path/to/exclude-path \
                            -j<N>
plog-converter -a GA:1,2 \
               -t json \
               -o /path/to/Analysis_Report.json \
               /path/to/PVS-Studio.log
The analyze mode requires either the strace_out or compile_commands.json file in the current working directory. You can explicitly specify the location of files using the ‑‑file (or -f) flag.
The analyzer warnings are saved to the specified Analysis_Report.json file. For other ways to view and filter reports, refer to the documentation: "Filtering and viewing the analyzer report".
If you use cross compilers
The compilers may have specific names, so the analyzer may not detect them. To analyze projects, explicitly list the names of the compilers without paths:
pvs-studio-analyzer analyze ... --compiler COMPILER_NAME \
  --compiler gcc --compiler g++ --compiler COMPILER_NAME

plog-converter ...
Cross-compilers are usually distributed along with their own implementations of the standard library, which are located in non-standard paths. The analyzer tries to detect them automatically; however, if this does not happen and the report contains warnings for these files, exclude such directories from analysis using the -e flag.
pvs-studio-analyzer ... -e /path/to/exclude-path ...If pvs-studio-analyzer misidentifies the cross-compiler type and runs the preprocessor incorrectly, you can explicitly specify the preprocessor via the following flag:
pvs-studio-analyzer analyze ... --compiler CustomCompiler=gccAfter that, pvs-studio-analyzer will run CustomCompiler with the gcc preprocessing flags. For more details, refer to the documentation.
Note. Integrating the analyzer into the build system should not cause any issues with cross-compilers.
Response files
You can pass a response file to the pvs-studio-analyzer utility. This file contains command-line arguments.
The response file argument on the command line is prefixed by the @ character, which is followed by the path to the response file (e.g. @/path/to/file.rsp). The file can include command-line arguments separated by spaces, tabs, or newlines.
To pass an argument that contains a whitespace, you can:
- escape the whitespace with a backslash (
\) character; - wrap the argument in single (
'') or double ("") quotes.
Note:
- Do not escape quotes inside quotes.
- There is no difference between single-quoted and double-quoted arguments.
- The arguments are passed exactly as written, no additional processing is performed (e.g. no shell variable or
globexpansion). - Recursive response files are also supported.
Incremental analysis mode
The pvs-studio-analyzer utility supports the incremental analysis mode that analyzes only modified files. To enable this mode, run the utility with the –incremental parameter:
pvs-studio-analyzer analyze ... --incremental ...This mode works independently from the incremental project build. If your project is fully compiled, the startup of the incremental analysis will analyze all files. On subsequent runs, only changed files will be analyzed.
To track changes, the analyzer saves service data within the .PVS-Studio directory in the startup directory. It is important to always run the analyzer in the same directory when using the mode.
File list analysis mode
In the pvs-studio-analyzer utility, the file list analysis mode analyzes the specific project files, which is useful for checking commits and pull requests. To enable this mode, run the utility with the ‑‑source-files or -S parameter and specify the path to a file containing the list of source files to analyze.
pvs-studio-analyzer analyze ... -S source_file_list ...To learn more about the file list analysis mode, refer to the documentation.
PVS-Studio integration into build systems and IDEs
Examples of integration into CMake, QMake, Makefile, and WAF
Test projects are available in the official PVS-Studio repository on GitHub:
- pvs-studio-cmake-examples, the CMake module on the GitHub repository
- pvs-studio-qmake-examples
- pvs-studio-makefile-examples
- pvs-studio-waf-examples
Integration with CLion and Qt Creator
Figure 1 shows analyzer warnings viewed in CLion (more details here):
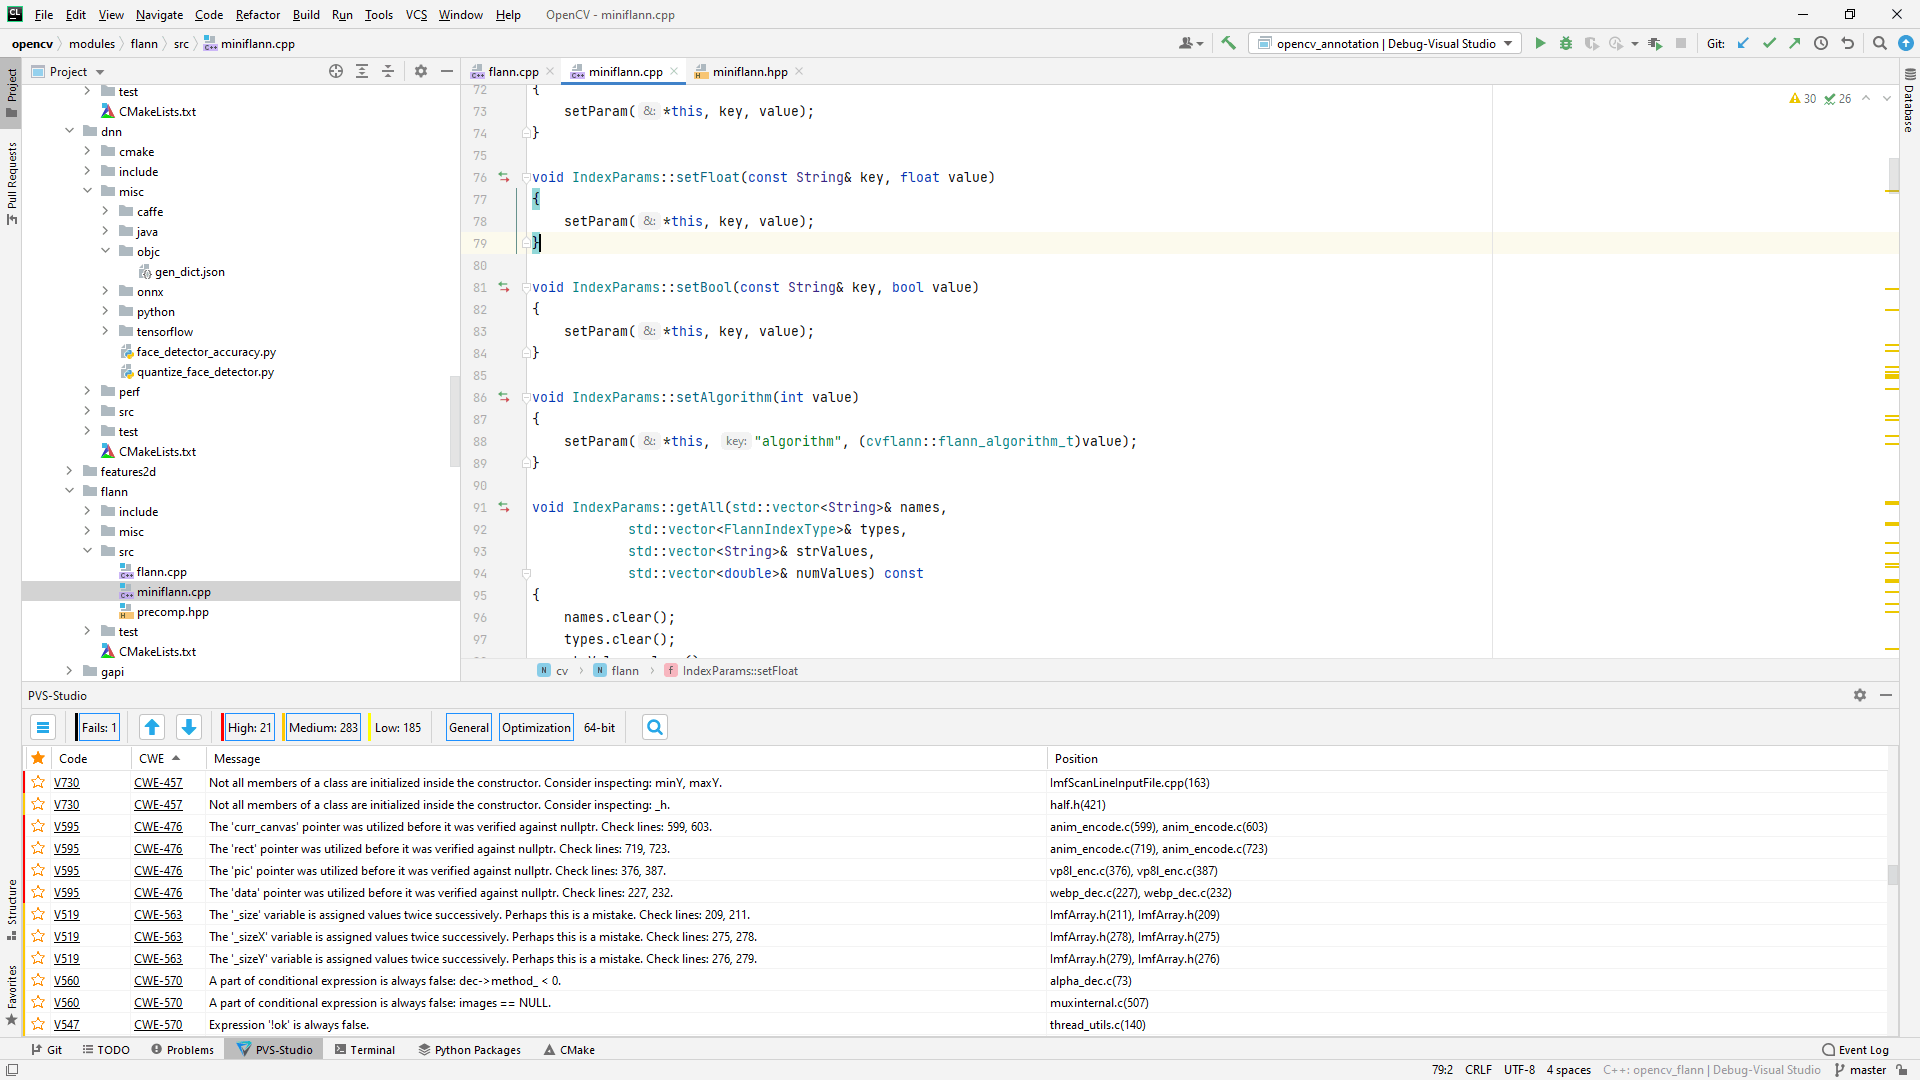
Figure 1 — PVS-Studio warnings viewed in CLion
Figure 2 shows analyzer warnings viewed in Qt Creator:
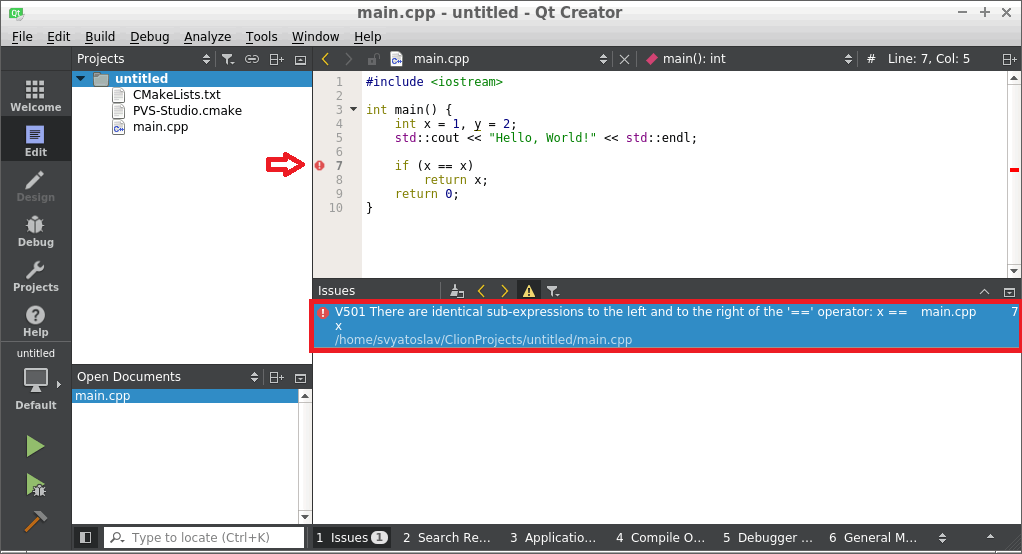
Figure 2 — PVS-Studio warnings viewed in Qt Creator
For more details about analyzing CMake projects in the Qt Creator environment, refer to the documentation.
The PVS-Studio for QtCreator extension is available. You can find more information about it here.
Preprocessor parameters
The analyzer checks the preprocessed files instead of the source files. This approach enables a deeper and more accurate code analysis.
Several restrictions that may interfere with the preprocessor or alter its output are applied to the passed compilation parameters. For example, some debugging and optimization flags—-O2, -O3, -g3, -ggdb3, etc.—can affect the preprocessor output. As a result, if any invalid parameters are detected, the analyzer will display a warning.
While it is not necessary to change the settings of the checked project, some parameters should be excluded to ensure that the analyzer runs correctly.
Configuration file *.cfg
When integrating the analyzer into a build system, pass the configuration file (*.cfg). You may choose any name for the configuration file, but it should be passed with the ‑‑cfg flag.
Here are the available parameters for the settings in the configuration file:
exclude-path(optional) specifies directories whose files can be excluded from analysis, for example, system file directories or third-party libraries. There can be severalexclude-pathparameters.analysis-paths(optional) defines the analysis behavior for the specified paths. The available modes:skip-analysisspecifies directories whose files can be excluded from the analysis, for example, directories of system files or third-party libraries;skip-settingsignores the settings located in the source files and.pvsconfigfiles located at the specified path;skipignores the settings from the source files and.pvsconfigfiles at the specified path. Warnings for source files matching the specified path or mask will also be ignored.
platform(required) specifies the target platform. Possible options arelinux32orlinux64.preprocessor(required) specifies the target preprocessor. Possible options aregcc,clang, orkeil.language(required) specifies the C/C++ language that the analyzer expects in the file provided via‑‑source-file. Possible options areCandC++. Setting this parameter incorrectly may lead to the V001 errors because every supported language option has certain specific keywords.lic-file(optional) contains the absolute path to the license file.analysis-mode(optional) defines the warning type. It is recommended to use the4value (General Analysis, commonly recommended for most users).output-file(optional) specifies the full path to the file with the location of the analyzer report. If this parameter is missing in the configuration file, all warnings will be displayed in the console.sourcetree-root(optional) specifies the root path that the analyzer will automatically replace with a special marker. By default, when generating warnings, PVS-Studio includes full and absolute paths to files where the analyzer has detected errors. For example, the absolute path to the/home/project/main.cppfile replaces the|?|/main.cpprelative path if/home/projectis specified as the root.source-file(required) contains the absolute path to the source file to be analyzed.i-file(required) contains the absolute path to the preprocessed file.no-noise(optional) disables the generation of low-certainty messages (Level 3). In large-scale projects, the analyzer may issue a high volume of warnings. Use this setting to prioritize the most important ones first, especially when addressing all warnings at once is not feasible.
Note. It is not necessary to create a new configuration file to check each file. You can save permanent settings into it. For example, lic-file.
PVS-Studio integration into CI systems
The following approaches to integrating analysis into build systems can be automated in CI environments (for example, Jenkins, TeamCity, etc.) by setting automatic analysis startup and notification for the detected errors.
It is also possible to integrate the tool with the SonarQube continuous analysis platform using the plug-in PVS-Studio. The plugin is provided with the analyzer in the .tgz archive available to download. For more details on this plugin, refer to this documentation.
You can convert PVS-Studio analysis results into a specific format for uploading to DevSecOps platforms like DefectDojo, SonarQube, and CodeChecker. To learn more how to integrate analysis results, see the documentation.
Filtering and viewing the analyzer report
Plog Converter utility
To convert the analyzer bug report to different formats—*.xml, *.tasks, and so on—you can use the open-source utility, Plog Converter. Learn more about how it works in the documentation.
Viewing the analyzer report in Qt Creator
Use the following command to open the report in Qt Creator (recommended for most users):
plog-converter -a GA:1,2 -t tasklist \
               -o /path/to/project.tasks \
               /path/to/project.log
Figure 3 illustrates an example of the .tasks file viewed in Qt Creator:
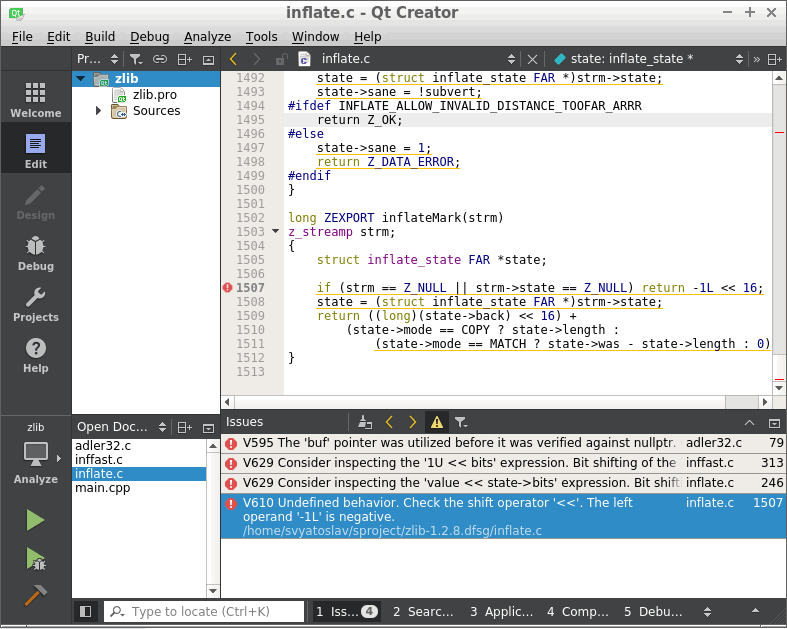
Figure 3 — The .tasks file viewed in Qt Creator
Viewing an HTML report in a web browser or an email client
The analyzer report converter can generate two types of HTML reports:
1. FullHtml is a full report for viewing the analysis results. It enables developers to search and sort warnings by type, file, level, code, and warning message. Users can navigate this report to find error locations in the source code file. The source code files that triggered the analyzer warnings are copied to HTML and become a part of the report. The examples of the report are shown in Figures 4–5.
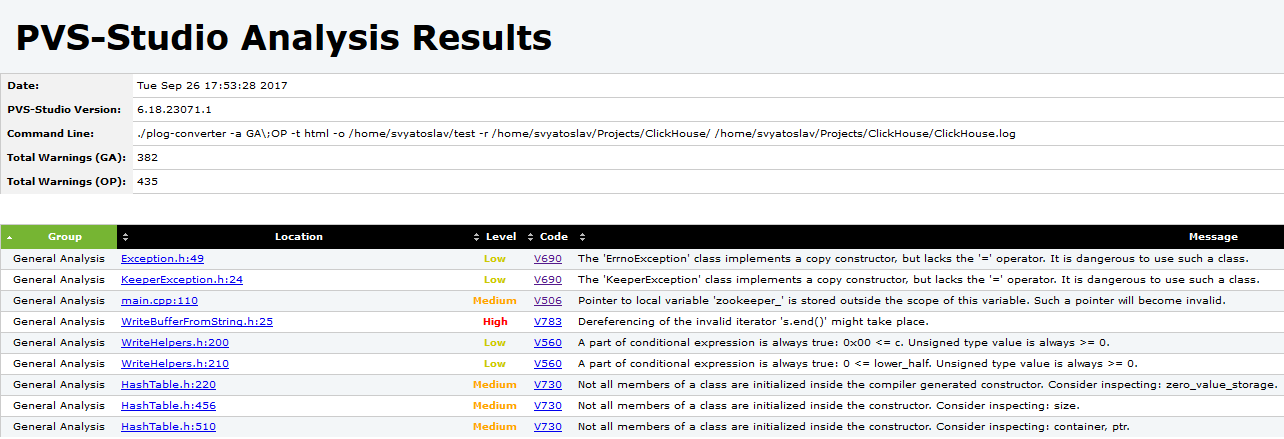
Figure 4 — An example of the Html main page report
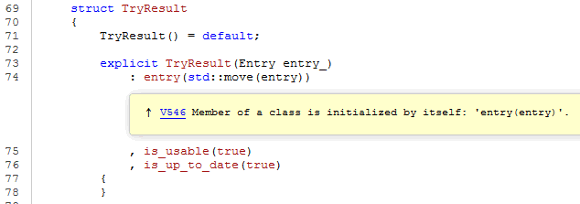
Figure 5 — A warning viewed in code
The example command to generate such a report:
plog-converter -a GA:1,2 -t fullhtml \
               -o /path/to/report_dir \
               /path/to/project.log
This report can be conveniently shared as an archive or accessed over a local network using any web server, for example, Lighttpd, etc.
2. Html is a simplified report, consisting of a single .html file. It contains brief information about the detected warnings and is suitable for notification by email. The report example is shown in Figure 6.
Figure 6 — A simple HTML page example
The example of the command for receiving such a report:
plog-converter -a GA:1,2 -t html \
               -o /path/to/project.html \
               /path/to/project.log
Viewing the analyzer report in Vim and gVim
The command examples to open the report in the gVim editor:
plog-converter -a GA:1,2 \
               -t errorfile \
               -o /path/to/project.err \
               /path/to/project.log

gvim /path/to/project.err
:set makeprg=cat\ %
:silent make
:cw
Figure 7 shows an example of viewing the .err file in gVim:
Figure 7 — Viewing the .err file in gVim
Viewing the analyzer report in GNU Emacs
The command examples to open the report in the Emacs editor:
plog-converter -a GA:1,2 \
               -t errorfile \
               -o /path/to/project.err \
               /path/to/project.log

emacs
M-x compile
cat /path/to/project.err 2>&1
Figure 8 shows an example of viewing the .err file in Emacs:
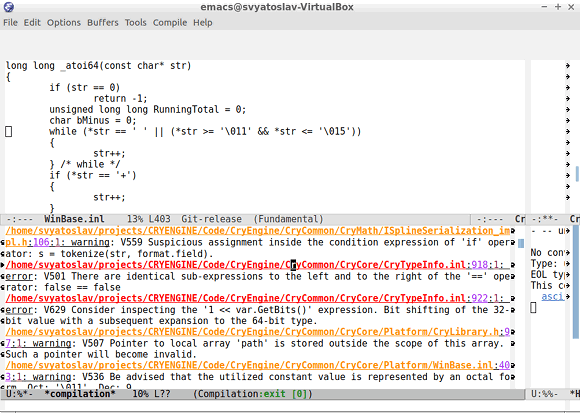
Figure 8 — Viewing the .err file in Emacs
Viewing the analyzer report in LibreOffice Calc
The command examples to convert the report to the CSV format:
plog-converter -a GA:1,2 \
               -t csv \
               -o /path/to/project.csv \
               /path/to/project.log
After opening the project.csv file in LibreOffice Calc, add Menu Bar > Data > AutoFilter. Figure 9 shows an example of viewing the .csv file in LibreOffice Calc:
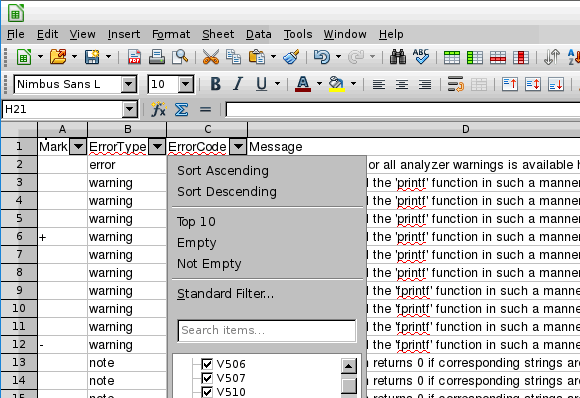
Figure 9 — Viewing the .csv file in LibreOffice Calc
Notifying the developer teams (blame-notifier utility)
The blame-notifier utility automates the process of notifying developers whose code triggered warnings from PVS-Studio when committed to a repository. It works as follows:
- The analyzer report is passed to the
blame-notifieralong with additional parameters. - The utility identifies files with warnings and generates the HTML reports grouped by the authors of the changes.
- HTML reports are sent via the specified SMTP server to all authors listed in a special file.
It also supports sending a full report containing all warnings, sorted by author.
For more details on how to install and use the utility, refer to the following documentation: "Notifying the developer teams (blame-notifier utility)."
Mass suppression of analyzer messages
Mass warning suppression streamlines the analyzer integration into any project and starts detecting new bugs right away. This mechanism enables developers to schedule fixing of missed warnings for later without distracting developers from their current tasks.
There are several ways to use this mechanism, depending on how the analyzer is integrated. Learn more about how to use the warning suppression mechanism in pvs-studio-analyzer in the documentation.
Direct analyzer integration into a build system
Direct integration into the build system may look as follows:
.cpp.o:
  $(CXX) $(CFLAGS) $(DFLAGS) $(INCLUDES) $< -o $@
  $(CXX) $(CFLAGS) $< $(DFLAGS) $(INCLUDES) -E -o $@.PVS-Studio.i
  pvs-studio --cfg $(PVS_CFG) --source-file $< --i-file $@.PVS-Studio.i
    --output-file $@.PVS-Studio.log
In this mode, the analyzer cannot analyze source files and filter them simultaneously. Warning filtration and suppression would require additional commands.
To suppress all the warnings, use the command:
pvs-studio-analyzer suppress /path/to/report.logTo filter a new log, use the commands:
pvs-studio-analyzer filter-suppressed /path/to/report.log
plog-converter ...
The file with suppressed warnings has the suppress_file.suppress.json default name. However, you can specify a custom name if needed.
Common issues and their solutions
1. The strace utility issues the following message:
strace: invalid option -- 'y'Make sure the strace program is updated to the minimal required version 4.7. It is a complex task to analyze a project without integrating it into a build system. This utility helps the analyzer get important compilation-related information.
2. The strace utility issues the following message:
strace: umovestr: short read (512 < 2049) @0x7ffe...: Bad addressSuch errors occur in the system processes and do not affect the project analysis.
3. The pvs-studio-analyzer utility issues the following message:
No compilation units foundThe analyzer could not find files for the analysis. You may be using cross-compilers to build your project. To learn more, please see the documentation.
Another possible scenario is when trace mode is run on a built project. This causes the resulting strace_out file to be empty. In this case, clean the project after building it and run the compilation trace again.
4. The analyzer report may contain the following strings:
r-vUVbw<6y|D3 h22y|D3xJGy|D3pzp(=a'(ah9f(ah9fJ}*wJ}*}x(->'2h_u(ah
The analyzer saves the report in the intermediate format. To view this report, convert it to the readable format using the plog-converter utility, which is installed with the analyzer.
5. The analyzer issues the following error:
Incorrect parameter syntax:
The ... parameter does not support multiple instances.
One of the analyzer parameters is set incorrectly several times.
This can happen if a part of the analyzer parameters is specified in the configuration file, and another part is passed via the command line parameters. At the same time, a parameter has been accidentally specified several times.
If you use pvs-studio-analyzer, most parameters are detected automatically, so the utility can run without a configuration file. Duplication of such parameters can also cause this error.
6. The analyzer issues the warning:
V001 A code fragment from 'path/to/file' cannot be analyzed.If the analyzer is unable to parse any code fragment, it skips it and issues the V001 warning. This does not affect the analysis of other files, but if this code is located in a header file, the number of such warnings may be significant.
To help us improve the analyzer, please send the corresponding preprocessed *.PVS-Studio.i and configured *.PVS-Studio.cfg files that includes the problematic code fragment via the feedback form.
Was this page helpful?