
Our website uses cookies to enhance your browsing experience.

The PVS-Studio team writes articles on various topics. But we rarely make articles on how to interact with the analyzer. Let's fix it with an article about the PVS-Studio plugin for the Visual Studio 2022 environment.
Static code analysis is a process of detecting errors and flaws in the program's source code. In general, static analysis is an automated code review process. A joint code review is a wonderful methodology. But it also has a drawback — it costs too much. Developers have to regularly gather to inspect new code or re-inspect the changed one.
On the one hand, regular code reviews are necessary. On the other hand, they're too expensive. A compromise solution is static code analysis tools. They process the program's source code non-stop and recommend the developer to pay special attention to certain code fragments. Of course, the tool won't replace a real code review with a team of developers. However, the price/benefit ratio makes static analyzers a very effective practice used by many companies. If you are interested in numbers, you can read the "PVS-Studio ROI" article.
There are lots of paid and free static code analyzers. Their list is available on Wikipedia: List of tools for static code analysis. The list of languages available for static code analysis is also long — C, C++, C#, Java, Ada, Fortran, Perl, Ruby, etc. Of course, this article is only about the PVS-Studio analyzer.
The main advantage of static analysis — it reduces the cost of fixing program defects. The earlier the error is detected, the lower the cost of fixing it. Steve McConnell in "Code Complete" introduces the following data: correcting an error at the system test stage will cost ten times more than at the construction stage:
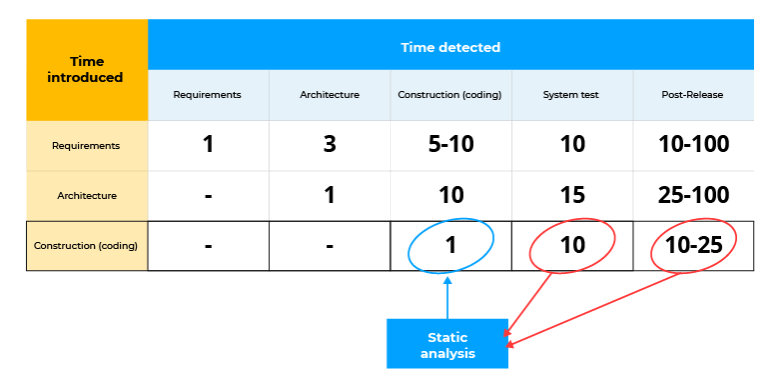
Static analysis tools identify a large number of errors at the construction stage. This significantly reduces the cost of the development process. For example, the PVS-Studio static code analyzer runs in the background right after compilation. If the analyzer finds an error, it notifies the developer. Below, this mode is described in detail.
PVS-Studio is a static analyzer that detects code errors and potential vulnerabilities. It works with C, C++ (including C++/CLI and C++/CX extensions), C#, and Java languages. The analyzer is available for Windows, Linux, and macOS. The analyzer can be integrated into Visual Studio 2010 – 2022 , IntelliJ IDEA and Android Studio, JetBrains Rider, and CLion environments. In this article we take a look at the PVS-Studio analyzer for Visual Studio 2022. You can also read about using PVS-Studio in other IDEs:
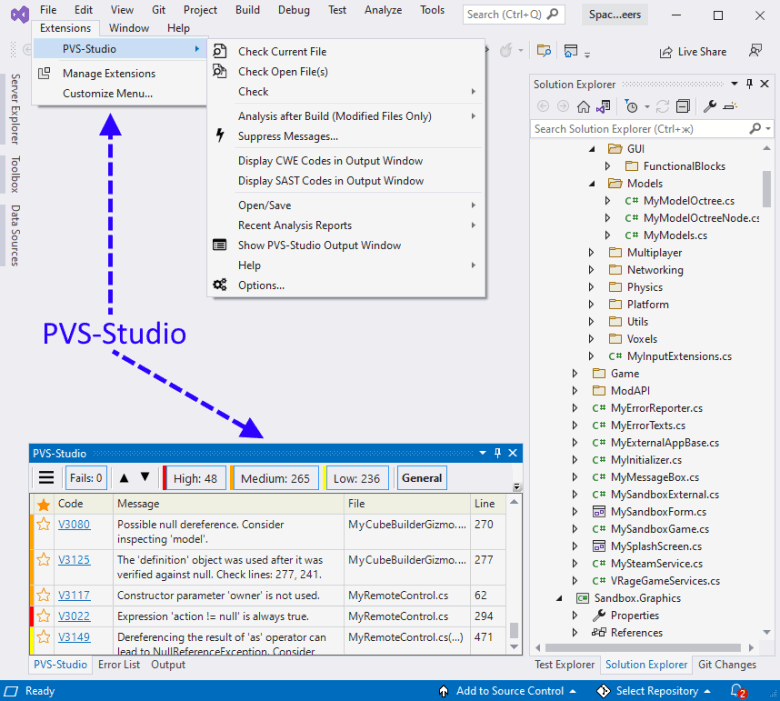
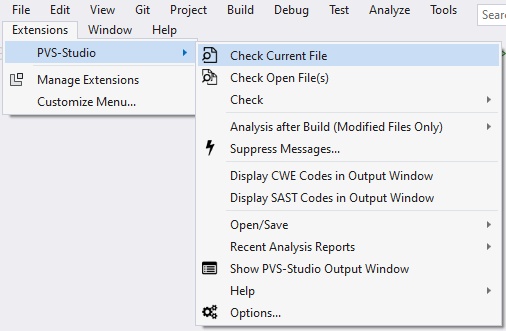
After installing PVS-Studio and integrating into Visual Studio, users get the additional "PVS-Studio" item in the Extensions menu and a window to work with analyzer warnings.
The analyzer is ready to work right after the installation. In most cases, you don't need to configure anything to make the first launch. The only thing you may need to setup is to exclude third-party libraries. You are not going to fix the source files (for example, jpeg libraries) anyway, so there's no need to analyze it. Besides, if you exclude unnecessary folders, the analysis time will be reduced. You can exclude the directories here: Extensions > PVS-Studio > Options... > Don't Check Files > PathMasks.
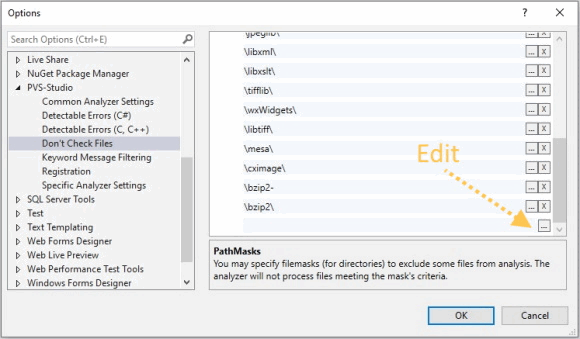
If the full path to the file has one of the specified names, the file won't be analyzed. By default, the list already has names of some directories. However, your project may have the "zlib" library named as "zip_lib". That's why you need to edit the list. To start editing, click the button with three dots.
Examples of valid masks for the PathMasks list:
Besides excluding entire folders, you can exclude individual files. The FileNameMasks setting can help with this. To find more information on how to work with exception lists, read the "Settings: Don't Check Files" documentation.
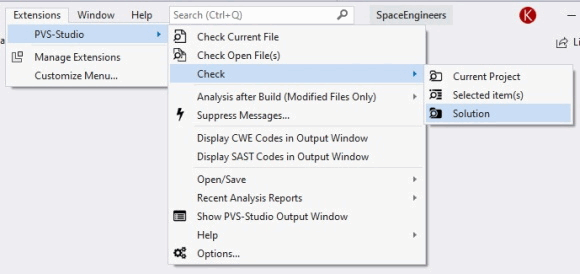
After configuring the analyzer, you can start checking the project. PVS-Studio for Visual Studio can check C++ (.vcxproj) and C# (.csproj) projects. You can also check the whole solution that contains projects of these types. To do this, go Extensions > PVS-Studio > Check > Solution.
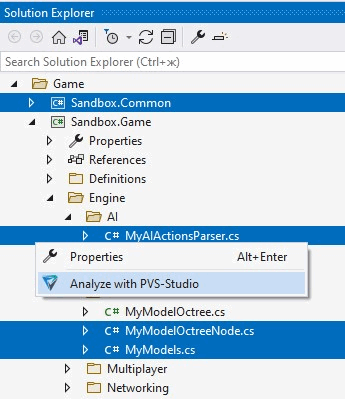
It's also possible to run analysis only on certain projects and/or files selected in Solution Explorer. To do so, after choosing elements in Solution Explorer, right-click and select Analyze with PVS-Studio:
If you have difficulties with the check, you can read the "Can't check?" section on our website. These are not useless recommendations like "check that the plug is in the outlet". This section describes typical situations that our clients have contacted us with, and ways to fix it. If you haven't found a solution to your problem, contact our support.
After the check all the analyzer warnings will be displayed in a special window. This window has many control elements. All of them serve to display only those analyzer warnings interesting to the user. At first, the window may seem complicated. So, let's look at the control elements.
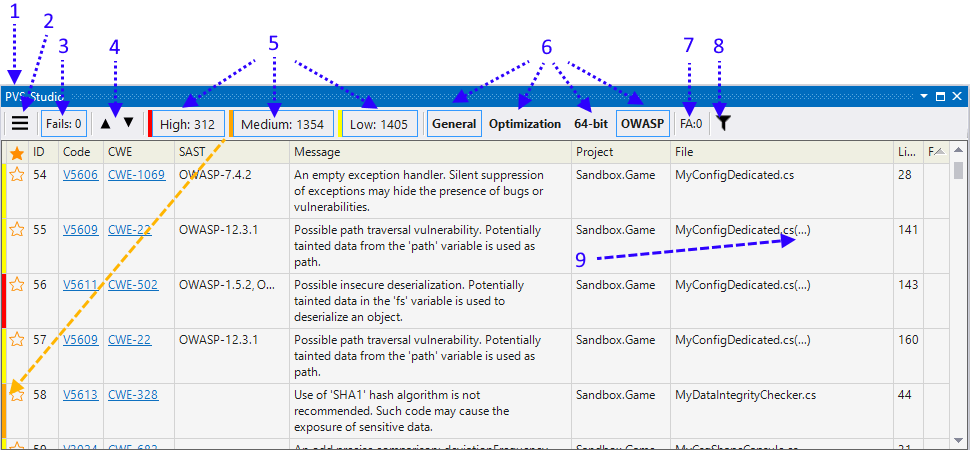
The table with the analyzer warnings has the following columns:
A long list. However, I assure you, once you try the tool, you'll quickly get used to it. You will rarely press any button to configure the analyzer.
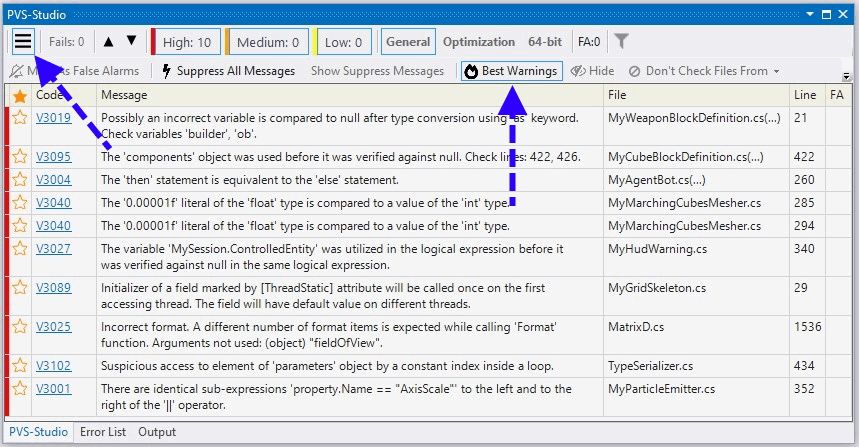
When you run the analyzer for the first time, the result may scare and/or confuse the developer — the analyzer's report may contain a huge number of warnings about potential errors and vulnerabilities. We took into account this scenario and added the Best Warnings mechanism to the plugin for Visual Studio. The button for enabling/disabling this mechanism is in the Additional Actions menu:
This mechanism calculates the best analyzer warnings using a number of criteria assigned to each diagnostic. You can find more information about this mechanism in the corresponding section of our documentation.
The analyzer's best warnings filter is designed for a more pleasant first acquaintance with PVS-Studio, so we do not recommend using it on a regular basis.
If you double-click on a warning, you go to the desired code fragment. If you right-click on a warning, you'll open the dropdown menu.
The menu is quite simple, so we won't overwhelm the article with its description. If something is unclear, you can look it up in the documentation.
Some items in the context menu have keyboard shortcuts, which allows you to process the analysis results more quickly and conveniently.
However, we should mention a very useful feature. Remember that in the settings you can add folders/files for exclusion. Adding something is much easier than it seems!
Note the item "Don't check files and hide all messages from...". If you click on it, it displays a list of paths that can be added to exceptions.
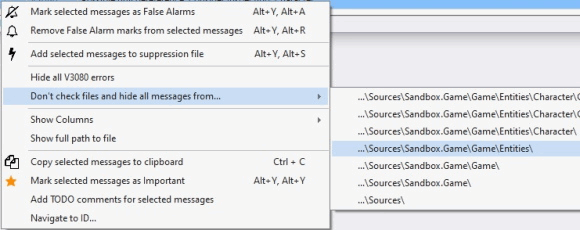
You can select one file or the whole directory. The picture shows that we chose the "Sources\Sandbox.Game\Game\Entities" folder. This means that all files in this folder and its subfolders are excluded from the analysis. Moreover, all the messages related to these files will immediately disappear from the list. You don't need to restart the analysis to remove all the messages related to test files.
This article wouldn't be complete if we didn't tell you about incremental analysis.
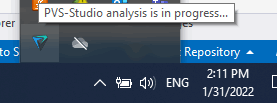
The earlier we find an error, the lower the cost of fixing it. It's great to search for an error in the edited program code. However, it's technically difficult and resource-intensive. That's why PVS-Studio starts running in the background when the edited code is compiled. Thus, the analyzer searches for errors in the changed files. The icon in the system notifications area implies that the analysis is running in the background.
When it finds an error, a notification appears and warns the developer.
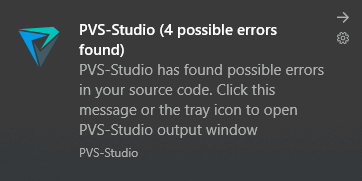
If you click on the notification or an icon, the IDE with the analysis result opens, and you can inspect suspicious code fragments.
Actually, rather than reading about this mode, you should try it. You write code as usual. The analyzer will disturb you only when it's necessary. Try it!
The PVS-Studio developers constantly use this mode. Yes, we make mistakes when coding, too. The ability to fix them immediately reduces the time spent on detecting an error and trying to understand why the program does not behave as intended. It's a shame to spend 15-20 minutes on debugging and then find a typo in an index. Here's one of the cases when the PVS-Studio analyzer found an error in itself right after it appeared in code:
if (in[0] == '\\' && in[1] == '.' && in[1] == '\\')
{
  in += 2;
  continue;
}
Of course, the most interesting is yet to come. The PVS-Studio analyzer can be much more useful. Here's a review about our analyzer: "A user's experience of working with the analyzer". Read it, it's worth your time.
Let me summarize. Incremental analysis is something you should definitely try. You'll love it as soon as it finds a couple of errors in fresh code.
The PVS-Studio analyzer for C# is built on Roslyn API, which performs intermodular project analysis. It's a bit more complicated with intermodular analysis of C++ projects. That's why we only recently implemented this feature in PVS-Studio. Intermodular analysis allows the analyzer to collect information about the whole project instead of each separate file. This allows to increase the analysis quality and accuracy. More detailed information about the features of the intermodular analysis of C++ projects in PVS-Studio can be found in the article "Intermodular analysis of C++ projects in PVS-Studio.".
Let's be honest. It's impossible to briefly describe all the diagnostics in our analyzer. You can find the full list of diagnostics and their description by following the link: PVS-Studio Messages. In this article we'll show you a table where diagnostics are grouped by type. Some diagnostics belong to more than one group. The grouping is very conventional. For example, a typo can cause the use of uninitialized memory. Some errors were excluded from this list — they are too specific. Nevertheless, this table demonstrates PVS-Studio's functionality. Note: the table is too long, so here's a small screenshot. If you want to see the whole table, follow the link above or just click on the picture.
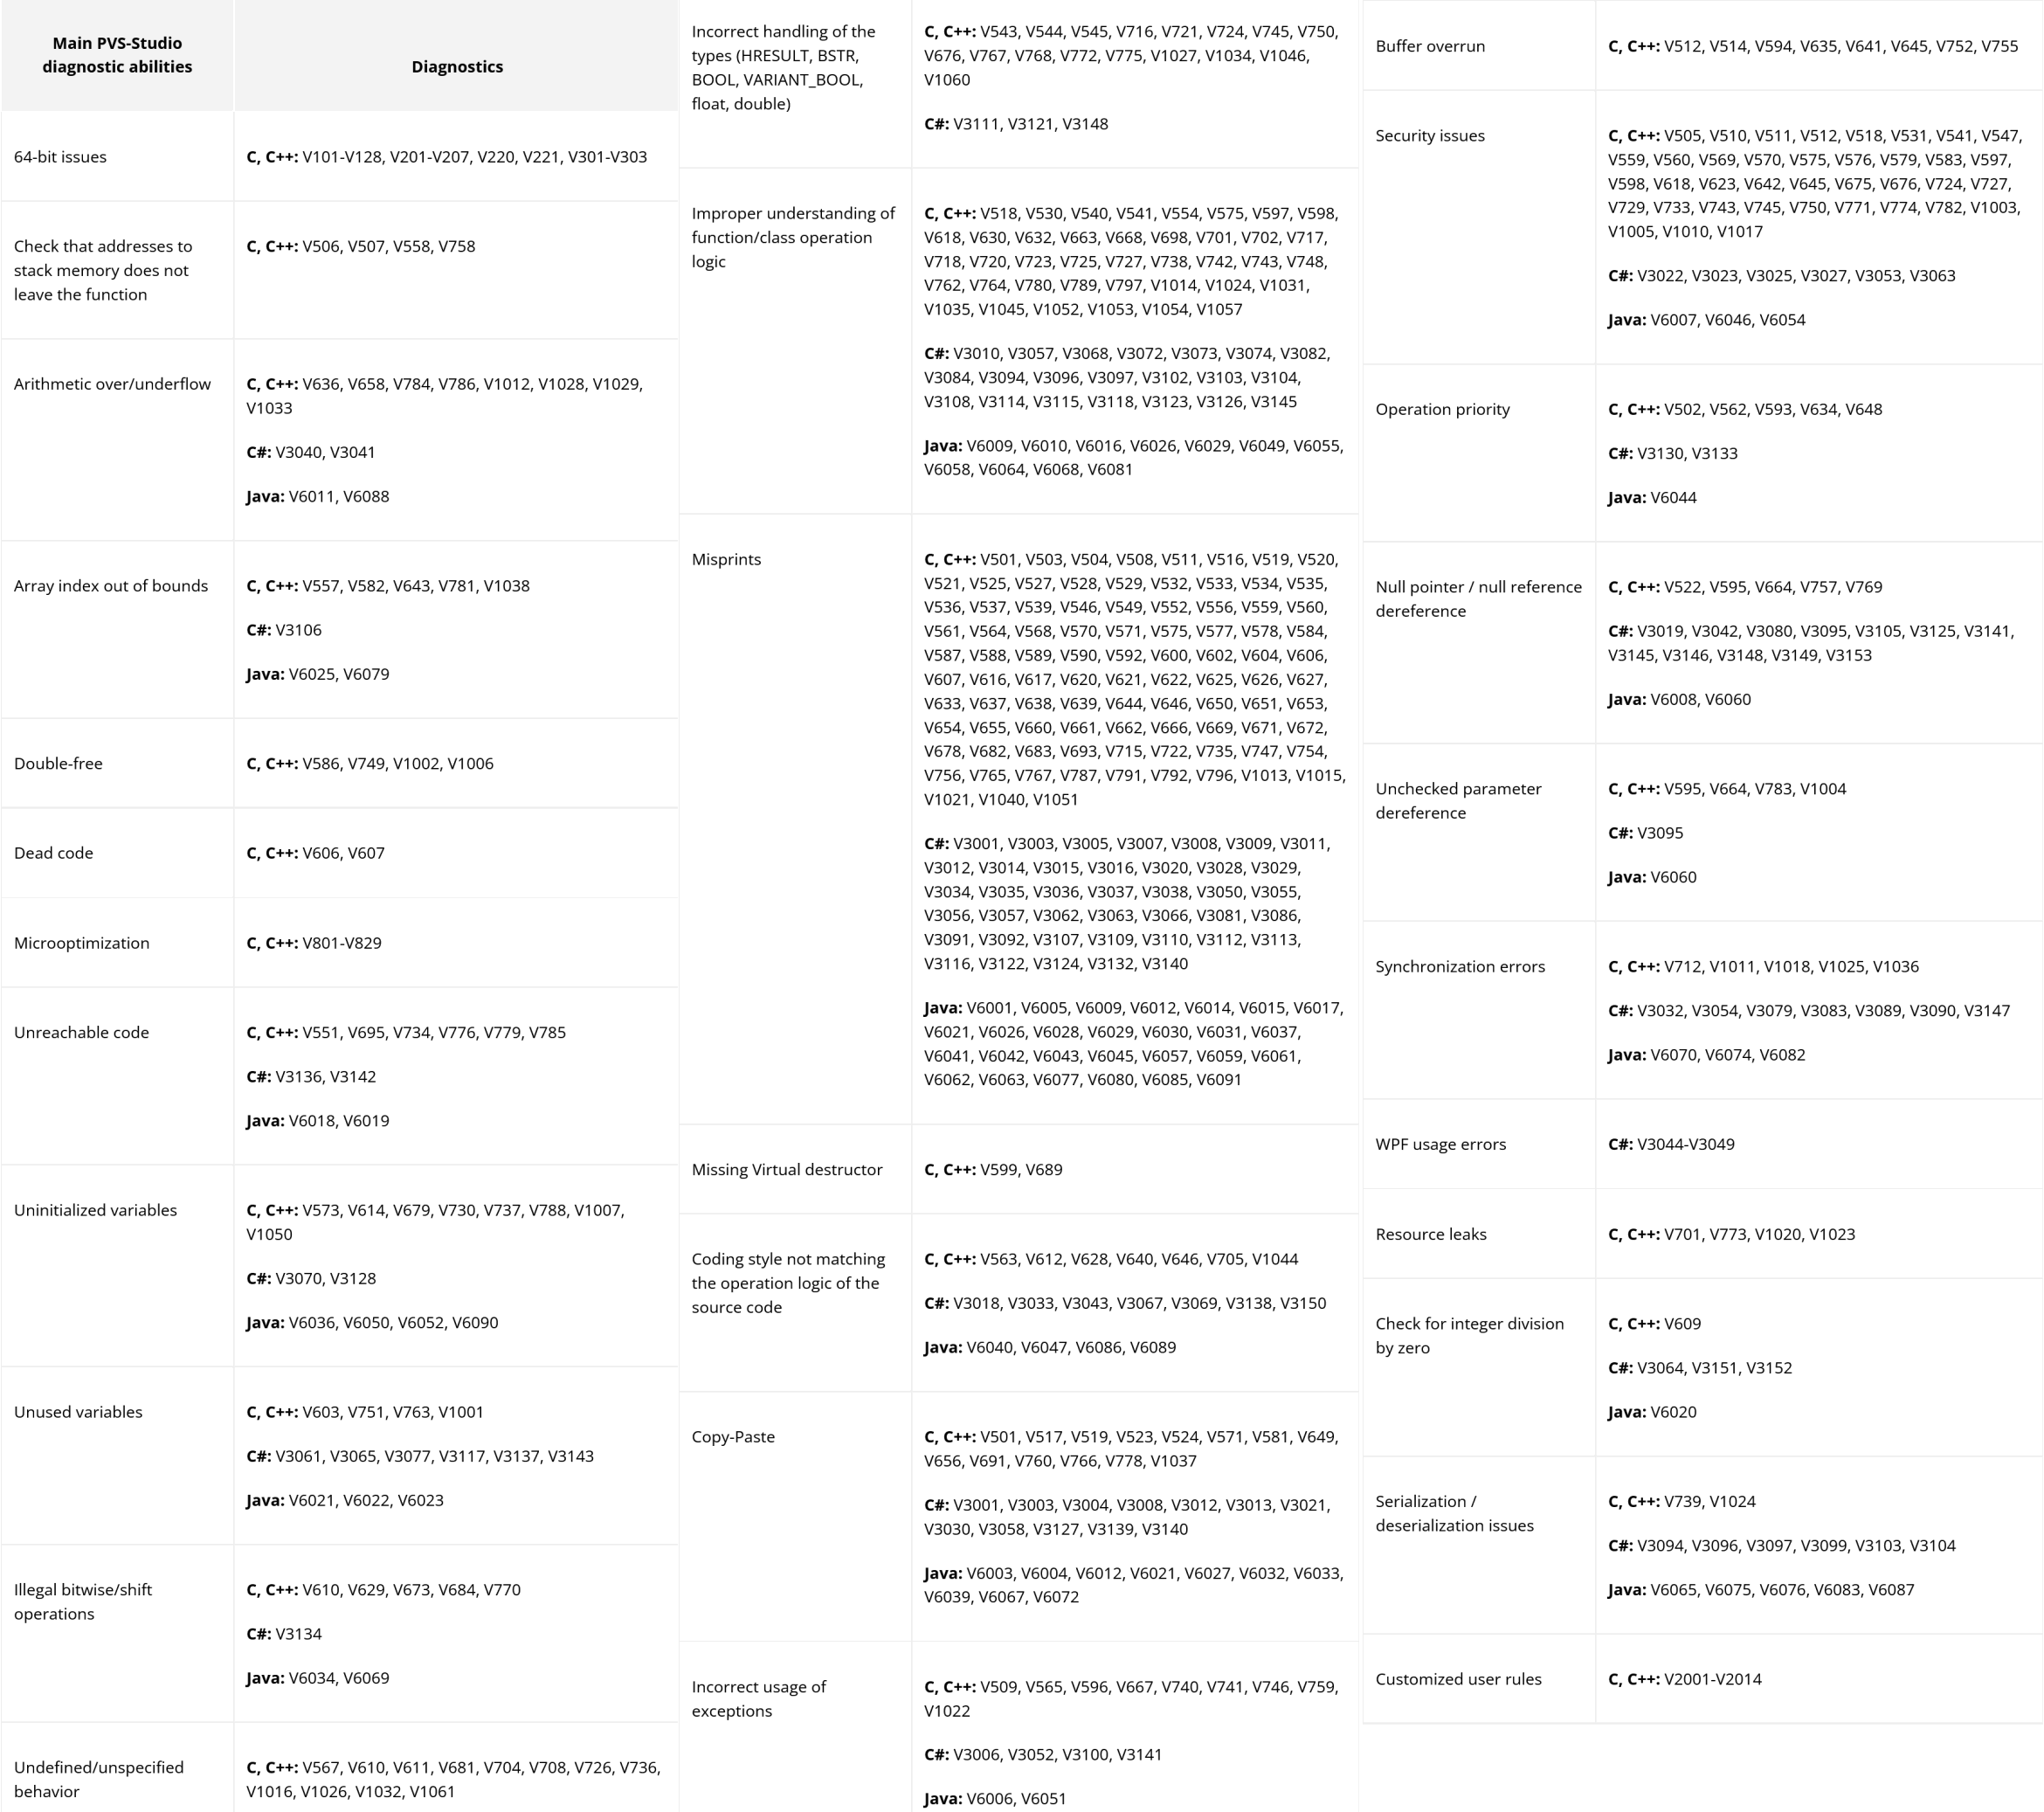
As you can see, the analyzer shows its full power when searching for typos and copy-paste. It's good at finding the problems related to code security.
If you want to see how it works on real projects, visit the error database page. This database has errors that we found when checking open-source projects.
PVS-Studio is a Static Application Security Testing (SAST) tool. The analyzer detects potential vulnerabilities in the project's code and shows the corresponding error identifier in a certain classification.
PVS-Studio supports the following error classifications:
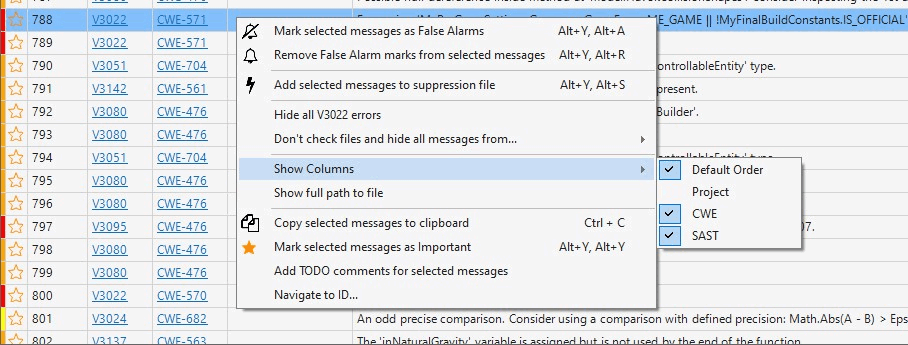
You can enable the display of CWE/SAST codes by using the context menu and following this path: Show Columns > CWE / SAST.
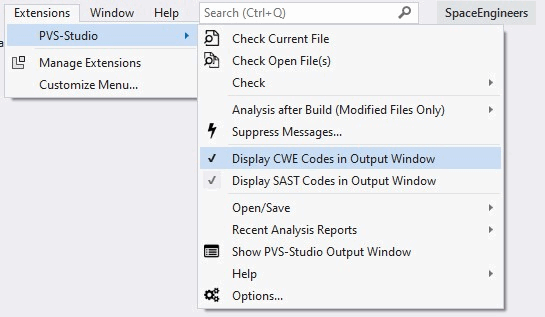
Alternatively, you can enable it in the menu (Extensions > PVS-Studio > Display CWE Codes in Output Window / Display SAST Codes in Output Window)
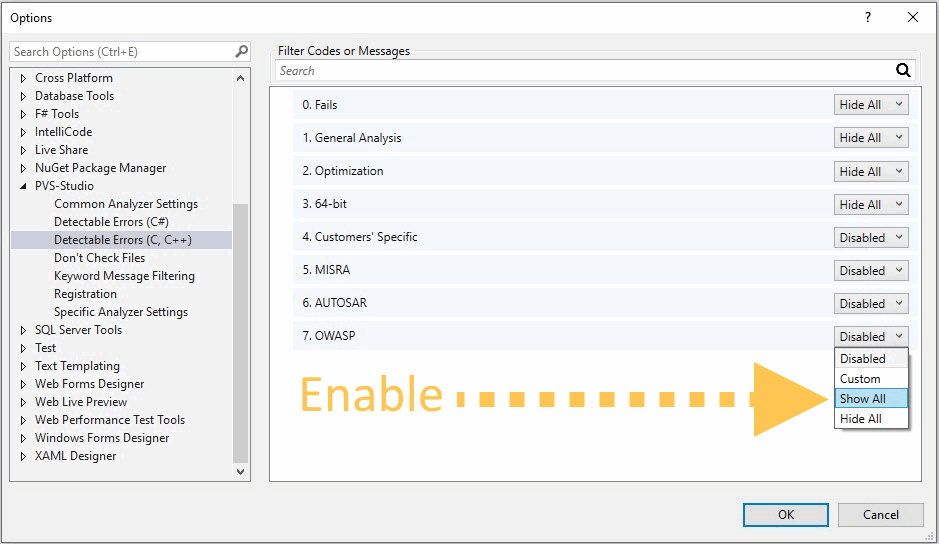
MISRA/AUTOSAR/OWASP diagnostics are enabled separately in the settings:
You can read more about it here.
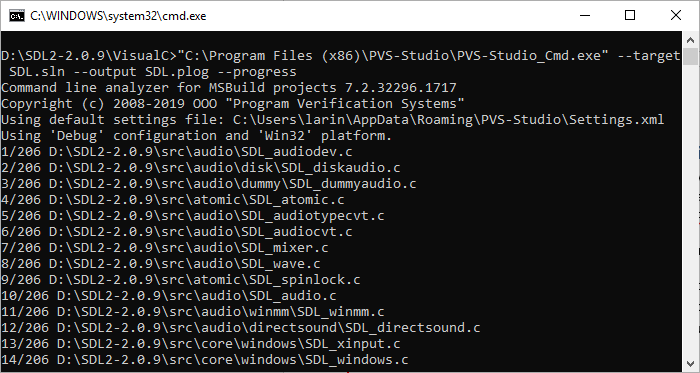
You can also run the PVS-Studio analyzer from the command line. To do so, use the PVS-Studio-Cmd.exe utility. Detailed information on the utility and its parameters can be found in the documentation.
This is how this utility looks like:
After execution, you receive a plog file with the report, the path to which we specified in the startup parameters. This report can be converted to other formats with PlogConverter.exe. To view the report in the IDE, just double-click on the plog file in explorer.
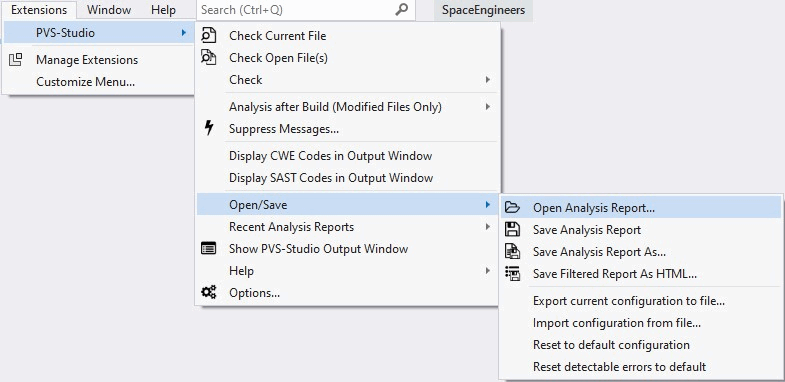
You can also open the report file in the extensions menu by following the path Extensions > PVS-Studio > Open/Save > Open Analysis Report...
Some warnings issued by analyzer will inevitably be false positives. There's nothing we can do about it. A static analyzer is just a program that does not have artificial intelligence and cannot accurately determine whether it has found a real error or not.
To fight false positives, the analyzer provides a set of different mechanisms. They are described in the following sections of the documentation:
Of course, this is not even the half about our analyzer. If we start describing everything, then the article will turn into documentation. The goal was to show how easy it is to work with the tool within the Visual Studio environment. You can read about other environments and modes of operation in the documentation and other articles on our website. By the way, there are a lot of interesting things for developers there. Come visit.
Note that PVS-Studio doesn't work in the Microsoft environment exclusively. The analyzer also supports the Java language, works on Linux and macOS, can be integrated into CMake, and much more. Read more about it in documentation.
I wish clean code to you and hope you'd enjoy PVS-Studio. If you have any questions, we'll happily help you. Contact us.
0
0
0
0