
Our website uses cookies to enhance your browsing experience.

It's January 2024, so it's time to look back on 2023. In this article, we will not only discuss all the new features that have appeared in 2023, but also go over the main functions of the PVS-Studio static analyzer.
PVS-Studio is a static code analyzer that detects errors and potential vulnerabilities in C, C++, C#, and Java code. The tool is used for monitoring and enhancing code quality.
For more information, please see the product page.
Download the newest version of PVS-Studio.
We always strive to increase the number of the PVS-Studio plugin integrations into third-party tools and enhance the existing ones. New plugins bring even more cross-platform options!
Early last year saw two major integrations with well-known IDEs — Visual Studio Code and Qt Creator.
PVS-Studio has plugins for the following IDEs:
A lot of work has been done on new plugins during this time. At first, the plugins were limited to viewing the analyzer report, but now they enable you to fully analyze the project, suppress warnings and so forth.
Moreover, plugins now support the baselining of analysis results. It simplifies the handling of the analyzer warnings in legacy code, enabling you to focus only on new warnings. As a result, introducing the analyzer into the project will be much easier.
You may read more about how to facilitate PVS-Studio introduction in a project in the article "How to introduce a static code analyzer in a legacy project and not to discourage the team".
Visual Studio Code
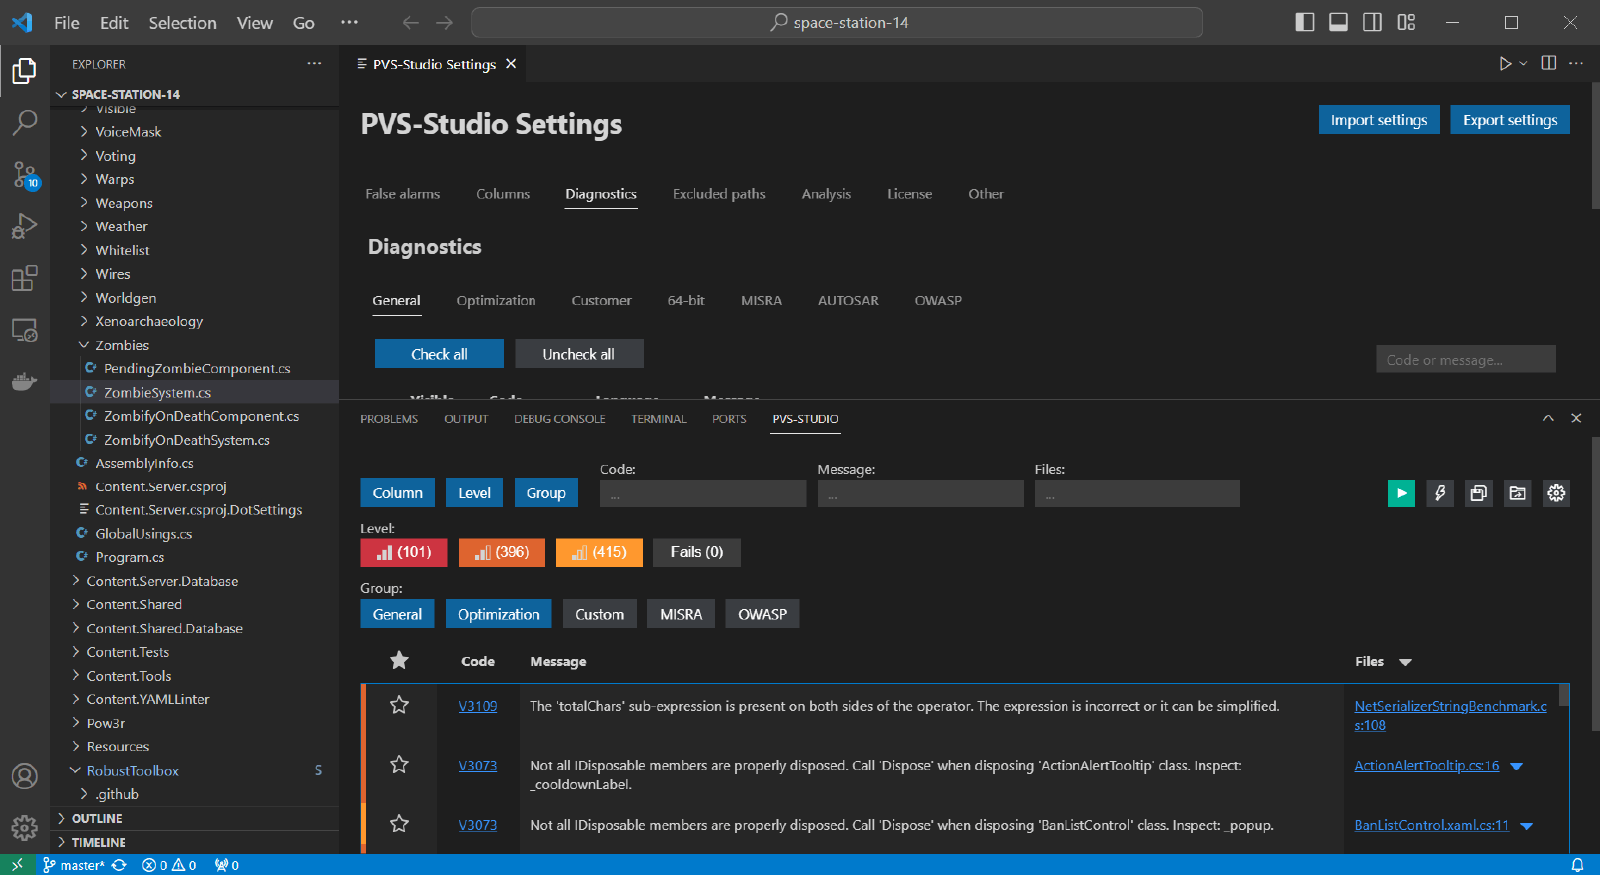
Now the PVS-Studio plugin for Visual Studio Code supports the analysis of C, C++, and .NET projects.
Note. In 2024, we're planning to add support for Java code analysis in Visual Studio Code, but more on that later.
The PVS-Studio plugin enables you to:
Here's what the plugin interface for Visual Studio Code looks like:
Qt Creator
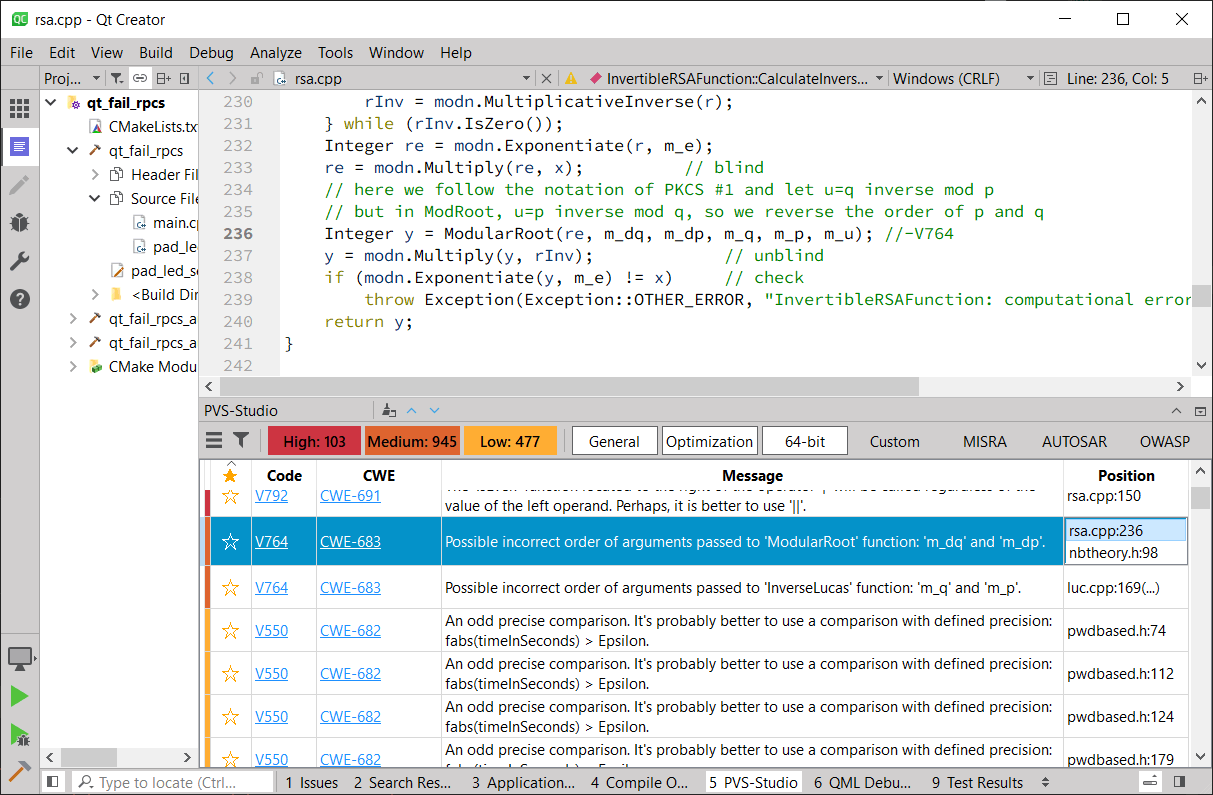
The current version of the PVS-Studio plugin for Qt Creator, in addition to the analysis, enables you to check QMake, Cmake, and Qbs projects.
It is now possible to use the PVS-Studio plugin for Qt Creator not only on Windows and Linux but also on x86-64 macOS.
That's what the plugin for Qt Creator looks like:
For more details on how to use PVS-Studio in Qt Creator, please consult the documentation.
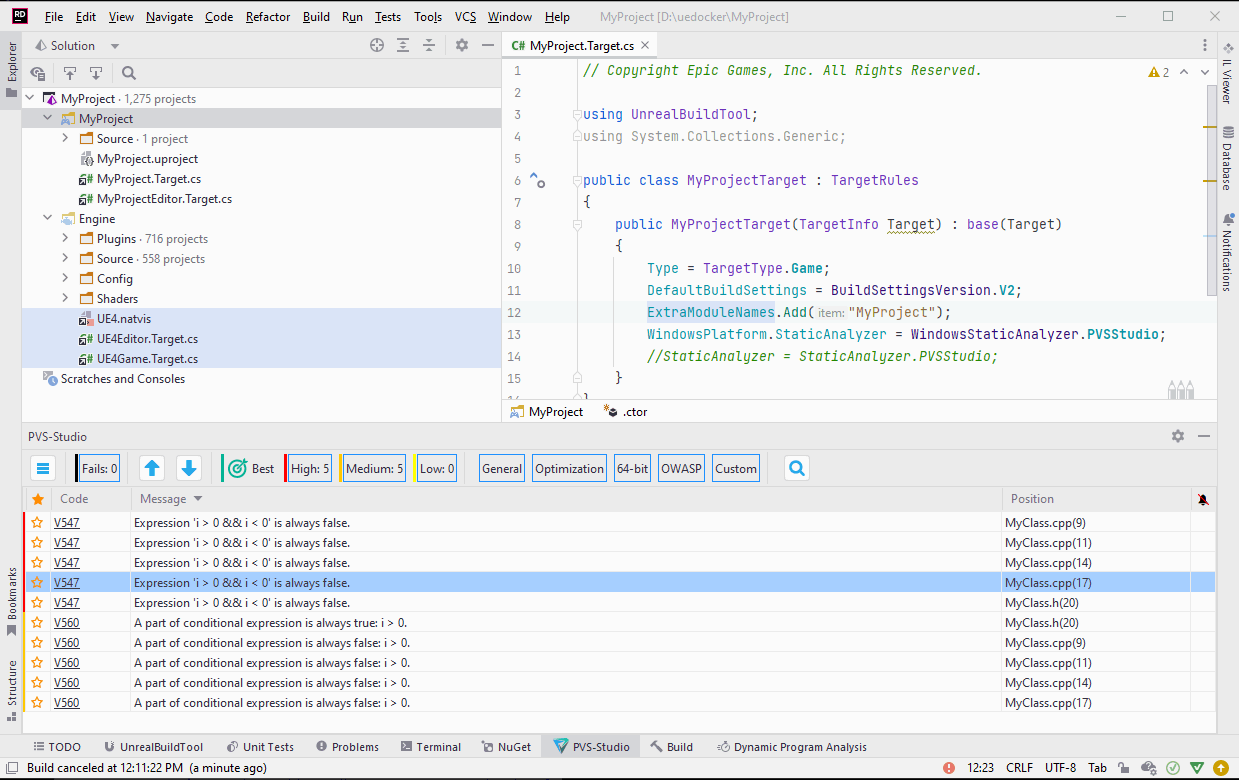
In one of the latest versions of Rider, it is now possible to open Unreal Engine projects directly in Rider. Now, in the PVS-Studio plugin for Rider, you can also analyze Unreal Engine projects that are opened directly in Rider. Documentation will tell you more about that.
The PVS-Studio for Rider looks like this:
You can convert PVS-Studio analysis results into formats used in other tools. The PVS-Studio analysis results can now be integrated with DefectDojo.
DefectDojo is the DevSecOps platform for managing the application security workflow. See the documentation to find out the details of the integration.
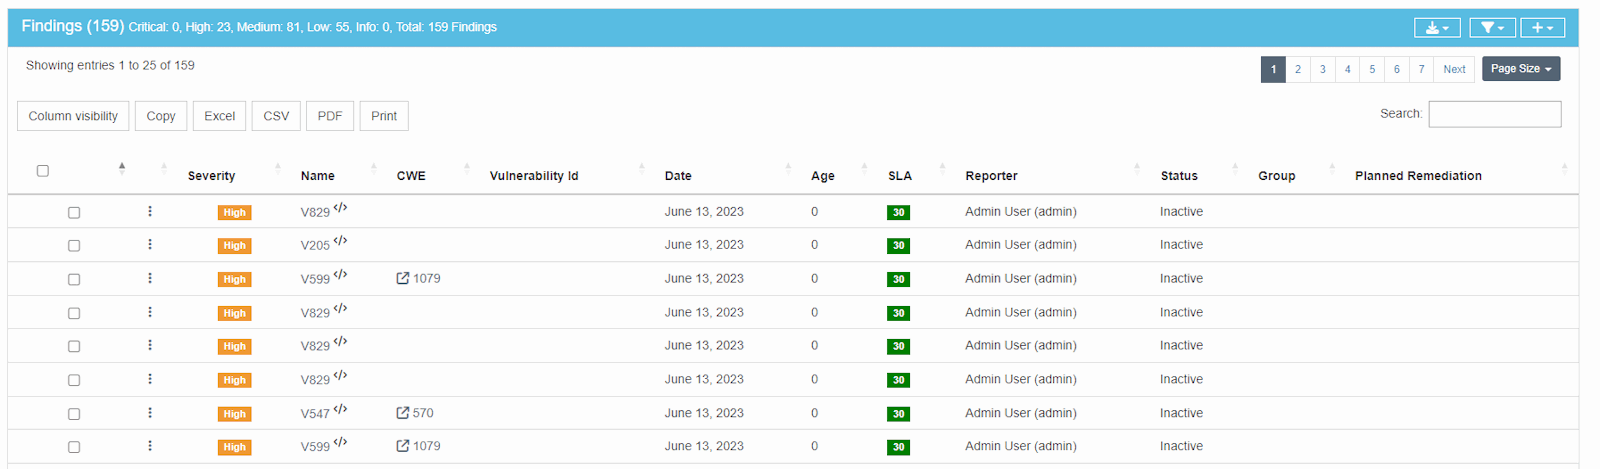
Here's how the analyzer report looks in DefectDojo:
It can be very helpful when you're using multiple tools at once. For example, you can check the code using PVS-Studio, convert the analysis results into a format compatible with TeamCity and continue working in this CI system as well.
PVS-Studio supports the following formats: TeamCity, SARIF, GitLab, MISRA Compliance, DefectDojo, etc. A full list of available formats can be found in the documentation for the conversion utilities.
In 2023, we supported the analysis of .NET 8 and C# 12 projects. The C# analyzer for Linux and macOS now runs on .NET 8 too.
Besides, we traditionally update the analyzer dependencies with the release of a new .NET version: MSBuild and Roslyn. This will allow you to analyze C# projects that use the new syntax and the new SDK.
The PVS-Studio analyzer for all languages (C, C++, C#, and Java) works on three main platforms: Windows, Linux, and macOS.
Now the PVS-Studio analyzer can be used on the ARM architecture on Windows. PVS-Studio works in the x64 compatibility mode.
By the way, in 2024, we plan to implement the native ARM analyzer version for macOS.
PVS-Studio supports cross-platform analysis of projects, regardless of the build system used. The analyzer has a special utility for analyzing cross-platform projects. More details can be found in the documentation.
The Best Warnings filter helps you select the most interesting warnings from all warnings issued on a project. The selection mechanism is based on the analysis of various projects and the most common and dangerous warnings found in them.
This mechanism is especially useful when you are just getting started with PVS-Studio. With it, you can view the most interesting warnings (which are most likely to point out errors) with just one click.
We continue to enhance the filter by adding support for new IDEs and fine-tuning the warning selection mechanism. Learn more on how to use Best Warnings.
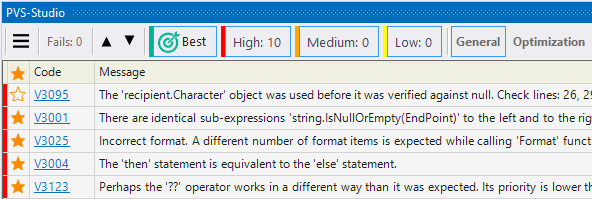
In fact, it's very simple: just click the "Best" button in the analyzer window. There are no more than 10 warnings in the selection — you can quickly view all of them.
If you want to learn more about how to quickly get started with PVS-Studio, I recommend you read the article: "PVS-Studio: 2 features for a quick start".
The analyzer warning suppression mechanism, also called Baselining, can be useful in the following scenarios.
In such cases, analyzer warnings can be suppressed in a special way so that they won't get into newly generated reports. This mode doesn't require modification of the project's source files.
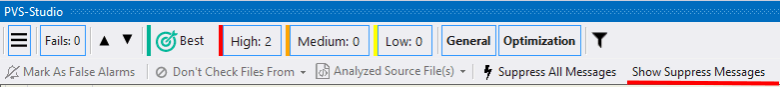
Let's see how you can suppress warnings using the example of the PVS-Studio plugin for Visual Studio:
In Visual Studio, the result of the analysis is displayed in a special window.
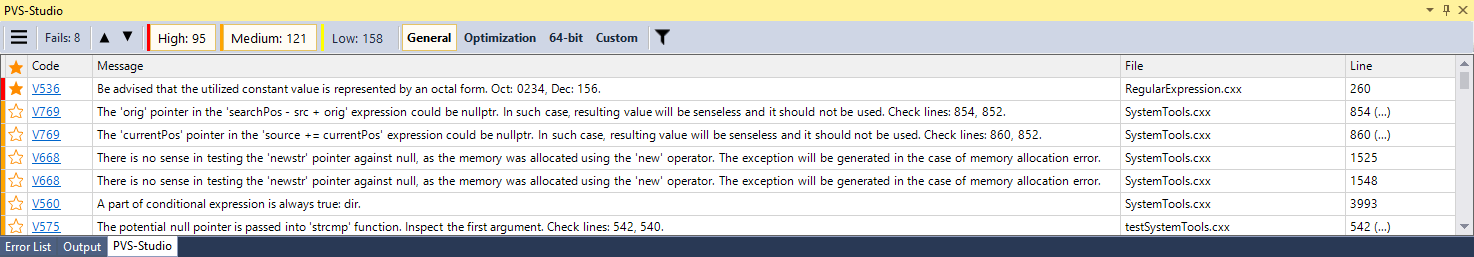
The PVS-Studio window in the IDE provides multiple options for filtering and sorting the analysis results. It is also possible to quickly switch to the documentation of the selected diagnostic rule.
Right-click the message in the context menu to see more options for handling each message.
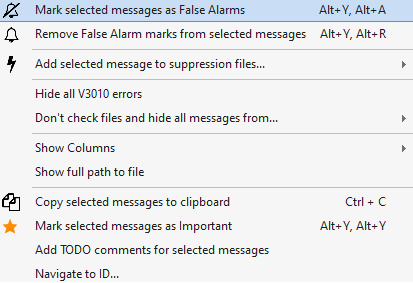
To add selected warnings to all warning-related suppress files, there is a menu item "Add selected messages to all suppression files".
Moreover, there is another menu item: "Add selected messages to primary suppression files". It enables you to suppress warnings in primary suppress files only. If you want to suppress new warnings only in a particular suppress file but have other suppress files with previously suppressed warnings that you do not want to modify, mark your suppress file for new warnings as primary.
When a warning is selected, the context menu provides items not only for suppressing/unsuppressing, but also for moving it. When moved, the warning is removed from all suppress files and added to the selected suppress files.
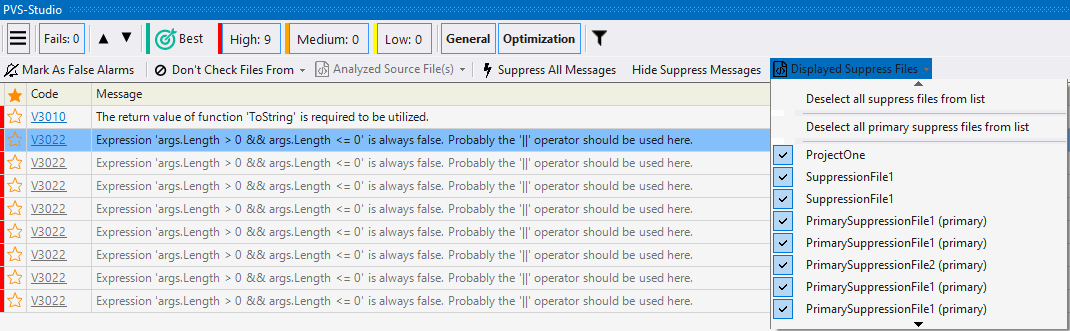
Then, you can return to the suppressed warnings at any time by enabling their display.
Moreover, in the table submenu, when suppressed warnings are displayed, a list with the displayed suppress files appears. Ticking or unticking this checkbox enables or disables the display of suppressed warnings in specific suppress files.
You can find more information on suppress files in the documentation.
We extended the suppress file handling features for Visual Studio. The project used to have only one suppress file. Now the project can have several suppress files.
The new suppression mode appeared in PVS-Studio_Cmd.exe and pvs-studio-dotnet. This mode can be used to work with suppress files from the command line.
You can use the command to create suppress files for each project of the solution:
PVS-Studio_Cmd.exe suppression -m CreateEmptySuppressFiles ^
                               -t JulietTestSuite.sln ^
                               -P myPrefix%projName%myPostfix.suppress
This command adds a respective suppress file to each project. The name of the file is generated based on the name of the related project.
Now you can also suppress warnings based on certain criteria:
PVS-Studio_Cmd.exe suppression -m Suppress ^
                               -t JulietTestSuite.sln ^
                               -P myPrefix%projName%myPostfix.suppress ^
                               -R JulietTestSuite.plog ^
                               --groups "GA:3|OWASP"
The specified command suppresses warnings from the 'JulietTestSuite.plog' report into suppress files that match the pattern passed via the '-P' parameter. In this case, only Level 3 warnings of the General Analysis group and all warnings of the OWASP group are suppressed.
All the features of the new mode are described in the documentation.
The pvsconfig configuration file provides additional settings for analyzing and filtering analyzer messages.
Example:
//-V::3022,5623:1,3It disables the 'High' and 'Low' level warnings for V3022 and V5623 diagnostics.
Sometimes only one or a few rules from a group of diagnostic rules need to be enabled. Now you can enable them using pvsconfig files. Simply disable the diagnostic group and then enable a specific diagnostic rule. For example, like this:
//-V::MISRA
//+V::2511,2578
Another new feature is to explicitly prioritize pvsconfig files. It comes in handy when the settings of different configuration files conflict with each other. For example, one of the files may disable some diagnostic rules while the other may enable them.
It is now possible to specify the priority of the pvsconfig file. To do this, you need to add the following line to the configuration file:
//CONFIG_PRIORITY::1The lower the number, the higher the priority of the file. If there is no directive, the files are prioritized according to their filenames.
With the new setting, you can now specify the paths in the analyzer report to be set relative to the solution directory. The feature will make it easier to handle the analysis report when spreading it between the machines with different directory structures. To do this, specify the following parameter:
//V_SOLUTION_DIR_AS_SOURCE_TREE_ROOTYou can read more about using the pvsconfig diagnostic configuration files in the documentation.
PVS-Studio keeps enhancing the analysis of Unity Engine projects! This year, we added a new group of diagnostic rules for Unity projects aimed at source code optimizations.
The following diagnostic rules are currently presented:
You can learn more about analyzing Unity projects in the documentation.
If you want to learn more about how to optimize a Unity project with PVS-Studio, I advise you to read the note: "PVS-Studio helps optimize Unity Engine projects".
Let us remind you that PVS-Studio works with projects both on Unreal Engine 4 and Unreal Engine 5.
From time to time, when checking projects with PVS-Studio, users might encounter issues with high memory usage and analysis slowdown. They were caused by using the system of merging translation units into a single file (Unity Build).
Although the merging of translation units may have a positive impact on the compilation time, the large file size may increase the resource requirements for analysis.
We have added a new section to the documentation on analyzing Unreal Engine projects that describes how to configure the analysis without Unity Build while keeping the opportunity to use this mode for building the project.
As we have already mentioned, in one of the latest versions of Rider, it is now possible to open Unreal Engine projects directly in Rider. The PVS-Studio plugin also supports analysis in this mode! For further details, please consult the documentation.
The null-forgiving ('!') operator in C#
In C# 9, the language got the option to conditionally split reference types into those that allow null and those that do not. You can read more about it in the official Microsoft documentation.
When a reference variable can be null, '?' is added to its type name. If, in a particular case, this expression does not return a null reference, developers can use the null-forgiving operator ('!'). Here is an example:
bool _returnText = false;

void Foo()
{
  _returnText = true;

  string value = GetText()!;
  _ = value.Length;
}

// may return null
private string? GetText()
{
  return _returnText ? "some text" : null;
}
The GetText method may indeed return null in some cases, but the result of its call inside Foo is definitely the "some text" line. By marking the call with the '!' postfix, a developer tells the compiler that the expression is not equal to null.
Now the analyzer considers the null-forgiving operator when issuing warnings. PVS-Studio won't issue warnings about dereferencing a potential null reference if an expression is marked with '!'. However, a warning will still be issued if null is the only possible value of the expression.
New features of C and C++ code function annotation
Function annotations help PVS-Studio get additional information that can be used during analysis.
In the C++ analyzer, we have enhanced the user annotation mechanism. Now it is possible to write annotations for functions at any nesting level. You can also use the function name without specifying the class and namespace when annotating.
Guidelines for user annotations can be found in the documentation.
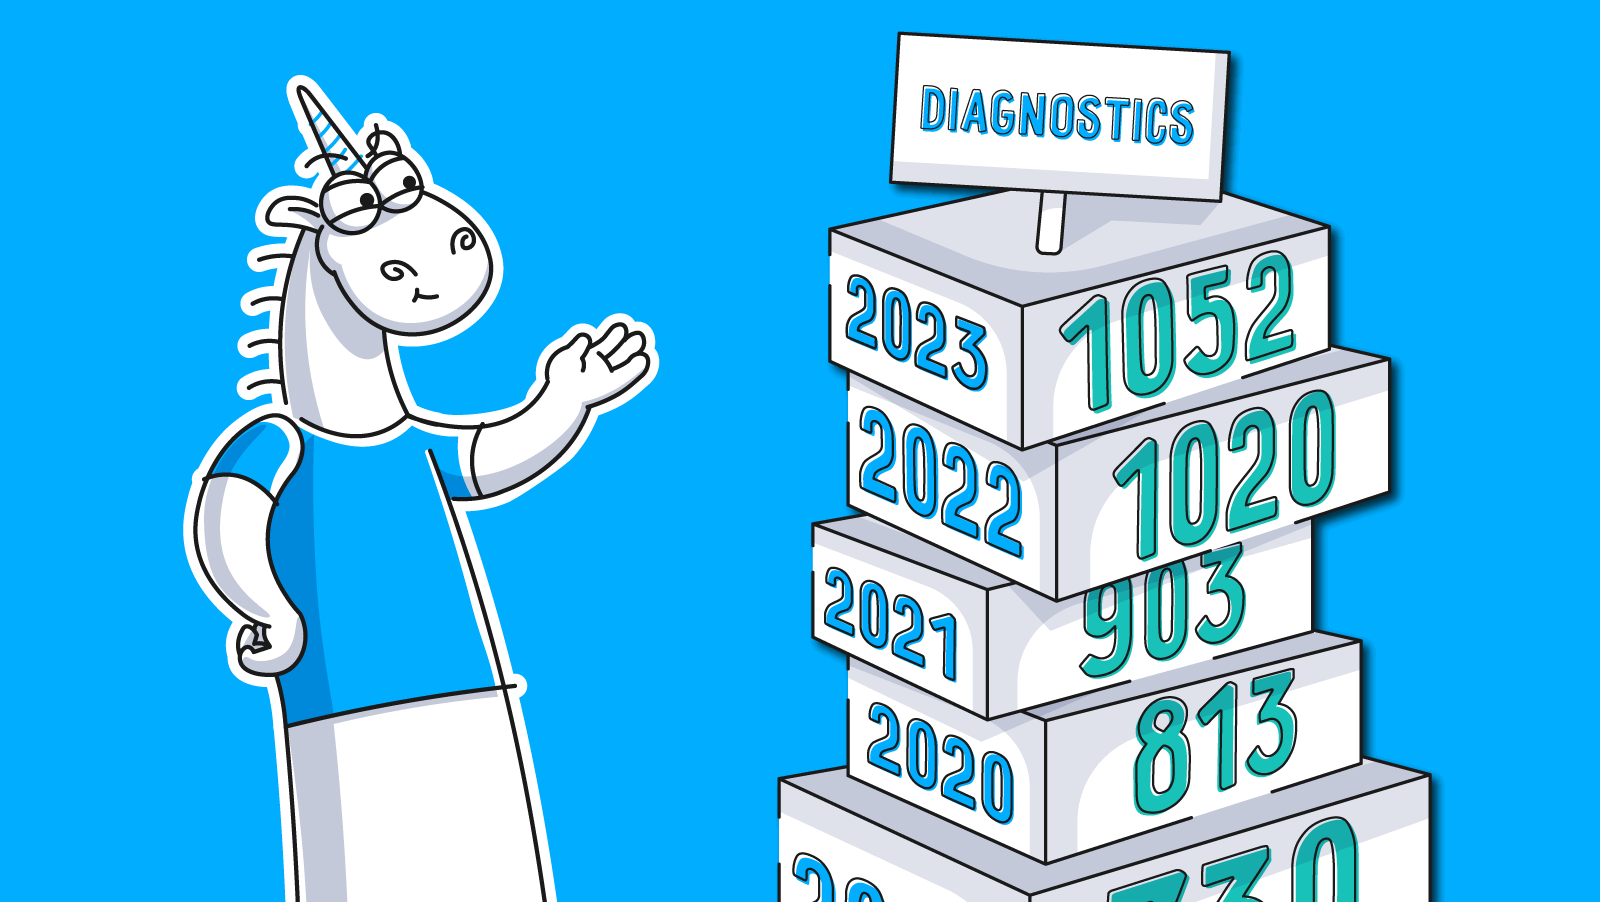
In 2023, we have added 32 new diagnostics. The evolution of the analyzer can be seen clearly in the graph of the diagnostics' quantity:
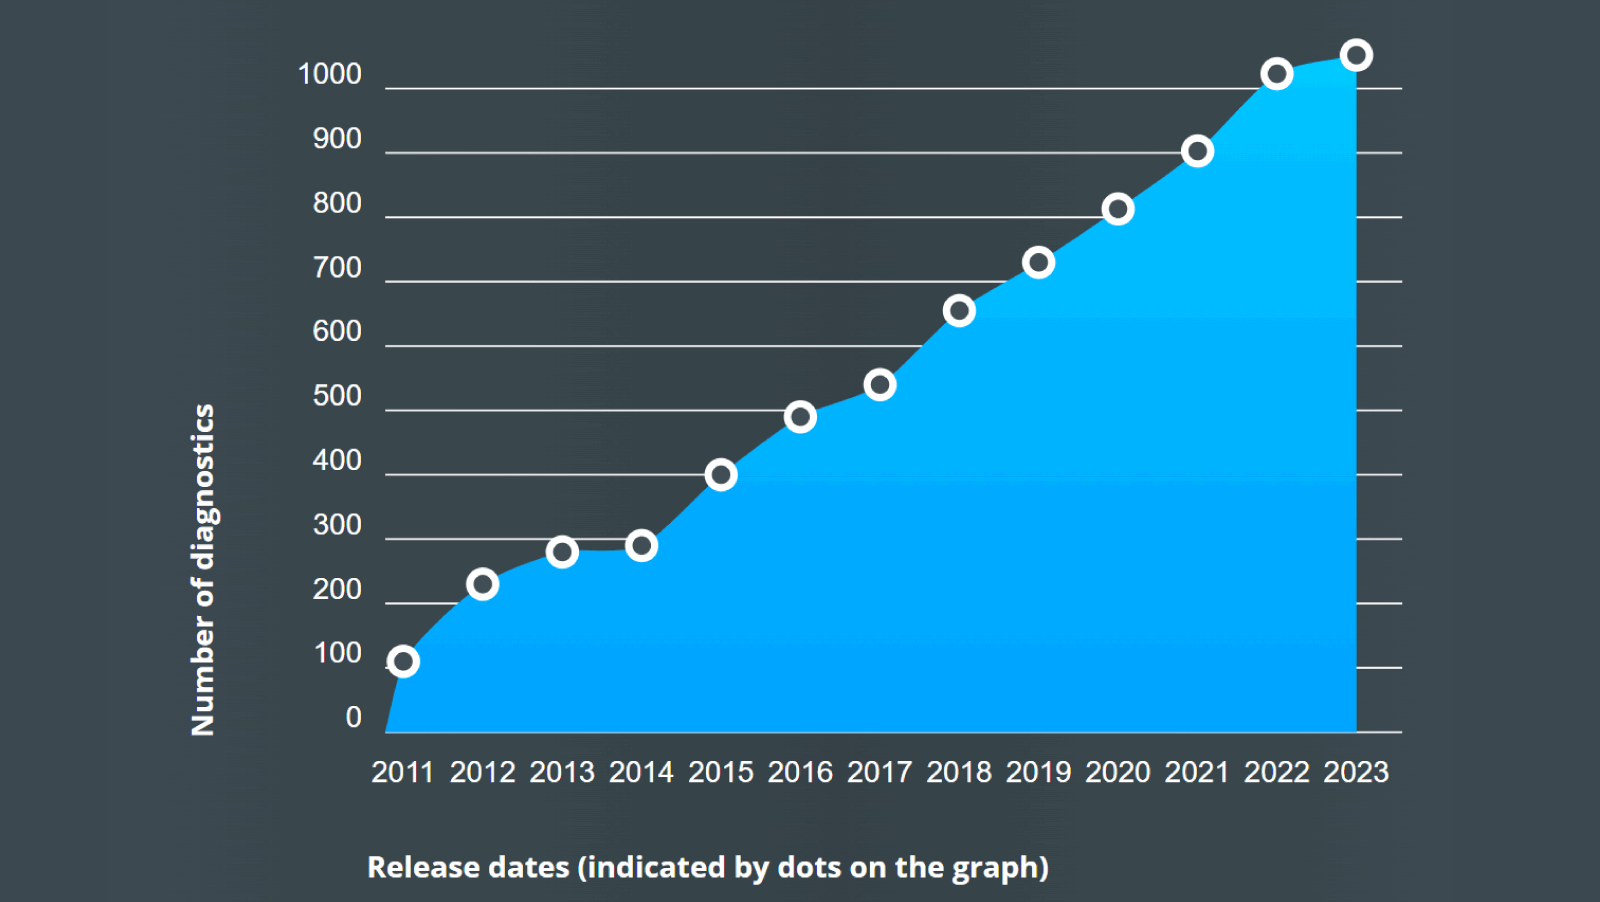
Below, you can find the full list of diagnostic rules that have been added in 2023.
For the C and C++ analyzer: V837, V838, V1093, V1094, V1095, V1096, V1097, V1098, V1099, V1100, V1101, V1102, V1103, V2020, V2623, V2624.
For the C# analyzer: V3184, V3185, V3186, V3187, V3188, V3189, V3190, V3191, V3192, V3193, V4001, V4002, V4003, V4004, V4005.
For the Java analyzer: V6107.
A full list of the analyzer's diagnostic rules is available on this page.
In 2023, we made it possible to create and use a personal user account on the PVS-Studio website. The registration and authorization buttons can be found in the website header by hovering over the icon:
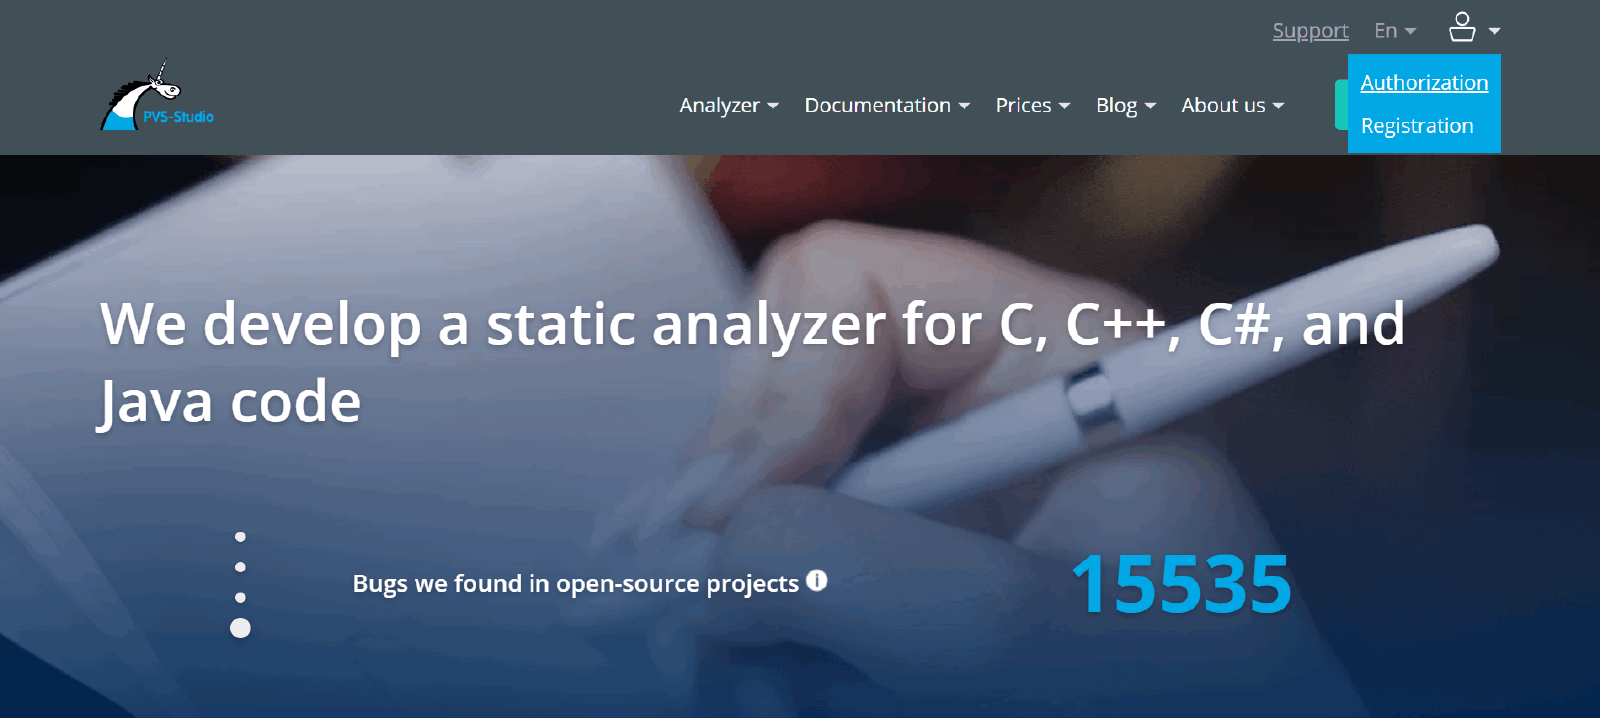
Your personal account enables you to:
All are welcome to sign up!
Read more about the personal account in this note.
We updated the documentation on analysis in commit and branch merge mode.
We revised the documentation on analysis in commit and branch merge mode (pull/merge request). The documentation now also has separate pages on using the analyzer in AppVeyor (here) and Buddy (and there).
We completely revised the Java analyzer documentation.
Now each usage scenario has a separate documentation section.
We enhanced the documentation on integrating analysis results into SonarQube.
We also updated the documentation on the integration of analysis results into SonarQube. We've got some information on how to use the PVS-Studio C# analyzer together with SonarQube for Linux and macOS. You can find the guidelines here.
We tried to overview all the important updates in the analyzer for 2023, but even so, we only covered a part of it. A full list of changes can be found on the release history page.
If you want to keep up with the latest updates, subscribe to our release digest (and there is also a newsletter with IT events for developers!).
What features would you like to see in PVS-Studio in 2024? Drop your ideas in comments!
Don't forget to update to the latest version of PVS-Studio! All the new features described are already available. You can always find the latest version here.
0
0
0

0