Modern applications have lots of code. And the C++ language doesn't get easier. Nowadays, code reviews are not enough to fully analyze program code. Here's where static code analysis comes in.
C++ programmers face two main challenges — modern projects size and the C++ complexity. Now, it's hard and even impossible to keep everything in mind. As a result, programs have lots of errors; costs to test and maintain the code increase. Let's find out why it happens.
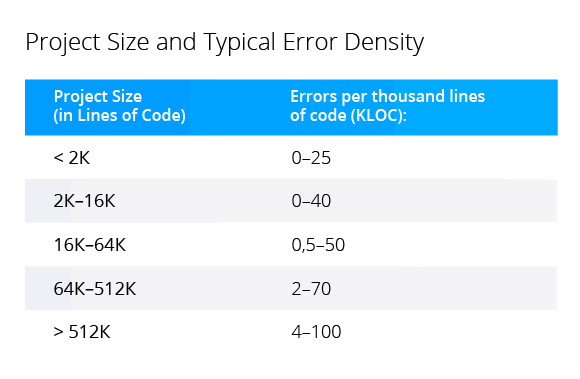
The project gets bigger - error density increases. Large projects have more implicit relationships between different parts of code. It's tricky to change code without crashing something.
Well, nothing new. For example, Steve McConnell described the effect of increasing error density in "Code Complete". He refers to "Program Quality and Programmer Productivity" (Jones, 1977), "Estimating Software Costs" (Jones, 1998).

Even though we completely understand the situation, it doesn't get easier. The number of high- and low-level errors increases. Most often high-level errors appear because programmers misunderstand the work of other parts of the program. As a result, we have wrong interactions between different parts. Low-level errors may occur because programmers fixed something in the code but failed to take into account the consequences.
Take a look at the error that once appeared in the CovidSim project. Note that the fix was simple, but an error still got into the pull request. Most often such errors occur in large and complex code due to inattention.
In the original code, memory is allocated on the stack:
char buf[65536], CloseNode[2048], CloseParent[2048];The programmer decided that it is wrong and allocated dynamic memory:
char* buf = new char[65536];
char* CloseNode = new char[2048];
char* CloseParent = new char[2048];
However, the coder hurried up and added delete [] statement calls at the end. At first glance, the programmer fixed the code, in fact, we have unreachable code and a memory leak:
int GetXMLNode(....)
{
  ....
  if (ResetFilePos)
    fseek(dat, CurPos, 0);
  return ret;
  delete[] buf;
  delete[] CloseNode;
  delete[] CloseParent;
}
It's better not to use manual memory management – use smart pointers or std::vector. However, that's a separate topic. The fact that the error occurred in a real project is crucial.
You can find such errors during code reviews, but sometimes it's not that easy. The situation gets complicated if your code is in different files.
For example, a programmer got carried away by shortening names via macros:
....
#define scout std::cout
#define sstringstream std::stringstream
#define sofstream std::ofstream
#define sifstream std::ifstream
#define sfstream std::fstream
....
In addition to other shortenings, the header file contains the following macro:
#define sprintf std::printfAs a result, the sprintf function is broken in a completely different place:
char buf[128];
sprintf(buf, "%d", value);
This is a real error, found in the StarEngine project.
Looking at these simple and obvious errors in isolation, you may wonder how anyone could miss them. The larger the project – the easier it is for such errors to appear, the harder it gets to find them during code reviews.
The C++ language is evolving. It allows you to write more concise and secure constructions. But there's a downside. The language changed a lot. Now it's hard to study all its aspects and use constructions correctly. Moreover, a programmer may accidentally forget about some language features.
Let's take range for as an example. On the one hand, it can protect from one of the classic 64-bit errors.
void foo(std::vector<char> &V)
{
  for (int i = 0; i < V.size(); i++)
This code could have worked successfully in a 32-bit program for decades. A 64-bit architecture allows processing large amounts of data. The number of elements in the vector may exceed the INT_MAX value. As a result, the signed variable may overflow. This is undefined behavior that sometimes appears in a strange way.
Using range-based for loops, you make such code shorter and safer:
for (auto a : V)Now the container size doesn't matter. All elements are processed. Unfortunately, some error patterns are replaced by others. In case of range-based for, for example, a programmer may forget that at each iteration a copy of the element is created, not a reference (unless you specify it). An example of such an error from the Krita project:
const qreal invM33 = 1.0 / t.m33();
for (auto row : rows) {
  row *= invM33;
}
Here the elements are not multiplied by a constant. The correct code looks as follows:
for (auto &row : rows) {
  row *= invM33;
}
Well, you can say this happened due to inattention, and we exaggerate the language complexity. Take a look at another example. Do you find the following code suspicious?
std::vector<std::unique_ptr<Modifier>> Modifiers;
Modifiers.emplace_back(new LoadModifier(BB, &PT, &R));
Modifiers.emplace_back(new StoreModifier(BB, &PT, &R));
Modifiers.emplace_back(new ExtractElementModifier(BB, &PT, &R));
Modifiers.emplace_back(new ShuffModifier(BB, &PT, &R));
Even LLVM developers didn't find anything suspicious in this code. The code snippet is taken from this project.
Actually, such use of emplace_back is insecure. If the vector needs reallocation, and it cannot allocate memory for a new array, it throws an exception. As a result, the pointer returned by the new operator is lost. A memory leak occurs. Here's the more accurate way to write the code:
Modifiers.push_back(
  std::unique_ptr<LoadModifier>(new LoadModifier(BB, &PT, &R));
Of course, if we deal with small arrays, such as those created in LLVM, the danger seems far-fetched. However, such code is unacceptable in a project with large arrays. Do you know about such potential error? It seems like an easy one, but in C++ you can't bear everything in mind. You encounter lots of minor nuances. Actually, these nuances are frequently described in books. For example, "Slippery C++" by Stephen C Dewhurst.
Let's sum it up
Modern projects size and intricate C++ make it harder to write safe, high-quality code. As we speak, projects get bigger, and the language gets complicated.
Technologies that we used 10-20 years ago are insufficient to ensure modern code quality.
So to say, code reviews, unit testing, and testing are enough to write MS-DOS 1.0. But this is not enough to develop ClickHouse. Why?
Because MS-DOS 1.0 contains 12 thousand lines of assembly language code. And ClickHouse consists of more than 500 thousand lines in C++.
Note. Assembly language is considered to be more difficult than C or C++. "Verbosity" of assembly language is to blame. You just have to write a lot to achieve the desired result :). With an equal number of lines, a C++ program is more complicated than an assembly program.
So, we figured out why we need to use new technologies to cope with the complexity to develop reliable code.
Some time ago programmers used code reviews and manual testing to ensure software quality. Then unit tests and testing (TDD) stepped forward. Nowadays, software project development without unit testing seems strange. Later, dynamic, and static code analyses were meant to improve code stability and quality.
Written above is very conditional! Developers use static analyzers since time immemorial. However, over the past decade they've reached a higher level. Modern static analyzers are not "linters" that programmers used 20 years ago.
Dynamic analyzers have changed a lot too. Now sanitizers are a part of the development process for most projects. However, today I want to talk about static analyzers.
Static code analysis is a code review performed by a program. The analyzer shows the programmer suspicious program fragments. These warnings help the code author to decide whether to fix the code or leave it at that (suppress the warnings).
Static code analysis does not substitute usual code reviews! It enhances them. Code reviews help to share experiences, train new employees, find high-level defects and design errors. On the other hand, static analyzers keep pace with the times and easily find typos unnoticed to humans (examples: 1, 2, 3).
Static analyzers do not compete with dynamic analyzers or other error detection techniques. Now developers must use various approaches in an integrated way to achieve high quality, safe code in large projects.
Here are specific examples of how static code analyzers make code cleaner, better, and safer. Let's take the PVS-Studio static code analyzer. You can use it independently and as a plugin for Visual Studio, SonarQube, and so on. Now let's use the PVS-Studio plugin for CLion, IDE by JetBrains.
By the way, JetBrains CLion has built-in static code analysis that highlights suspicious constructions when you write code. Nevertheless, it makes sense to consider external code analyzers. Each analyzer has its own strengths. Two static analyzers are better than one :).
Let's take Poco and Boost projects from GitHub, open them in JetBrains CLion, check them using the PVS-Studio plugin and discuss some warnings.
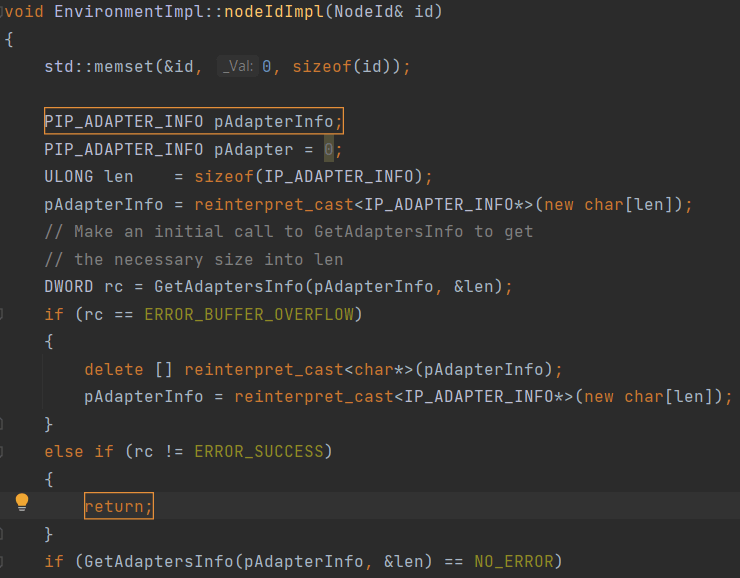
Checking the Poco project, we receive a memory leak warning. An array is dynamically allocated. The pAdapterInfo variable stores the array's address. The programmer chose manual memory management that is fraught with errors. It is difficult to control all program execution paths. You must be sure that they all contain code to free up memory. That's what happened here: the return operator may terminate the function without calling the delete [] operator.

The PVS-Studio warning: V773 The function was exited without releasing the 'pAdapterInfo' pointer. A memory leak is possible. Environment_WIN32U.cpp(212), Environment_WIN32U.cpp(198)
The programmer's inattention provoked the error, but the analyzer found it. However, bad coding practices are responsible for this error. It's better to use smart pointers in such cases. Here we need to recall the idea that static analysis can't replace code reviews and programmers. An analyzer can find an error. But it can't teach a programmer – it is a complex process; people are responsible for it. During code reviews and errors analysis, we must train our colleagues to write safe and secure code.
Thus, programmers and their higher-ups learn about errors found. It's not enough for a programmer to fix a bug. It is important to teach them to write better code to minimize the number of errors. PVS-Studio has the blame-notifier utility for such purposes. Well, let's go back to static code analysis.
Here's another error occurred in the Poco project due to inattention. The code seems meaningful. Take a closer look – the part of the condition is always true.
To see the error, we immediately say that the POLLOUT constant is declared in the WinSock2.h system file as follows:
#define POLLWRNORM  0x0010
#define POLLOUT     (POLLWRNORM)
The PVS-Studio warning: V617 Consider inspecting the condition. The '(0x0010)' argument of the '|' bitwise operation contains a non-zero value. PollSet.cpp(398)
The & operator is what we need here. A usual typo.
Magicians never reveal their secrets. Do that — the magic's gone. Everything's getting obvious and boring.
Static analysis gives a similar effect. Looking at this error, you wonder how it could appear and why no one noticed it during code review. It seems that static analysis wants to trick us. It detects obvious and common errors. However, even such simple errors appear in the code and cause troubles. People tend to overrate their attentiveness and accuracy (1, 2, 3). Static analysis tools are useful because they can't get tired. These tools check even the most boring code.
Previously, we talked about errors obvious for any programmer. However, static analyzers can help to find defects of "hidden knowledge". The programmer may not know about some error patterns. They don't know that you can't write code that way.
A great example — you cannot call functions inside DllMain. If the programmer's lucky (the sequence of loading the DLL), the code runs. The programmer may be unaware of the incorrect code because the program works. Details.
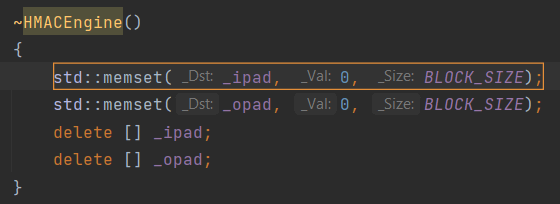
Another good example is secret data stored in memory. Let's discuss the same Poco project. In the destructor, the programmer plans to clear some private data, and then deallocate buffers containing data.
If you don't know subtle aspects, everything seems fine. In fact, we have a common security defect CWE-14 (Compiler Removal of Code to Clear Buffers).

PVS-Studio warnings:
Compilers, optimizing the code, may remove the memset function call. Moreover, they really do it. In terms of the C++ language, it's redundant to clear memory. Certain values fill the memory, then it is immediately deallocated. So we can remove the memset function call. For more details, read the article "Safe Clearing of Private Data".
In terms of C++ the compiler is right. The compiler does not know that memory contains private data – it is a higher-level concept. Unfortunately, many programmers don't know about it either. You can find similar errors in projects such as Crypto++, XNU kernel, MySQL, Sphinx, Linux Kernel, Qt, PostgreSQL, Apache HTTP Server, and so on.
Static analyzers can find various similar defects. This is extremely useful if we're dealing with potential vulnerabilities. Especially, in large projects. How to know that we don't have any unsecured data in legacy code? What if an attacker found a vulnerability and has been secretly exploiting it for 7 years?
We discussed that the C++ language is complex. So, it's difficult to write safe code. Let's prove it with a code snippet from the Boost library.
First, we need to show how the i member is declared.
typedef long int_literal_type;
typedef unsigned long uint_literal_type;
....
union {
  int_literal_type i;
  uint_literal_type ui;
  bool b;
} value;
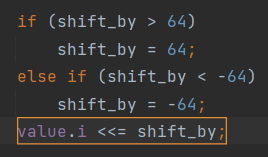
Now take a look at the incorrect code:

The PVS-Studio warning: V610 Undefined behavior. Check the shift operator '<<='. The right operand is negative ('shift_by' = [-64..64]). cpp_expression_value.hpp(676)
The programmer limits the value of the shift_by variable to the [-64..64] range. So, they want to shift the value of the signed i variable to the left or right. But that's wrong! This is undefined behavior. The standard states:
The type of the result is that of the promoted left operand. The behavior is undefined if the right operand is negative, or greater than or equal to the length in bits of the promoted left operand.
This code violates the standard twice. Firstly, you can't use negative values in the second operand. Secondly, 64 is a bit large, even if int_literal_type is always represented by a 64-bit type. In general, it's better not to shift a signed variable since we have its unsigned analog.
It's better to write as follows:
if (shift_by <= -64 || shift_by >= 64)
{
  value.ui = 0;
}
else if (shift_by < 0)
{
  value.ui >>= -shift_by;
}
else // shift_by > 0
{
  value.ui <<= shift_by;
}
Yes, the code is longer but there's no undefined behavior.
There are many different code analyzers: List of tools for static code analysis. They all have their strengths and specific features, applicable in different scenarios. It's a challenge to choose a static code analyzer. This topic is beyond the scope of the article. However, here are some tips to get started.
First. Try to understand what you want from a static analyzer. Then, try analyzers that match your needs and decide which one is suitable for you. For example, you need the analyzer to support your programming language, support your IDE, integrate into your CI/CD.
Take a look at another example. Let's say you develop software for embedded systems, and your code must comply with the MISRA standard. In this case, you definitely need the analyzer that supports the standard. For example, the analyzer embedded in the CLion IDE. CLion immediately highlights code that does not comply with the MISRA standard (see MISRA checks supported in CLion). With this feature, you can write code that largely meets the requirements of embedded systems. However, it's not enough if we want to receive the MISRA Compliance report. In this case, you have to use additional tools or another analyzer. For more details, read the article "Why do you need the MISRA Compliance report and how to generate one in PVS-Studio?".
Second. Take into account whether you need the infrastructure to integrate the analyzer into a large project. All static analyzers issue false positives, especially when used the first time. This can cause problems. To "battle" thousand warnings is a bad idea.
If you use a simple static analyzer, such as Cppcheck, it does not have this infrastructure. Cppcheck is free, but it has one disadvantage – you can't use it right away in the legacy project.
Professional tools such as PVS-Studio provide a baseline. The analyzer can hide all the messages that it is currently issuing. It's a technical debt, you can get back to it later. Baseline helps to view warnings only for new or modified code. The analyzer stores more information than line numbers with hidden warnings. So, the analyzer does not issue warnings for old code if you add a few lines to the file's beginning.
However, we're not going to delve into technical capabilities. What's important is that you can implement the analyzer and use its benefits right away.
Learn more about this topic in the following article: "How to introduce a static code analyzer in a legacy project and not to discourage the team".
We discussed how to choose the analyzer. Now – the most significant part! Anyway, it's not so important which analyzer you choose. The main thing is to use it regularly!
This is a simple but crucial thought. A common mistake is to run code analysis only before the release. This is extremely inefficient – like you enable compiler warnings just before the release. The rest of the time you suffer, eliminating errors with debugging.
For more details, read the article: "Errors that static code analysis does not find because it is not used". It's both funny and sad.
You've taken a tour into the world of static code analysis. Yeah, the article provides lots of sources. It's going to take some time to study them or at least look through them. But I promise that you'll have a complete picture of static analysis afterwards.
Now, it's time to try static analysis! For example, download the PVS-Studio plugin for CLion.
Thanks for your attention. Wish you bugless code!
0