
Our website uses cookies to enhance your browsing experience.

People often see work in support as something negative. Today we'll look at it from a different perspective. This article is about a real communication of 100+ messages, exceptions, the analysis that didn't complete in three days...
Actually, bug reports are great If a bug report is adequately handled from both sides, it means that both the user and the software developer are interested in solving the problem. If both sides achieve the desired result, it's a win-win situation.
Before we proceed to the story, here's a little introduction. We are the PVS-Studio team. We develop the analyzer that searches for errors and potential vulnerabilities in C, C++, C#, and Java code. Yours truly is the team lead of the C# analyzer development team, the author of articles and posts.
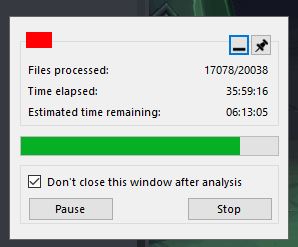
The story starts like this. My teammate comes to me and says: "There's a user with a C# project. His analysis doesn't complete after 80 hours". 80 hours, it's madness!
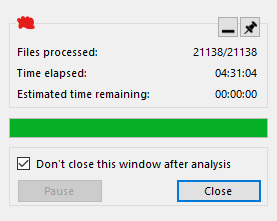
This screenshot shows one interesting detail — the last file. This file remained not analyzed. This means we're dealing with freezing - there is something with this file that the analyzer could not process it in an adequate time.
Let's go further. I go through the message history and clarify a couple of moments. It becomes clear that:
The user: Obviously, your analyzer wasn't designed for testing such solutions. I look at the project code and I think I'll limit myself to the analyzer's warnings. If, of course, the analysis completes. That's it. Doing something else in this nightmare is suicide.
On the one hand, this is an epic fail. It is impossible to collect any more problems. Moreover, we'll have to fix all these problems... It's worth noting that we regularly test our analyzer on various open source projects. We have never met such problems before.
On the other hand, it's a precious find! We were doing other things — supported OWASP and implemented taint analysis, for example — and couldn't think that some projects had such problems! How many people have faced similar problems, but have never contacted our support? This was a chance to enhance the PVS-Studio analyzer for C#, and we could not miss it.
And here you may ask a question...
Of course we do! We regularly run our analyzer on a number of open source projects. Thus, we know the total time of the analysis on all projects. Also, we have information about:
We can track that the analyzer issues the right warnings. It doesn't slow down, doesn't start consuming more memory. If any of these things happen, then we either fix it or accept it as it is.
Roslyn is the 'heaviest' project from our list. It has approximately 11k files for the analysis. The analysis time takes about 1h 45m. The project preparation time takes a couple of minutes. The project size (at least the number of files) can be compared to the user's one. We cannot say the same about the analysis time and preparation time.
It's worth noting that we knew about some performance issues but didn't fix it. Why? Priorities. These issues looked unpleasant. Still, everything worked.. And we had other things to do.
However, to clear my conscience, I'm going to mention some issues we knew about but put them on the shelf.
Inefficient work of the V3083 diagnostic
The V3083 diagnostic searches for unsafe event invocations. These invocations may cause NullReferenceException in multithreaded code.
The dangerous code looks like this:
public event EventHandler MyEvent;
void OnMyEvent(EventArgs e)
{
  if (MyEvent != null)
    MyEvent(this, e);
}
If between the check for null and direct event invocation the event is left without handlers, then an exception of the NullReferenceException type is thrown. You can read more about it in the documentation.
The diagnostic first searched the event declaration and after that — all places of its use. This was a bit weird — it was more logical to start with the unsafe invocation. But we had what we had. To find the places of event invocation, we used the method from Roslyn — SymbolFinder.FindReferencesAsync.
We knew that:
However, everything worked, and this task remained in the to-do list.
Inefficient CPU usage
We noticed this problem on several projects, especially on Roslyn. On Roslyn, at some point, the CPU usage dropped to about 15% and stayed like this for a while. After that it increased again. We noticed this when we first globally optimized the analyzer (you can read about it here). But at that moment we didn't have time to investigate the problem.
Thanks to the user messages, we had a lot of things to do. After breaking the task into subtasks, we gradually began to fix the problems.
Exceptions with stack traces
Nothing tricky here — we just fix it. The problems were on the tree-semantics bundle.
Diagnostics
We identified problems in two diagnostics: V3083 and V3110 Oh, this V3083 again... Our cup of patience was overflowing. In the end we just rewrote it. Here you can read about the result and what performance enhancements we achieved.
Without going into details, we can say that in the V3110 diagnostic the problem related to multiple processing of the same elements. Elimination of their re-processing (all hail associative containers!) solved the problem.
However, at the time of writing this article, we found another code fragment on which V3110 worked too long. We'll get back to it soon.
Other optimizations
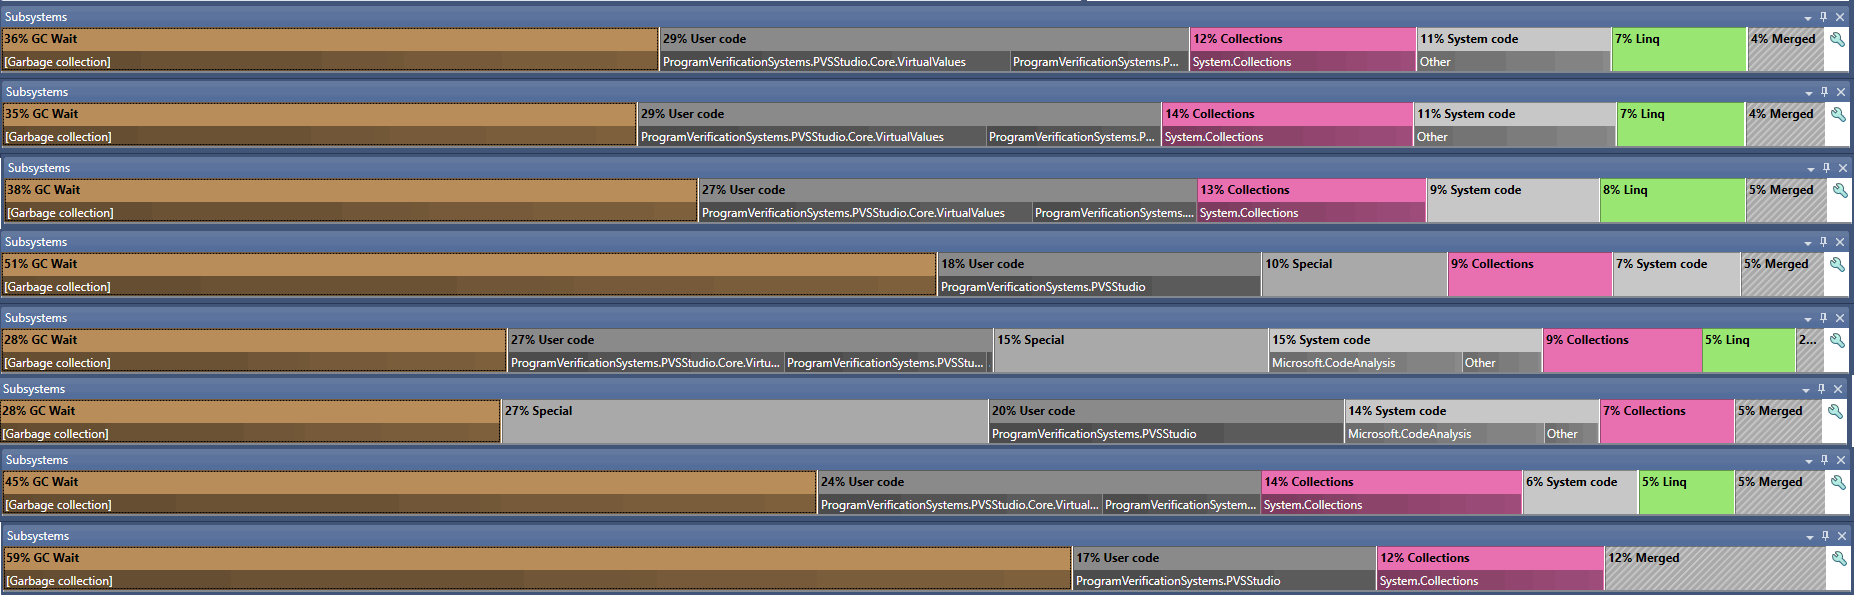
The title is a bit generalized. But it's true — we made a lot of various optimizations. Our main goal was to reduce the pressure on the GC, which we noticed after we profiled the analyzer.
Some fixes were internal: we added cashes here, learned faster evaluations there (like comparing some tree nodes), etc. There's no point in describing them.
If to speak about more general corrections related to C# / .NET — we found a lot of interesting things. For example, I discovered that calling GetHashCode for enumeration elements (enum) leads to their boxing. Only in .NET Framework, though. Everything is fine with .NET — no boxing. You can read about the nuances with the boxing in a separate article.
After the profiling, we identified and locally fixed the problematic places that we didn't even think about. LINQ, for example. There are a lot of places with LINQ in the analyzer. However, in some places it's better to refrain from using it. I described various optimizations in this article.
I want to highlight the simplest (in terms of corrections) fix that significantly increased the analyzer performance. We changed the GC's working mode. We somehow didn't think about it. One of the users gave us this idea in the commentaries to an article about optimizations.
As a result, we significantly reduced the analysis time of our test base's large projects.
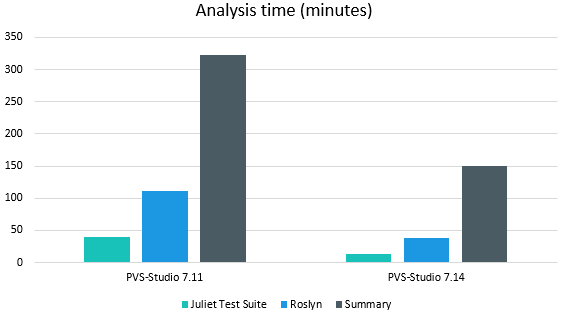
For example, the analysis time for Roslyn has decreased by more than 2 times!
At the same time, we solved both problems mentioned above. We rewrote V3083, and the analyzer used CPU resources properly.
It's high time to give the user our beta! In fact, we gave two - one with edits and one with GC's new mode.
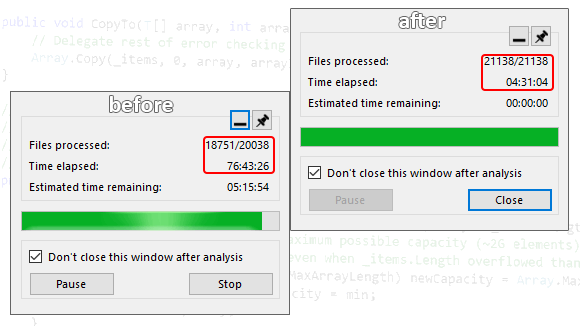
The analysis progress with the first beta looked like this:
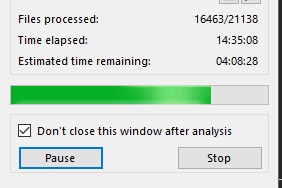
The result speaks for itself! 14.5 hours versus 36. 16.4k analyzed files versus 17k files. This is awesome. But still not enough. We wanted it to be faster.
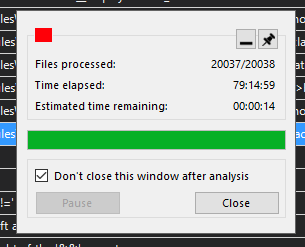
The second beta included both optimizations and new GC mode. You can see the results below:
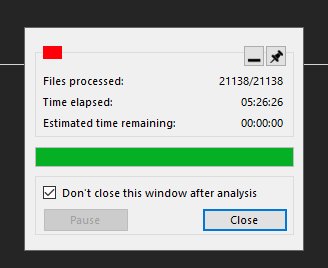
The user: Wow! .config did a miracle.
Awesome! It turns out everything was done for a reason.
However, there was one more problem - the project preparation stage lasted several hours.
The optimizations described above related to the project analysis. They did not affect the project preparation stage at all. We hoped that the new GC mode would solve the problem. Alas, it was in vain. So, we had another round of enhancements ahead — we had to optimize the project preparation stage.
The user: Project preparation stage completed. It went from 10:13 to 13:08, 2:55.
The user's project preparation time varied somewhere between 2 and 3 hours. 2:55 was rather an exception, in general it was 2 hours. Anyway, 2 hours of preparation with 5.5 hours of analysis is unacceptable. Forget the analysis time, what kind of preparation lasts for several hours?!
By the way, what is the project preparation stage? At this stage, the analyzer evaluates projects, restores dependencies (if necessary) and much more. Moreover, the analyzer performs many of these actions with Roslyn and MSBuild. And this was the reason of my concerns. Since the MSBuild and Roslyn code is external (we use NuGet packages), we cannot edit it. You may guess that if the freezing occurs in those libraries, this is bad.
However, we easily figured out who caused the problem. We were the ones who messed up. It turned out that the analyzer could sometimes assume that the project has tens of thousands of dependencies. We easily reproduced this problem on a synthetic example.
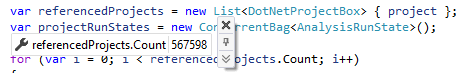
500k dependencies — impressive, right? The problem was in the way the analyzer processed project's transitive dependencies. The analyzer did not take into account the uniqueness of the dependencies. The same projects could be processed over and over again. I described this in a separate article.
What we needed to do was not to re-process the same dependencies. We fixed it, sent the beta to the user, and...
The user:
15:50 solution scan launched
15:51 project check started
15:54 the check compleWHAT?! What kind of magic is this? 4 minutes instead of two hours?
The fix hit the target, and we were pleased. :) The graph below clearly demonstrates the project preparation time difference before the fix and after.
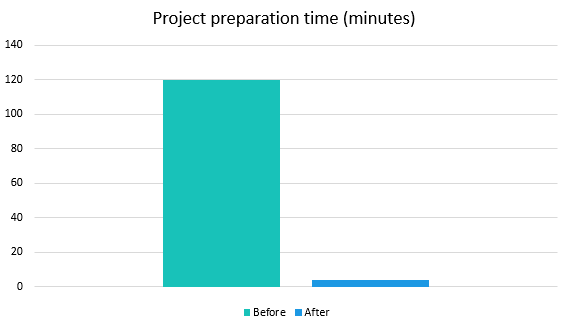
By the way, it was a funny situation. The problematic code has been in the analyzer since ancient times. And no one complained about the time of the project preparation stage. However, when I started inspecting the problem, several people wrote to me. They had a similar situation with long preparation.
I repeat: we didn't cause it with our optimizations. But it was a funny coincidence. Several people decided to try the analyzer for C#, encountered this problem, and contacted our support almost simultaneously. Someone, for example, decided to check C# projects in addition to the C++ ones. Another user decided to check their project with our analyzer and got this problem. I know that the fix above helped about 4 users.
We started with:
We ended with:
Bonuses:
We can look at the situation in different ways.
On the one hand, we can say that everything is terrible, nothing works, and life is pain. Exceptions are thrown, we have freezes, the analyzer is slow.
On the other hand, we see this situation as an opportunity to make our product better. We helped this user and many other. Who knows how many people have encountered this but never contacted support?
I like the second option more. I think we should see more opportunities around us. See more good things in life and especially in the things we do at work.
Isn't it cool to do what brings you pleasure? Sometimes we need to see things from a different perspective.
By the way, if you still don't use the static analysis — this is a sign for you to start. Don't forget to subscribe to my Twitter so as not to miss anything interesting. ;)
I want to say a big thank you to the user. Thanks to him, we made the described optimizations. And thanks to him I wrote this article. Communication in 100+ emails is a big thing. You must have a huge patience to wait 80 hours for the analysis to complete.
Thank you to the contribution in the analyzer's development!
Here are the links mentioned in the article. They describe in detail the C# / .NET peculiarities that we had to face. They also describe the problems that were fixed and the process of fixing.
0
0
0
0