
Our website uses cookies to enhance your browsing experience.

We know many ways to detect performance problems, such as extremely low speed and high memory consumption. Usually tests, developers, or testers detect such applications' drawbacks. In the worst case, users find weaknesses and report back. Alas, detecting defects is only the first step. Next, we should localize the problem. Otherwise, we won't solve it. Here comes a question - how to find weak points that lead to excessive memory consumption and slow down in a large project? Are there such at all? Maybe it's not about the application? So now you're reading a story how PVS-Studio C# developers encountered a similar problem and managed to solve it.
It takes some time to analyze large C# projects. It's not a surprise, since PVS-Studio plunges deep in source code and uses an impressive set of technologies: inter-procedural analysis, data flow analysis, etc. But still analysis takes no longer than a few hours even for many large projects we find on github.
Take Roslyn, for example. More than 200 projects in its solution! Almost all of them are in C#. Each project contains far more than one file. In turn, in files we see far more than a couple of code lines. PVS-Studio checks Roslyn in about 1.5-2 hours. No doubts, some of our users' projects require much more time for a check. But cases of one-day checks are exceptional.
This is what happened to one of our clients. He wrote to our support team that his project's analysis hasn't completed in... 3 days! Something was clearly wrong. We couldn't leave a problem like this unaddressed.
Surely the reader has a logical question - why didn't you spot the problem at the testing stage? How did you let a client reveal it? Isn't PVS-Studio C# analyzer tested by developers?
But we do test it head to toe! Testing is part and parcel of the development process for us. We constantly check the analyzer for correct operation as a whole, the same as we do for its individual parts. Unit tests of diagnostic rules and internal functions are literally a half of the total C# analyzer source code. What's more, every night the analyzer checks a large set of projects. Then we check if the analyzer's reports are correct. We automatically track both the analyzer's speed and the amount of memory consumed. Developers instantly react to more or less significant deviations - detect and look into them.
Sad but true - this whole pack of tests didn't help to keep the user out of the problem. Taken aback by what happened, with no time for regrets, our developers immediately began to investigate the case.
We suggested the problem may have been due to some peculiarities of our client's project. We knew this project was quite large and complex, but that information was not enough - we lacked details.
A memory dump of the analyzer process could be of help. What is dump? In short, a dump is a segment of data from RAM. It helps us to find out what data is loaded into the memory space of the PVS-Studio process. First of all, we were looking for any defects that could cause a severe slowdown in work.
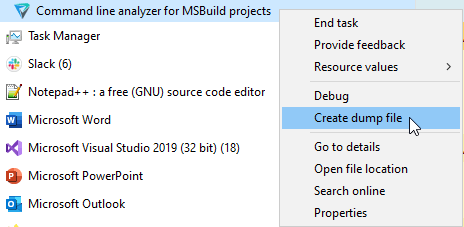
We asked the user to run the project analysis again, then wait a while, save the process dump and send it to us. No special programs or skills are needed for these actions - you can get the dump with a Task Manager.
If you can't open the dump file, it's of little use. Lucky for users, they don't have to deal with it :). As for us, we decided to review the dump data using Visual Studio. It is quite simple.
We see a window with different information about the process:
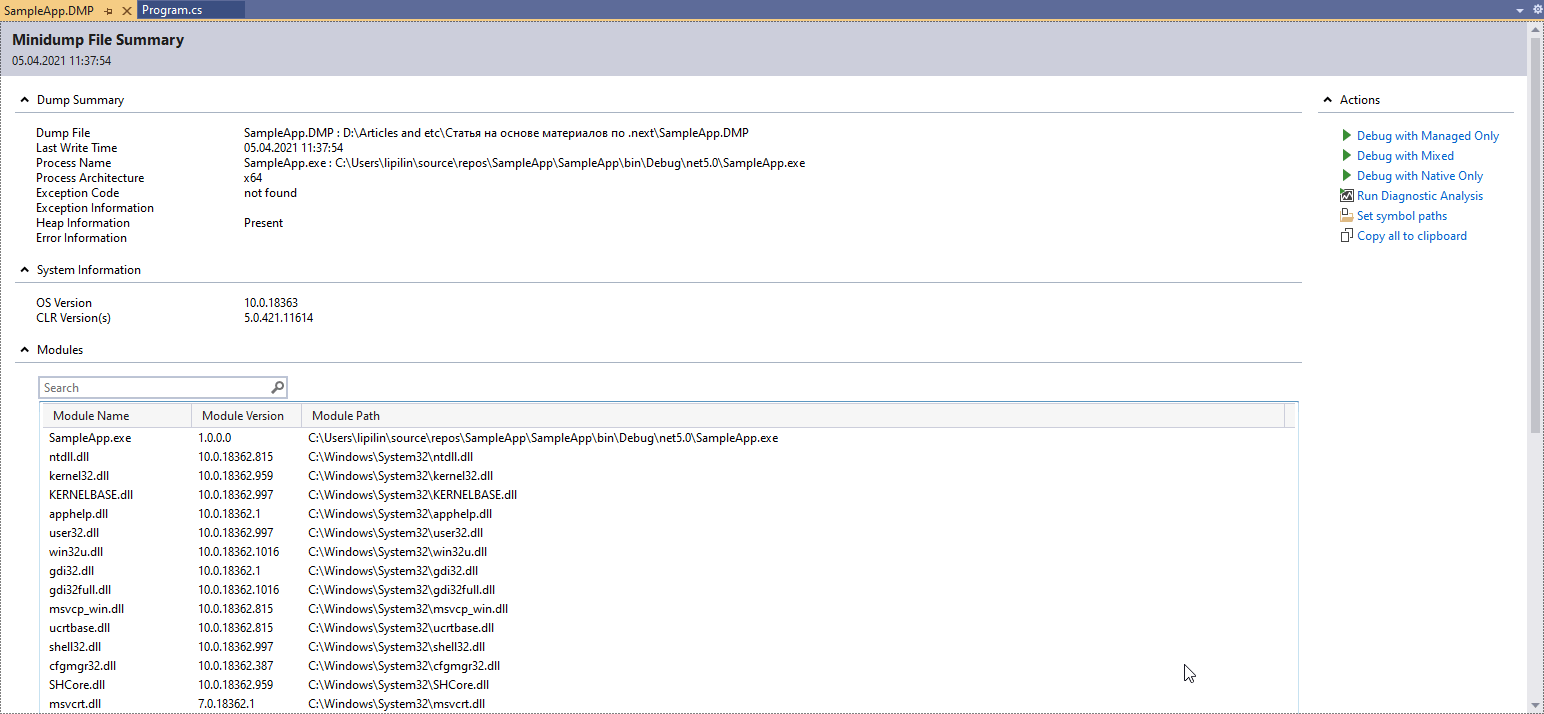
Mostly we'd like to know if we could switch to a kind of dump debugging mode. To do this, click Debug With Managed Only.
Note. If you'd like to learn more about opening dumps through Visual Studio for debugging, official documentation will definitely be of help.
So, we switched to the debugging mode. Debugging a dump file is a powerful mechanism. Still there are some limitations:
We got a variety of data from the dump debugging. Below is a small part of data on the analysis process at the moment of taking the dump:
We made some conclusions from working with the dump. The analyzer has checked most project files when the dump was taken. The slowdown became obvious by the end of the analysis. We had a hunch - factors leading to the slowdown may have accumulated.
Alas, we failed to figure out the reasons for the slowdown. There were no defects found, and the number of files in the project did not seem to be something out of the row. A similar project may be checked in about 2 hours.
Apart from the project size, structures' complexity also affects analysis time. We knew that many loops and high nesting levels lead to analysis slowdown. The dump file showed that the project did contain such fragments. But even the most complicated structure shouldn't have turned a two-hour analysis into... infinite!
Using data from the dump, we realized that the analysis got stuck on specific files with complex code structure. We asked them from the client, hoping to reproduce the problem. This didn't happen when analyzing individual files.
We decided to go an extra mile and create our own test project with a lot of complex constructs. We had to reproduce the problem locally - this would greatly simplify further search for its solution.
We created our test project with the following specifications of the user's project:
With fingers crossed we ran the analysis and...
No slowdowns. After so much effort we were never able to reproduce the problem. The formed project kept completing successfully within normal times. No hangups, no errors, no defects. At this point one can think - maybe the user made fun of this?
We seemed to have tried everything and truth wouldn't come out. Actually we would be glad to deal with the slowdown problem! As well as to cope with it, please the client and congratulate ourselves. After all, our user's project mustn't hang up!
Customer support is a difficult job that sometimes require incredible tenacity. We kept digging. Over and over again we tried to reproduce the problem and suddenly... We did it.
The analysis couldn't complete on one of our colleague's computer. He was using the same analyzer version and the same project. What was the difference then?
Hardware was different. More precisely, RAM.
Our automated tests run on a server with 32 GB of available RAM. Memory space varies on our employees' machines. It is at least 16GB, most have 32GB or more. The bug showed up on a laptop that had 8 GB of RAM.
Here comes a reasonable question - how does all this relate to our problem? We were solving the slowdown problem, not the one with high memory consumption!
In fact, the latter can really slow down the application. This occurs when the process lacks memory installed on the device. In such cases a special mechanism activates – memory paging (or "swapping"). When it works, part of the data from the RAM is transferred to the secondary storage (disk). If necessary, the system loads data from the disk. Thanks to this mechanism, applications can use more RAM than available on the system. Alas, this wizardry has its price.
It is remarkable reduction in the speed of work. Hard disk operations are much slower than working with RAM. It was swapping that slowed down the work of our analyzer hardest.
Basically, case solved. We could stop our investigation at this point. We could advise the user to increase the amount of available RAM and that's it. However, this would hardly satisfy the client, and we ourselves did not like this option at all. Therefore, we decided to delve into the issue of memory consumption in more detail.
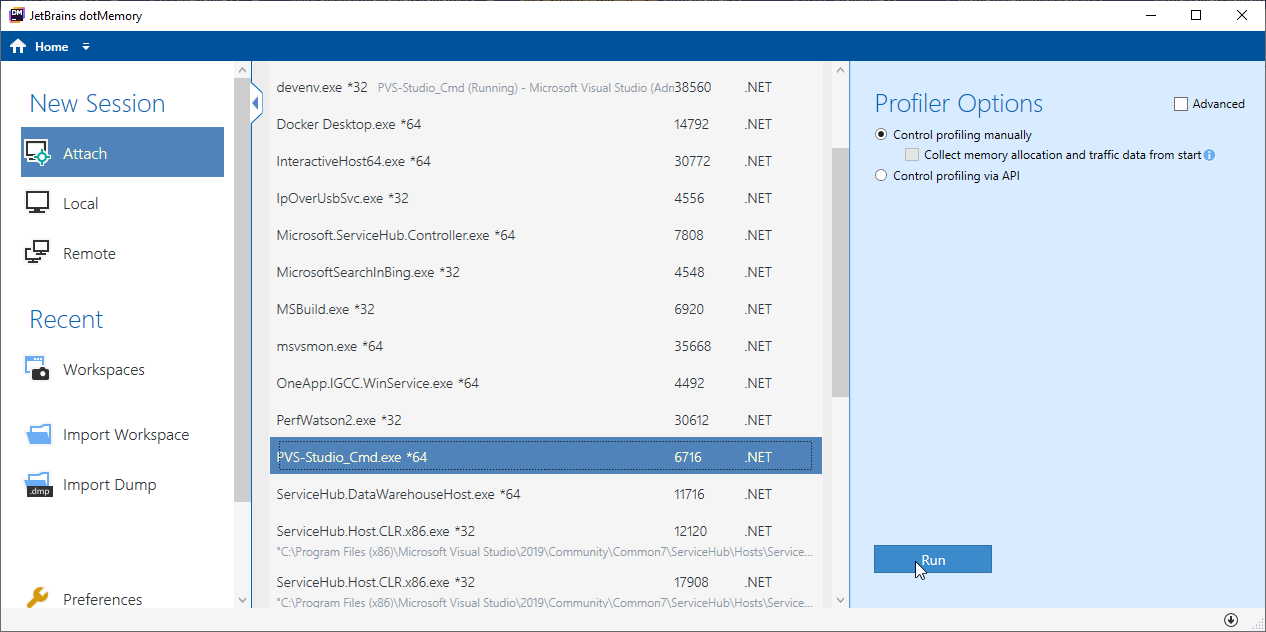
We used the dotMemory app by JetBrains. This is a memory profiler for .NET. You can run it both directly from Visual Studio and as a separate tool. Among all features of dotMemory, we were most interested in profiling the analysis process.
Below is a window allowing you to attach to a process:
First, we need to start the appropriate process, then select it and start profiling with the "Run" button. A new window opens:

We can get a snapshot of memory status at any time. During the process, we can take several such snapshots - all of them will appear in the "Memory Snapshots" panel:
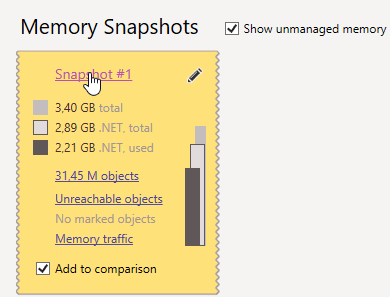
Next, we need to study the shot in detail. Click on its identifier to do this. In the opening window there are many different elements:
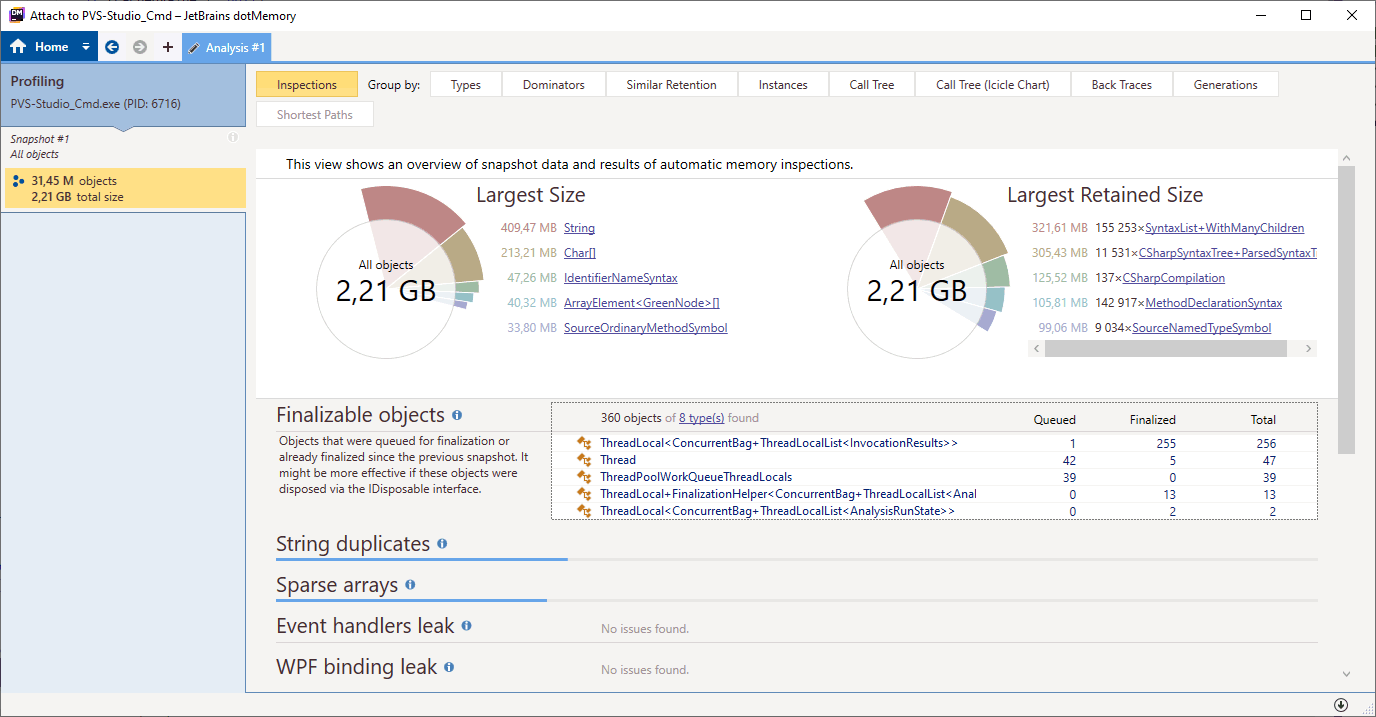
Official documentation provides more detailed information about working with dotMemory, including a detailed description of the data given here. The sunburst diagram was particularly interesting for us. It shows the hierarchy of dominators — objects that exclusively hold other objects in memory. Open the "Dominators" tab to go to it.
We did all these actions with the analysis process of the specially created test project. The dominator diagram for it looked like this:
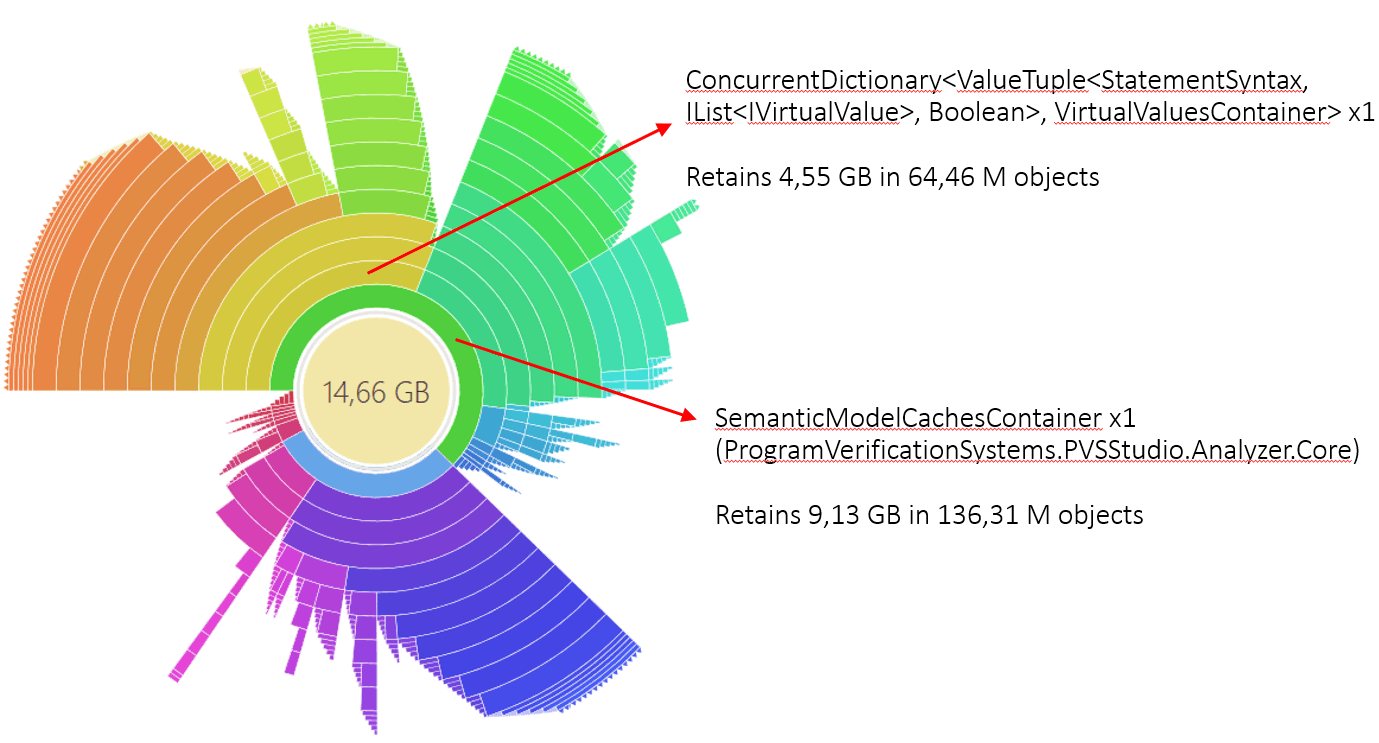
The closer the element is to the center, the higher is the position of the corresponding class. For example, the only instance of the SemanticModelCachesContainer class is at a high level in the hierarchy of dominators. The diagram also shows child objects after the corresponding element. For example, in the picture you can see that the SemanticModelCachesContainer instance contains a link to ConcurrentDictionary within itself.
High-level objects were not particularly interesting - they did not take much space. The inside part was much more considerable. What objects multiplied so much that they started taking up so much space?
After an in-depth study of the data obtained, we finally discovered the cause of high memory consumption. The cache used by our data flow analysis mechanism was taking most of it.
Data-Flow Analysis evaluates possible variable values in different points of computer program. If a reference gets dereferenced and currently may be null, it is a potential error. The analyzer will report about it. This article will give you more details about this and other technologies used in PVS-Studio.
The cache stores calculated ranges of variable values to optimize operation. Unfortunately, this leads to a serious increase in the amount of memory consumed. Despite this, we can't remove the caching mechanism! Inter-procedural analysis will go much slower if we refuse from caching.
Then we can we do? Is it a dead end again?
What do we have? Variable values are cached, and there are a lot of them. There are so many that the project is not checked even in 3 days. We still can't refuse caching these values. What if we somehow optimize the way they are stored?
We took a closer look at the values in the cache. PVS-Studio turned out to store a large number of identical objects. Here is an example. The analyzer can't evaluate values for many variables, because values may be any within their type constraints.
void MyFunction(int a, int b, int c ....)
{
  // a = ?
  // b = ?
  // c = ?
  ....
}
Each variable corresponded to its own value object. There was a whole bunch of such objects, but they did not differ from each other!
The idea came up instantly — we only had to get rid of duplication. True, the implementation would require us to make a large number of complex edits...
Well...Nope! In fact, it takes just a few:
Changes in certain parts of the analyzer usually involved a couple of lines. The repository implementation didn't take long either. As a result, the cache began to store only unique values.
You probably know the approach I describe. What we did is an example of the famous Flyweight pattern. Its purpose is to optimize the work with memory. How does it work? We have to prevent the creation of element instances that have a common essence.
String internment comes to mind in this context as well. In fact, it is the same thing. If strings are the same in value, they will actually be represented by the same object. In C#, string literals intern automatically. For other strings, we can use String.Intern and String.IsInterned methods. Bit it's not that simple. Even this mechanism must be used wisely. If you're interested in the topic, the article "Hidden Reefs in String Pool, or Another Reason to Think Twice Before Interning Instances of String Class in C#" will be right for you.
We made a few minor edits by implementing the Flyweight pattern. What about the results?
They were incredible! Peak RAM consumption during test project check decreased from 14.55 to 4.73 gigabytes. Such a simple and fast solution allowed to reduce memory consumption by about 68%! We were shocked and very pleased with the result. The client was excited as well - now the RAM of his computer was enough. This means the analysis began to take normal time.

True, the result was rewarding, but...
Yes, we managed to reduce memory consumption. Yet initially we wanted to speed up the analysis! Well, our client did have a speed boost, just like other machines that lacked RAM. But we didn't get speed up on our high-capacity machines - we only reduced memory consumption. Since we got so deep in the rabbit hole... Why not continue?
So, we started looking for optimization potential. First of all, we were wondering — which parts of the app work the longest? Exactly what operations waste time?
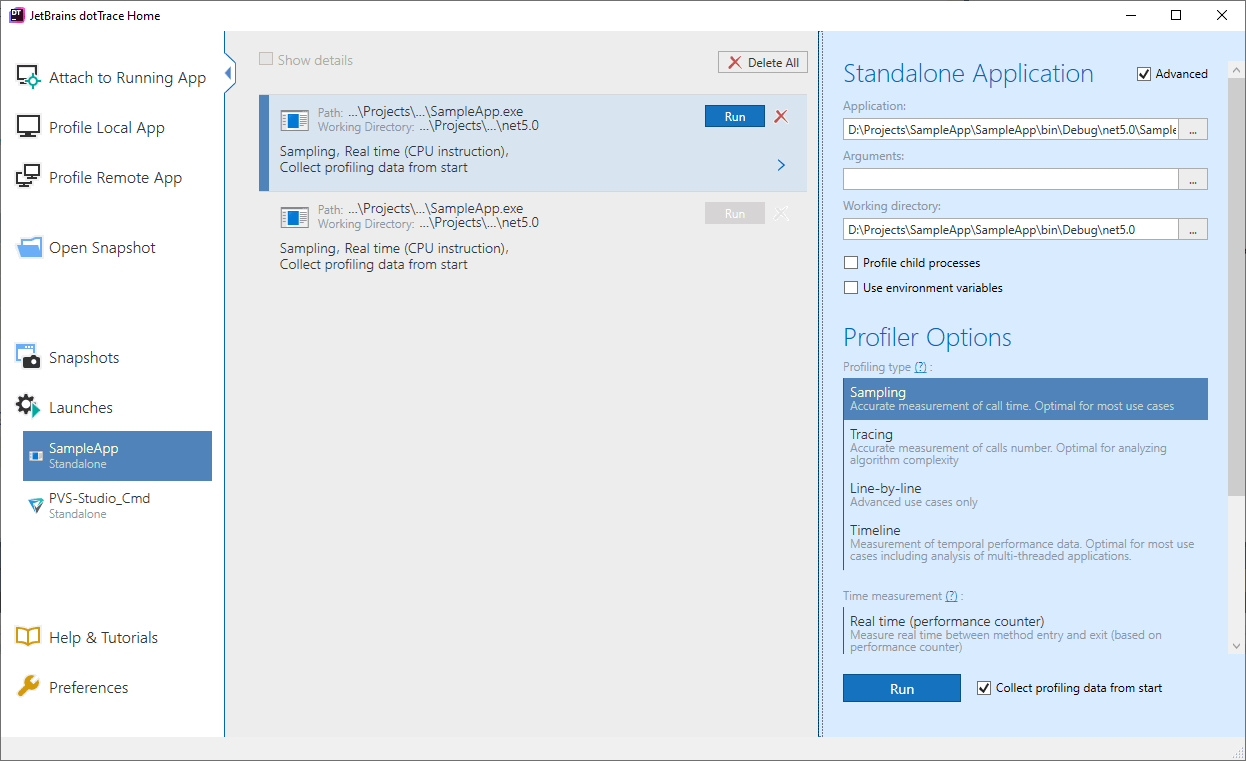
dotTrace, a decent performance profiler for .NET applications, could give answers to our questions and provide a number of interesting features. This application's interface quite strongly resembles dotMemory:
Note. As with dotMemory, this article will not give a detailed guide how to use dotTrace work with this application. Documentation is here to help you with details. My story is about actions we made to discover optimization opportunities.
Using dotTrace, we ran an analysis of one large project. Below is the window example that displays real-time graphs of memory and CPU usage:
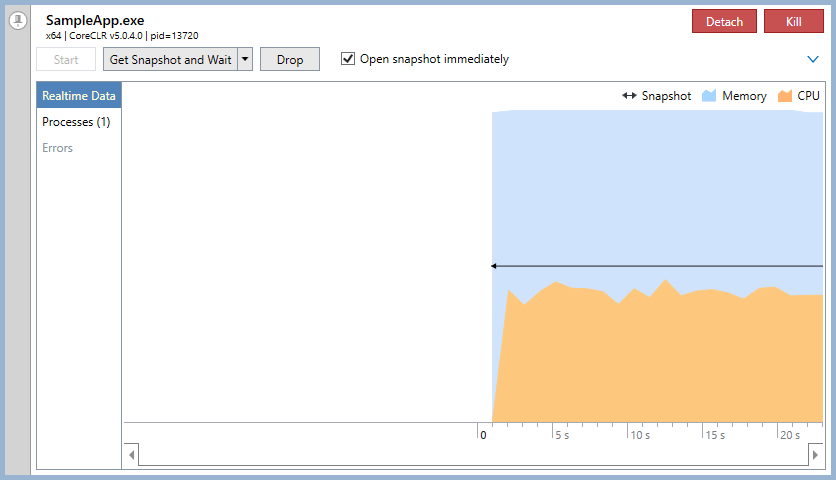
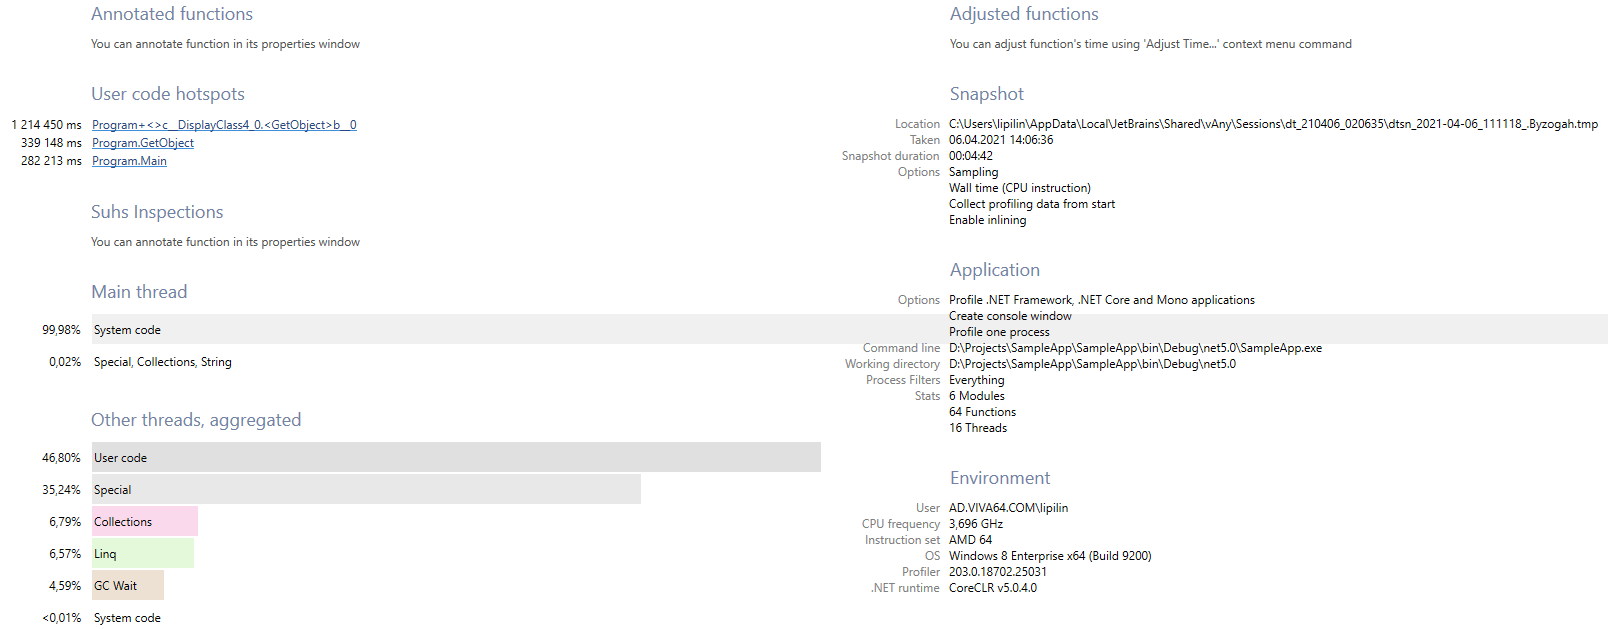
To start "recording" data about the application, press Start. By default, the data collection process starts immediately. After a while, click "Get Snapshot And Wait". A window with collected data opens. For example, for a simple console application, this window looks like this:
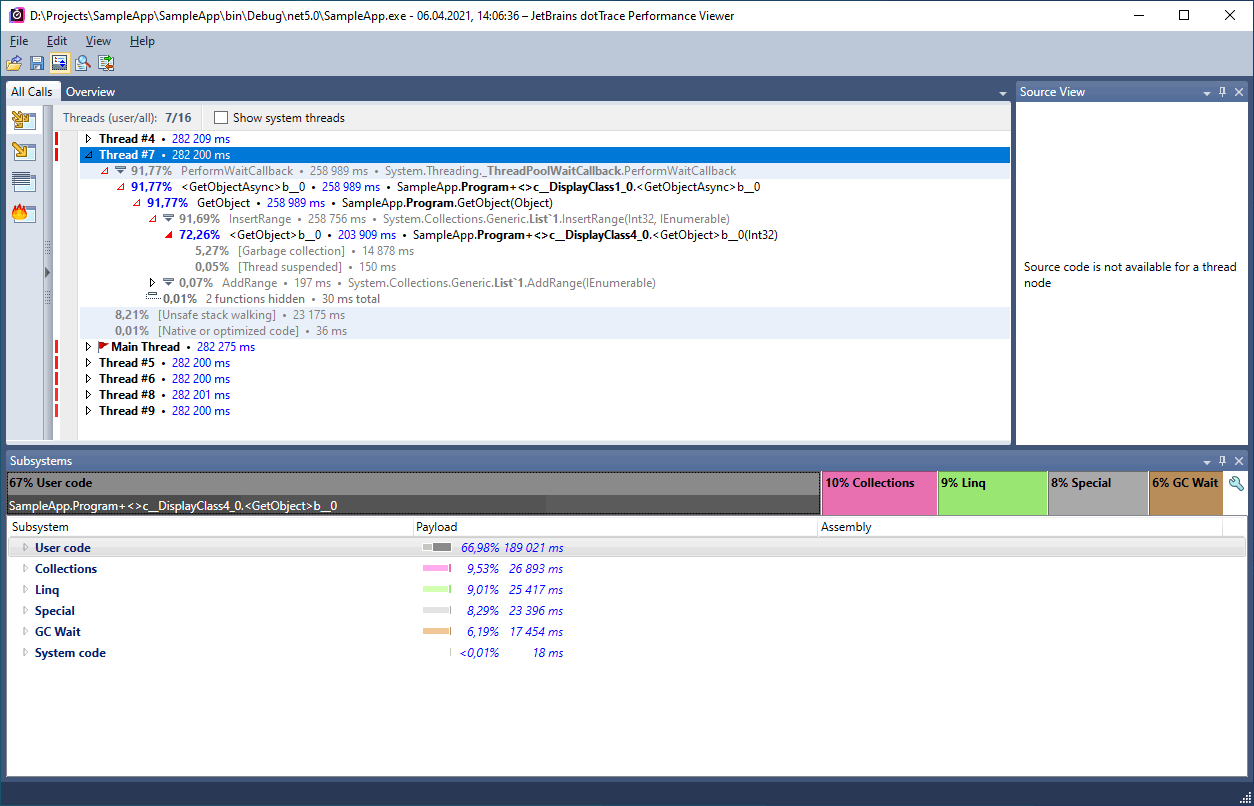
Here we have a lot of different information available. First of all, it is the working time of individual methods. It may also be useful to know the running time of threads. You can view the general report as well. To do this, click View->Snapshot Overview in the top menu or use the combination Ctrl+Shift+O.
What did we find out with dotTrace? Once again we made sure that C# analyzer doesn't use even half of the CPU power. PVS-Studio C# is a multi-thread application. In theory, the load on the processor should be notable. Despite this, during analysis, the CPU load often fell to 13— 15% of the CPU's total power. Obviously we're working inefficiently. Why?
dotTrace showed us an amusing thing. It is not even the application itself that works most of the time. It is the garbage collector! A logical question arises - how is that?
The fact is that garbage collection was blocking analyzer threads. After the completed collection the analyzer does a little work. Then garbage collection starts again, and PVS-Studio "rests".
We got the main point of the problem. The next step was to find places where memory allocates for new objects most actively. Then we had to analyze all found fragments and make optimization changes.
The tracer showed that most often memory is allocated to objects of DisplayPart type. At the same time, they exist for a short time. This means they require frequent memory allocation.
We might opt out of using these objects if it weren't for one caveat. DisplayPart is not even mentioned in the source files of our C# analyzer! As it turns out, this type plays a special role in the Roslyn API we use.
Roslyn (or .NET Compiler Platform) is the basis of PVS-Studio C# analyzer. It provides us with ready-made solutions for a number of tasks:
Roslyn is an open source platform. This made it easy to understand what DisplayPart is and why this type is needed at all.
It turned out that DisplayPart objects are actively used when creating string representations of so-called symbols. In a nutshell, a symbol is an object containing semantic information about some entity in the source code. For example, the method's symbol allows you to get data about the parameters of this method, the parent class, the return type, others. This topic is covered in more detail in the article "Introduction to Roslyn and its use in program development". I highly recommend reading it to everyone who is interested in static analysis, regardless of the preferred programming language.
We had to get string representations of some symbols, and we did so by calling the toString method. A complex algorithm inside was actively creating objects of the DisplayPart type. The problem was that the algorithm worked out every time we needed to get a string representation. That is, quite often.
Usually problem localization = 90% of its solution. Since ToString calls are so troublesome, maybe we shouldn't make them?
Sadly, we can't completely refuse to obtain string representations. So we decided to at least minimize the number of ToString calls from symbols.
The solution was simple — we began to cache the resulting string representations. Thus, the algorithm for obtaining a string representation worked out no more than once for each symbol. At least it worked so for a single thread. In our opinion, the best option is to use its own cache for each thread. This way we can do without threads synchronization, while some values' duplication was negligible.
The edit I described seemed very promising. Despite this, the change did not increase the CPU load much - it was only a few percent. However, PVS-Studio began to work much faster. One of our test projects was previously analyzed for 2.5 hours, and after edits - only 2. Acceleration by 20% made us really excited.
List<T>.Enumerator objects used to traverse collections took the second place in the amount of memory allocated. The list iterator is a structure. This means it is created on the stack. Anyway, the tracing was showing that a great number of such objects were getting in a heap! We had to deal with it.
An object of value type can get into the heap due to boxing. Boxing implements when a value object casts to Object or an implemented interface. The list iterator implements the IEnumerator interface. Casting to this interface led to the iterator getting into the heap.
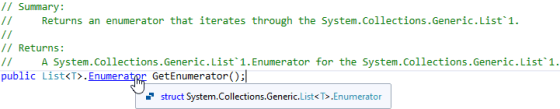
The GetEnumerator method is used to get the Enumerator object. We all know that this method is defined in the IEnumerable interface. Looking at its signature, we can notice that the return type of this method is IEnumerator. Does GetEnumerator call always lead to boxing?
Well...Nope! The GetEnumerator defined in the List class returns a structure:
Will there be boxing or not? The answer depends on the type of the reference from which GetEnumerator is called:
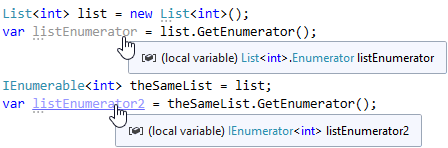
The resulting iterators are of the same value. Their distinction is that one is stored on the stack and the other – in a heap. Obviously, in the second case, the garbage collector is forced to do additional work.
The difference is small if such an Enumerator is created a couple of hundred times during the program operation. Speaking of an average project analysis, the picture is different. These objects are created millions or even tens of millions of times in our C# analyzer. In such cases, the difference becomes palpable.
Note. Generally, we don't call GetEnumerator directly. But quite often we have to use the foreach loop. This loop gets the iterator "under the hood". If a List reference is passed to foreach, the iterator used in foreach will be on the stack. Here is another case when foreach helps traverse an abstract IEnumerable. This way, the iterator will be in a heap, whereas foreach will work with the IEnumerator reference. The behavior above relates to other collections that contain GetEnumerator returning a value-type iterator.
Sure, we can't completely opt out of using IEnumerable. However, the analyzer code revealed many places where the method received an abstract IEnumerable as an argument, but still developers always pass a quite specific list.
Well, generalization is a good thing. Especially because a method that receives IEnumerable will be able to work with any collection, not with a particular one. Nonetheless, sometimes this approach demonstrates earnest drawbacks with no actual advantages.

Extension methods defined in System.Linq namespace are used to work with collections everywhere. Often enough, they really allow you to simplify the code. Almost every decent project comprises everybody's favorite methods Where, Select, others. PVS-Studio C# analyzer is no exception.
Well, the beauty and convenience of LINQ methods cost us dearly. It cost so much, that we chose not to use them in favor of simple foreach. How did it come out like that?
The main problem again was a huge number of objects implementing the IEnumerator interface. Such objects are created for each call of a LINQ method. Check out the following code:
List<int> sourceList = ....
var enumeration = sourceList.Where(item => item > 0)
                            .Select(item => someArray[item])
                            .Where(item => item > 0)
                            .Take(5);
How many iterators will we get when executing it? Let's count! Let's open System.Linq source file to get how it all works. Get them on github by link.
When you call Where, a WhereListIterator object will be created. It is a special version of the Where iterator optimized to work with List. There is a similar optimization for arrays. This iterator stores a reference to the list inside. When traversing the collection, WhereListIterator will save a list iterator within itself and use it when working. Since WhereListIterator is designed specifically for a list, the iterator won't cast to the IEnumerator type. WhereListiterator itself is a class, which means its instances will fall into the heap. Hence, the original iterator won't be on the stack anyway.
Calling Select will create an object of the WhereSelectListIterator class. Obviously, it will be stored in the heap.
Subsequent Where and Take calls will result in iterators and allocated memory for them.
What do we get? Allocated memory for 5 iterators. The garbage collector will have to release it later.
Now look at the fragment written using foreach:
List<int> sourceList = ....
List<int> result = new List<int>();

foreach (var item in sourceList)
{
  if (item > 0)
  {
    var arrayItem = someArray[item];

    if (arrayItem > 0)
    {
      result.Add(arrayItem);

      if (result.Count == 5)
        break;
    }
  }
}
Let's analyze and compare approaches with foreach and LINQ.
As a whole, the shortcomings are not very weighty if the LINQ query is executed relatively infrequently. As for us, we are in a situation where this has happened hundreds of thousands and even millions of times. Besides, those queries were not as simple as in the example given.
With all this, we noticed that mostly we had no interest in delayed execution. It was either a ToList call for LINQ operations result. Or query code was executed several times during repeated traverses - which is undesirable.
Remark. In fact, there is an easy way to implement delayed execution without unnecessary iterators. You might have guessed I was talking about the yield keyword. With it, you can generate a sequence of elements, specify any rules and conditions to add elements to a sequence. For more information on the capabilities of yield in C#, as well as how it works internally, read the article "What Is yield and How Does It Work in C#? ".
Having carefully reviewed the analyzer code, we found many places where foreach is preferable to LINQ methods. This has significantly reduced the number of required memory allocation operations in the heap and garbage collection.
PVS-Studio optimization completed successfully! We have reduced memory consumption, considerably increased the analysis speed. By the way, some projects have increased speed by more than 20% and peak memory consumption decreased by almost 70%! And everything started with an incomprehensible client's story of how he could not check his project in three days! Still we'll keep optimizing the tool and finding new ways how to improve PVS-Studio.
Studying the problems took us much longer than solving them. But the story told happened a very long time ago. The PVS-Studio team can now solve such problems much faster. The main assistants in problem research are various tools such as tracer and profiler. In this article, I talked about our experience with dotMemory and dotPeek, but this does not mean that these applications are one of a kind. Please write in the comments what tools you use in such cases.
Yes, we did solve the client's problem and even speeded up the analyzer as a whole, but... It obviously works by far not as fast as it can. PVS-Studio is still not actively using processor power. The problem is not exactly the analysis algorithms — checking each file in a separate thread allows it to provide a fairly high level of concurrency. The main performance trouble of the C# analyzer is a garbage collector, which very often blocks the operation of all threads - this is how we get slowdowns. Even if the analyzer uses hundreds of cores, the operation speed will be reduced due to frequent blocking of threads by the collector. The latter can't use all available power in its tasks due to some algorithmic constraints.
This is not a stalemate, though. It's just another obstacle that we must overcome. Some time ago I got "secret information" about plans to implement the analysis process... in several processes! This will help bypass existing constraints. Garbage collection in one of the processes will not affect the analysis performed in the other. Such an approach will allow us to effectively use a large number of cores and use Incredibuild as well. By the way, a C++ analyzer already works in a similar way. It has long used distributed analysis.
There is another noteworthy performance drawback. It is not about LINQ queries or something like that - it is common errors in code. "always true" conditions that make the method work longer, typos and others—all this affects both performance and the application as a whole.
Modern IDEs allow you to detect some problematic points. On the other hand, they review the code quite superficially. As a result, they detect only most obvious errors, like unused variable or parameter. Static analysis tools lend a hand in finding complex errors. Such tools immerse into the code much deeper, although it takes longer to do so. A static analyzer is able to find many different errors, including those that lead to problems with speed and memory consumption.
PVS-Studio is one of such analyzers. It uses enhanced technologies such as inter-procedural analysis or data flow analysis, which allow you to significantly increase the code reliability of any application. Here's another company priority - to support users, solve their issues and emerging problems. In some cases we even add new features at a client's request. Feel free to write to us on all issues that arise! Click the link to try the analyzer in action. Enjoy the usage!
0
0
0
0