How many of you have used third-party libraries when writing code? It's a catchy question. Without third-party libraries the development of some products would be delayed for a very, very long time. One would have to reinvent the wheel to solve each problem. When you use third-party libraries you still stumble upon some pitfalls in addition to obvious advantages. Recently PVS-Studio for C# has also faced one of the deficiencies. The analyzer could not finish analyzing a large project for a long time. It was due to the use of the SymbolFinder.FindReferencesAsync method from the Roslyn API in the V3083 diagnostic.

Life in PVS-Studio was going on as usual. We kept on writing new diagnostics, improving the analyzer, posting new articles. Bang! One of the analyzer users had the analysis going on a large project during the day and could not end in any way. Alarm! Alarm! All hands on deck! After getting dump files from the user we shifted our focus to find out the reasons for long analysis. It turned out that 3 C# diagnostics worked the longest. One of them was the diagnostic number V3083. This diagnostic has already had our special attention. The time has come to take specific actions! V3083 warns about incorrect C# event calls. For example, in the code:
public class IncorrectEventUse
{
  public event EventHandler EventOne;
  protected void InvokeEventTwice(object o, Eventers args)
  {
    if (EventOne != null)
    {
      EventOne(o, args);
      EventOne.Invoke(o, args);
    }
  }
}
V3083 will point to calls to event handlers of EventOne in the InvokeEventTwice method. You can learn more about the reasons why this code is dangerous in this diagnostic's documentation. From the outside, the logic of the V3083 is very simple:
Now when we know that it is so simple, it becomes even more interesting to get the reason for the long diagnostic work.
In fact, the logic is a little more complicated. In each file for each type V3083 creates only one analyzer warning for an event. In this warning, V3083 writes all line numbers of cases when the event is incorrectly called. This helps to navigate in various plugins: Visual Studio, Rider, SonarQube. It turns out that the first step is to find all the places where the event is called. For a similar task, Roslyn API already had the SymbolFinder.FindReferencesAsync method. It was used in V3083, so as not to reinvent the wheel.
Many guidelines recommend using this method: first, second, third [RU] and others. Perhaps, in some simple cases, the speed of this method is enough. However, the larger the project's codebase, the longer this method will run. We were 100% sure of this only after changing V3083.
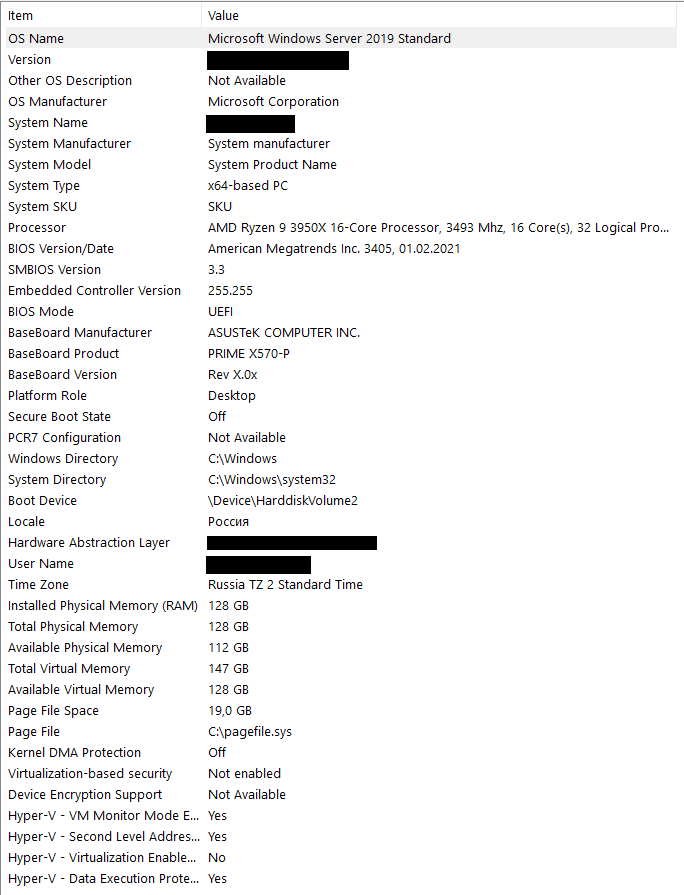
If you change a diagnostic's code or the analyzer core, you need to check that nothing that worked before is broken. To do this, we have positive and negative tests for each diagnostic, unit tests for the analyzer core, as well as a database of open-source projects. There are almost 90 projects in it. Why do we need a database of open-source projects? We use it to run our analyzer to test the tool in field conditions. Also this run serves as an additional check that we have not broken anything in the analyzer. We already had a run of the analyzer on this base before the V3083 change. All we had to do is to make a similar run after changing V3083 and figure out the time gain. The results turned out to be a pleasant surprise! We got a 9% speedup on tests without using SymbolFinder.FindReferencesAsync. These figures might seem insignificant to someone. Well, check out the specs of the computer that we used for measurements:

Hopefully even the most cynical skeptics have fully realized the scale of the problem that lived quietly in the V3083 diagnostic.
Let this note be a warning to everyone who uses the Roslyn API! This way you will not make our mistakes. Not only does this apply to the SymbolFinder.FindReferencesAsync method. It is also about other Microsoft.CodeAnalysis.FindSymbols.SymbolFinder class methods that use the same mechanism.
I also highly recommend that all developers review libraries they use. I say this for a reason! Why is it so important? Check out our other notes to find out why: first, second. They cover this topic in more detail.
Apart from developing diagnostics we've been busy optimizing PVS-Studio. Don't miss future articles and notes to find out about changes!
We haven't released the V3083 diagnostic fix, therefore the analyzer version 7.12 works using SymbolFinder.FindReferencesAsync.
As I mentioned earlier, we found the analyzer slowdown in two other C# diagnostics besides V3083. How do you think, which ones are these diagnostics? Just for the sake of interest, leave your ideas in comments. When there are more than 50 suggestions, I will open the veil of secrecy and call the numbers of these diagnostics.
0