
Our website uses cookies to enhance your browsing experience.
Webinar: Let's make a programming language. Lexer - 29.04

Do you write in C or C++ and want to analyze code regardless of the build system? Today, we'll explain how to use PVS-Studio static analyzer and plugin for Visual Studio Code on Windows.

C/C++ code can be used for different purposes that require their own build systems. For example, embedded development relies on specific compilers and build systems.
Sometimes, you can encounter a whole "zoo" of custom build scripts and suddenly realize that the previous "zookeeper" has resigned last year.
However, you decide that you still want to analyze such code (somehow), but you don't have any desire to understand the fragile and incomprehensible build system. What can you do?
Actually, there's a solution! The analyzer interacts with the build system to gather required data for analysis, but it can collect this in another way, for example, during compilation.
In this article, we'll talk about how to leverage this mechanism in PVS-Studio analyzer on Windows and how to seamlessly integrate the tool into the development workflow.
Let's define situations where you can use the compilation monitoring mode for a project.
Firstly, the described instructions are applied only to Windows. If you're interested in learning how to use the similar mechanism on Linux, we'll cover that in another article.
Secondly, PVS-Studio compilation monitoring can catch only calls from supported compilers, such as Visual C++, GCC, Clang, Keil MDK ARM Compiler 5/6, and IAR C/C++ Compiler for Arm.
To properly analyze C/C++ source files, the analyzer should obtain information about the compilation flags. These flags show what the compiler spots: they set the target architecture and the language standard, enable macro definitions, specify paths for searching header files, and control the logic of the preprocessor and compiler. The lack of such data may make the analyzer interpret the code incorrectly.
Along with compilation flags, PVS-Studio also requires an intermediate .i file, which is the result of the preprocessor work and contains all headers in the source file as well as expanded macros.
PVS-Studio doesn't have its own preprocessor, so it relies on an external one. This way, the analyzer improves analysis quality by processing the code with the same tools used for compilation.
The monitoring server (CLMonitor.exe) tracks the execution of processes corresponding to the target compiler and collects information about the process environment. This information is pivotal for further static analysis and includes:
Note. The server tracks processes run only by the user under whom it was run.
After monitoring is complete, the server uses all the received information, starts generating intermediate .i files for those source files compiled during monitoring, and then runs the analyzer.
The advantage of this mechanism is that you can analyze a project simply by rebuilding it—no need to modify any build scripts.
If you want to analyze only a certain project component, you can compile and therefore monitor only selected files. In case you wish to analyze only modified files, incremental analysis is the best option.
Note. We've discussed incremental analysis in a separate article, covering all possible use cases for regular static code analysis.
Let's take a look at how to run the monitoring server via the console. You can find this scenario useful if you want to integrate static analyzer into a build automation tool.
The monitoring server should be run before the project compilation begins.
To start the monitoring process, run the following command:
CLMonitor.exe monitorThis mode automatically runs CLMonitor in the monitoring mode and then completes the work; at the same time, its child process—i.e., run from the first one— keeps running in the background and monitors the build process.
Note. To ensure proper work of the monitoring server, it should be run the same privileges as the compiler processes.
For example, this way, running the server won't hinder further pipeline work in CI/CD. By the way, we've already discussed how to integrate static analysis into CI/CD in another article.
If no console is attached to the CLMonitor process, the monitoring server also outputs messages to the Windows Event Viewer (Event Viewer > Windows Logs > Application) along with the standard input/output (stdin and stdout).
Note. To ensure that messages are correctly recorded in the Windows Event Viewer, run CLMonitor.exe as administrator at least once. If the process has never been run with administrator privileges, error messages won't be recorded in the logs.
You can track only compiler runs that were started by a specific process. To do this, run CLMonitor in the trace mode with the trace and --parentProcessID arguments. The --parentProcessID argument takes the process's PID as a parameter that will perform a role of the parent for the compiler processes being run:
CLMonitor.exe trace –-parentProcessID 10256If you build projects via the console and want the monitoring server to track only the build started from the same console, you can run CLMonitor with the --attach (-a) argument:
CLMonitor.exe monitor –-attachIn this mode, the server will track only child processes that run from the console started the build.
After the project has been built, run the analysis via the following command:
CLMonitor.exe analyze -l "D:\ptest.plog"The -l argument takes the full path to the final analyzer report file as a parameter.
You can also pass additional parameters when starting the analysis:
-u flag is used to specify the path to the suppress file;--intermodular flag is used to enable the intermodular analysis mode;-c flag is used to specify the path to the .pvsconfig configuration file.To complete monitoring without running the analysis, use the abortTrace command:
CLMonitor.exe abortTraceThe CLMonitor monitoring server enables saving captured compilation data in a separate dump file. This allows you to run the analysis with no need to rebuild the project.
The dump file is a .zip archive with a .xml list of captured process parameters. You can run the analysis from either the archived dump file or the non-archived .xml file.
To save the dump file, start monitoring in the default mode and execute the following command:
CLMonitor.exe saveDump -d "D:\monitoring.zip"After the -d flag, specify the path to the final dump file.
You can also run the analysis directly from the dump file via the command:
CLMonitor.exe analyzeFromDump -l "d:\ptest.plog" -d d:\monitoring.zipAll flags available for starting the analysis are also supported by this command.
Unfortunately, the default CLMonitor mode for tracking compiler runs may miss some source files. This problem is particularly relevant for embedded projects, as they consist of fast-compiled C files.
To ensure the interception of all compilation processes, the monitoring server can switch to a more aggressive mode using the Image File Execution Options (IFEO) mechanism on Windows.
It runs a special handler before each compilation process starts; the handler then sends the required information to the monitoring server and continues to run the compiler as usual.
This mode seamlessly works with the build system and requires access to edit the path HKEY_LOCAL_MACHINE\SOFTWARE\Microsoft\Windows NT\CurrentVersion\Image File Execution Options in the Windows Registry.
Note. You can grant the required access to the monitoring server by running it as an administrator or by giving it write permissions to the registry branch above—or for the entire registry.
To enable this interception mode in the console version of the monitoring tool, pass the --wrapCompilers (-W) flag to the monitoring server with a list of compilers, for example:
CLMonitor.exe trace --wrapCompilers gcc.exe,g++.exeNote. The compiler executable names should include the .exe extension and be specified without paths.
Despite all the advantages of using the IFEO mechanism, it's important to take certain precautions.
The monitoring server intercepts process runs via a registry key, creating a connection with the name of the target executable file and the Debugger field that specifies the handler command. This mechanism replaces the run of the specified process with the handler, which makes it potentially dangerous: an error in the value of the Debugger field can completely block the corresponding application from starting.
Therefore, CLMonitor allows this mode only for executable files that are identified as known compilers. However, arbitrary programs can't be attached.
We've already covered so many interesting things—but that's not all.
Using compilation monitoring via the console isn't always the most handy option, so you can also use this feature through the UI. This is where PVS-Studio plugin for Visual Studio Code comes in.
The plugin lets you run the analysis, view reports, and—starting from PVS-Studio 7.39—even use compilation monitoring on Windows.
Note. You can read about how to install and use PVS-Studio plugin for Visual Studio Code here.
To start compilation monitoring, use the PVS-Studio: Run compiler monitoring for C and C++ command in the Visual Studio Code Command Palette (Ctrl + Shift + P).
When monitoring starts the plugin window with the table displays an indicator showing that monitoring is active:
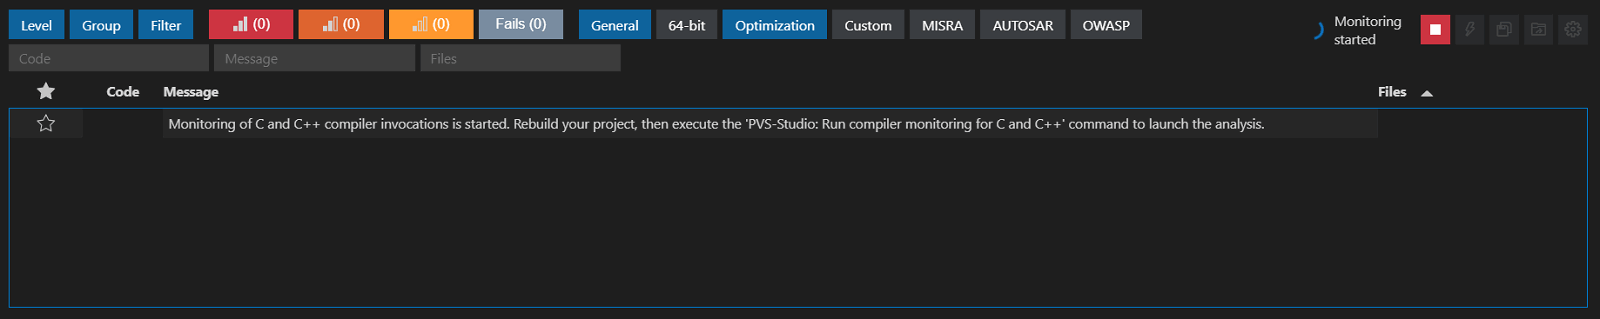
Once compiler calls are intercepted, their number will be displayed in the monitoring indicator, and the start button will appear.
You can also run the analysis using the PVS-Studio: Stop monitoring and start analysis command in the Visual Studio Code Command Palette.
If monitoring is run on a project for the first time, the plugin will prompt you to edit the ./.PVS-Studio/CLMonitorAnalyzerConfig.jsonc configuration file, where you can specify analysis settings identical to those of the console version:
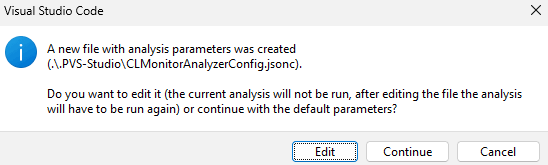
Click Edit to set the following parameters:
./.PVS-Studio/lastMonitoring.zip);.pvsconfig files.Click Continue to run the analysis using the default settings.
When the analysis is complete, warnings will appear in the table of the plugin window.
If the source code files and build configuration haven't changed, you can use the dump file and run the analysis from it by selecting the PVS-Studio: Start analysis from compiler monitoring dump file command in the Visual Studio Code Command Palette.
In PVS-Studio plugin for Visual Studio Code, you can use the Wrap Compilers mode. To enable it, open the Monitoring (C and C++) tab in the plugin settings and specify the names of the compiler executable files you want to monitor.
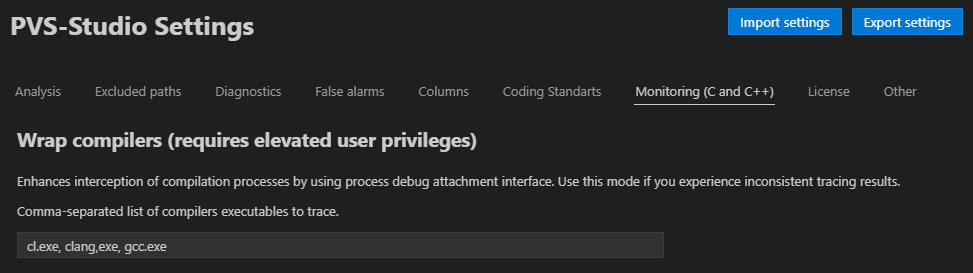
To enable monitoring in this mode, restart Visual Studio Code with administrator privileges.
In any monitoring mode, if the project build runs with administrator privileges, Visual Studio Code should also run with the same privileges so that the monitoring server can intercept compiler calls.
In this article, we looked at how to use the compilation monitoring mechanism on Windows with PVS-Studio analyzer.
We've covered the general scenarios, but there are plenty of edge cases too. You can learn more about them in the documentation.
We'll discuss how to intercept compiler calls on Linux in our blog a little later.
If you haven't tried PVS-Studio static analyzer yet, you can get a free trial here and see how it works on your project.
Clean code to you, folks!
0
0
0

0