We all need to interact with a debugger somehow: via text or a graphical user interface. A nasty bug may appear in a program "shell" with a well-established core. Users are unlikely to like it. Any developer would want to avoid this situation.

In the first part of the article about the x64dbg standalone debugger, we examined its core holding Intel Pentium 4 processor documentation in one hand, Windows API in the second one, and a math textbook – in the third one. It turned out to be a pretty tasteful math coprocessor soup served in a lightweight titanium dish. But the lunch wouldn't be complete without a second course of GUI.
Several months have passed since the last part was posted. Maintainers of x64dbg have continued to improve its functionality. They also opened a task to update the development tools. So in this post, we will continue the analysis based on commit f518e50 code and, where possible, we'll compare it with the commit 9785d1a, which is accurate at the time of writing.
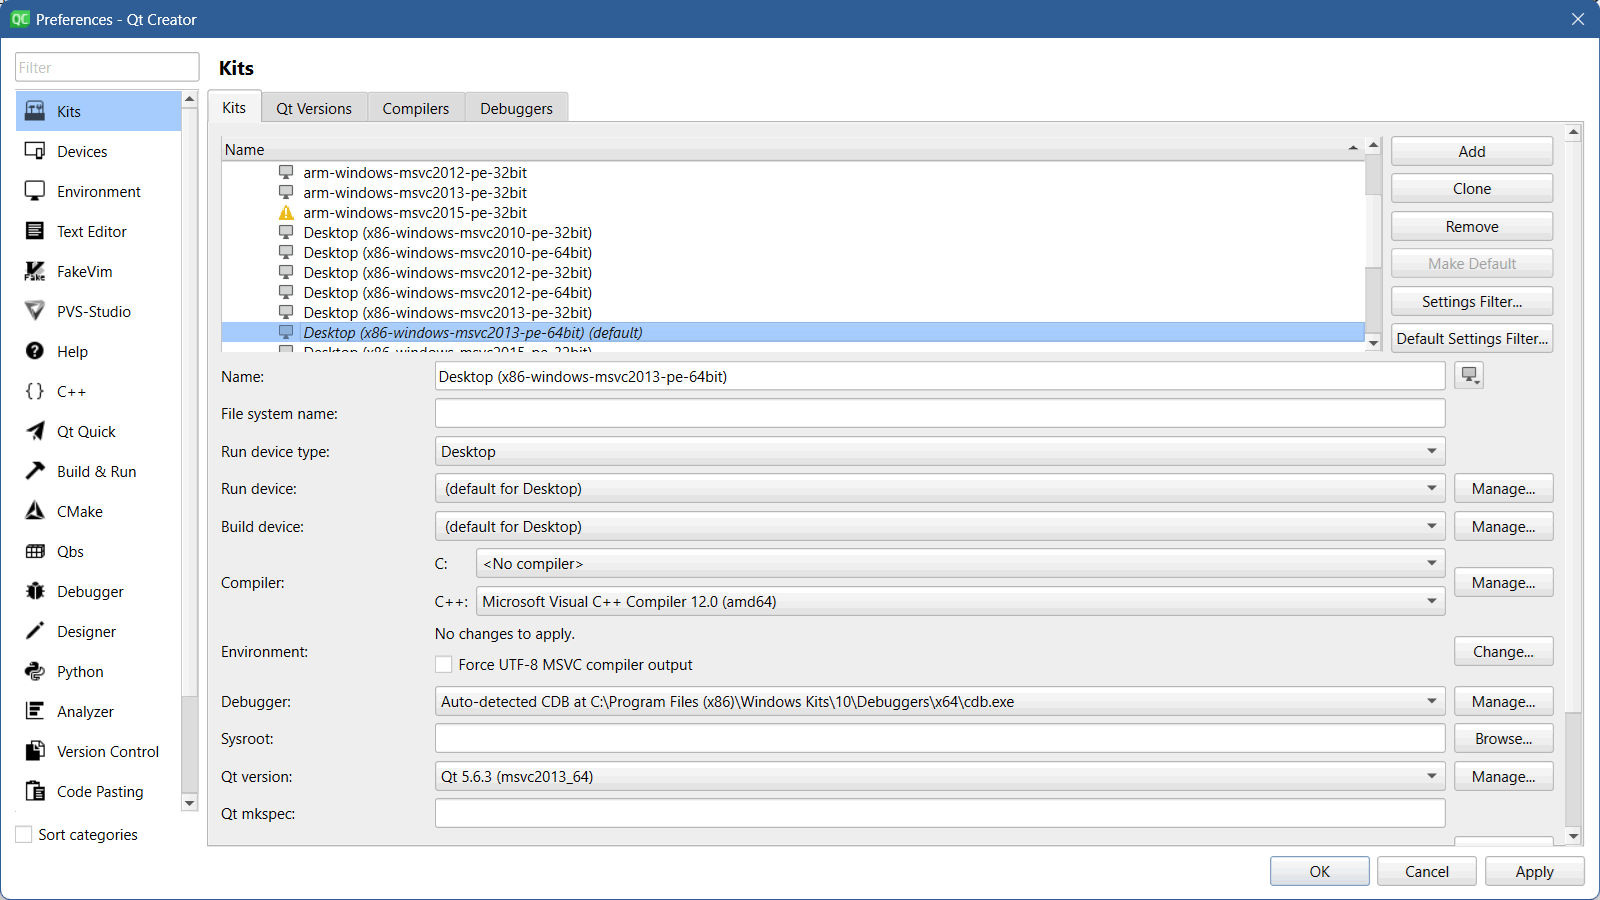
For the build we need Qt 5.6.3, as already mentioned in the instructions from the debugger developers. This Qt version can be seamlessly used in the current version of Qt Creator 14.0.2 where you can install the PVS-Studio plugin and perform static code analysis.

Let's start.
The PVS-Studio warning:
V781 The value of the 'post' index is checked after it was used. Perhaps there is a mistake in program logic. Utf8Ini.h 243
static inline std::string trim(const std::string & str)
{
    auto len = str.length();
    if(!len)
        return "";
    size_t pre = 0;
    while(str[pre] == ' ')
        pre++;
    size_t post = 0;
    while(str[len - post - 1] == ' ' && post < len)   // <=
        post++;
    auto sublen = len - post - pre;
    return sublen > 0 ? str.substr(pre, len - post - pre) : "";
}
What happens if the entire string consists only of whitespaces? Trimming spaces will epically trim both the string, and the program to the strains of choral singing. Just swap the checks and EXCEPTION_ACCESS_VIOLATION will bypass you.
while(post < len && str[len - post - 1] == ' ')
    post++;
Comes with:
The analyzer warnings:
V1048 The 'accept' variable was assigned the same value. HexDump.cpp 405
V547 Expression 'accept' is always true. HexDump.cpp 417
void HexDump::mouseMoveEvent(QMouseEvent* event)
{
    bool accept = true;

    int x = event->x();
    int y = event->y();

    if(mGuiState == HexDump::MultiRowsSelectionState)
    {
        //qDebug() << "State = MultiRowsSelectionState";

        if((transY(y) >= 0) && y <= this->height())
        {
            ....
            accept = true;               // <=
        }
        ....
    }

    if(accept)                           // <=
        AbstractTableView::mouseMoveEvent(event);
}
Here we observe an interesting situation. Handling of mouse movement events is performed unconditionally, as the accept variable is initialized with the true value, not with false. I assume this is a typo, and the developer likely intended to initialize it with false.
Extras:
The PVS-Studio warning:
V614 Potentially uninitialized variable 'funcType' used. Consider checking the fourth actual argument of the 'paintFunctionGraphic' function. Disassembly.cpp 548
QString Disassembly::paintContent(QPainter* painter, duint row, duint col,
                                  int x, int y, int w, int h)
{
  ....
  switch(col)
  {
  ....
  case ColDisassembly: //draw disassembly (with colours needed)
  {
    int loopsize = 0;
    int depth = 0;

    while(1) //paint all loop depths
    {
      LOOPTYPE loopFirst = DbgGetLoopTypeAt(va, depth);
      LOOPTYPE loopLast =
        DbgGetLoopTypeAt(va + mInstBuffer.at(rowOffset).length - 1, depth);
      HANDLE_RANGE_TYPE(LOOP, loopFirst, loopLast);
      if(loopFirst == LOOP_NONE)
        break;
      Function_t funcType;              //  <=
      switch(loopFirst)
      {
      case LOOP_SINGLE:
        funcType = Function_single;
        break;
      case LOOP_BEGIN:
        funcType = Function_start;
        break;
      case LOOP_ENTRY:
        funcType = Function_loop_entry;
        break;
      case LOOP_MIDDLE:
        funcType = Function_middle;
        break;
      case LOOP_END:
        funcType = Function_end;
        break;
      default:
        break;
      }
      loopsize += paintFunctionGraphic(painter,
                                       x + loopsize, y,
                                       funcType,            // <=
                                       loopFirst != LOOP_SINGLE);
      depth++;
    }
    ....
}
Someone forgot to initialize a variable. That's okay, we all been through this. Keep in mind that MSVC considers the use of uninitialized variables as undefined behavior. So, playing Tetris or sneezing into the speakers is allowed.
Imagine that's not the case. Then we can assume that the funcType variable should have been initialized with a Function_none value from the Function_t enumeration; or assigned a value in the switch block, as above.
The PVS-Studio warning:
V1091 The 'addrText.toUtf8().constData()' pointer is cast to an integer type of a larger size. The result of this conversion is implementation-defined. Breakpoints.cpp 506
bool Breakpoints::editBP(BPXTYPE type,
                         const QString & addrText,
                         QWidget* widget,
                         const QString & createCommand)
{
    BRIDGEBP bridgebp = {};
    bool found = false;
    if(type == bp_dll)
    {
        found = DbgFunctions()->GetBridgeBp(
            type,
            reinterpret_cast<duint>(addrText.toUtf8().constData()),    // <=
            &bridgebp
        );
    }
    else
    {
        found = DbgFunctions()->GetBridgeBp(
            type,
            (duint)addrText.toULongLong(nullptr, 16),
            &bridgebp
        );
    }
    ....
}
"Looked for one thing, found another" is just about the case on the screen. Something puzzled me. It's not the fact that the pointer is incorrectly cast from 32 to 64 bits. It's handling a temporary QByteArray object (created from addrText.toUtf8()) whose life cycle will end when reinterpret_cast is reached. Due to this, the GetBridgeBp function will or may receive something invalid instead of the breakpoint address string.
The PVS-Studio warning:
V557 Array overrun is possible. The value of 'registerName - ZYDIS_REGISTER_XMM0' index could reach 47. TraceInfoBox.cpp 310
typedef enum ZydisRegister_
{
  ....
  ZYDIS_REGISTER_XMM0,  // 88
  ....
  ZYDIS_REGISTER_YMM0,  // 120
  ....
  ZYDIS_REGISTER_YMM15, // 135
}

#ifdef _WIN64
#define ArchValue(x32value, x64value) x64value
#else
#define ArchValue(x32value, x64value) x32value
#endif //_WIN64

void TraceInfoBox::update(unsigned long long selection,
              TraceFileReader* traceFile,
              const REGDUMP & registers)
{
  ....
  else if(   registerName >= ZYDIS_REGISTER_YMM0
          && registerName <= ArchValue(ZYDIS_REGISTER_YMM7,
                                       ZYDIS_REGISTER_YMM15))
  {
    //TODO: Untested
    registerLine += CPUInfoBox::formatSSEOperand(
      QByteArray((const char*)®isters.regcontext
        .YmmRegisters[registerName - ZYDIS_REGISTER_XMM0], 32),           // <=
      zydis.getVectorElementType(opindex)
    );
  }
  ....
}
TODO, it would seem. Perhaps describing this warning would be out of place because of this. Nevertheless, I'll find the courage to figure out what's going on. Let's take a closer look at the fragment in question:
registerLine += CPUInfoBox::formatSSEOperand(
  QByteArray((const char*)®isters.regcontext
    .YmmRegisters[registerName - ZYDIS_REGISTER_XMM0], 32),           // <=
  zydis.getVectorElementType(opindex)
);
Let's unfold the checks in the condition:
else if(   registerName >= ZYDIS_REGISTER_YMM0
        && registerName <= ZYDIS_REGISTER_YMM15)
Once again:
else if(registerName >= 88 && registerName <= 135)How many YMM registers can there be, given the fact that the processor works in a 64-bit mode? Sixteen!
typedef struct {
    ....
    DWORD MxCsr;
#ifdef _WIN64
    XMMREGISTER XmmRegisters[16];
    YMMREGISTER YmmRegisters[16];
#else // x86
    XMMREGISTER XmmRegisters[8];
    YMMREGISTER YmmRegisters[8];
#endif
} REGISTERCONTEXT;
135 - 88 = 47, and we find ourselves in the dreaded situation of an array overrun. The issues don't end there: after some time, the TODO comment disappeared, but the code remained unchanged. Reviewing blame didn't shed any light on why the comment disappeared, as if the code had been written that way all those three years.
The PVS-Studio message:
V826 Consider replacing the 'values' std::vector with std::array. The size is known at compile time. CPUDisassembly.cpp 1855
bool CPUDisassembly::getLabelsFromInstruction(duint addr,
                                              QSet<QString> & labels)
{
    BASIC_INSTRUCTION_INFO basicinfo;
    DbgDisasmFastAt(addr, &basicinfo);
    std::vector<duint> values = { addr,
                                  basicinfo.addr,
                                  basicinfo.value.value,
                                  basicinfo.memory.value }; // <=
    for(auto value : values)
    {
        char label_[MAX_LABEL_SIZE] = "";
        if(DbgGetLabelAt(value, SEG_DEFAULT, label_))
        {
            //TODO: better cleanup of names
            QString label(label_);
            if(label.endsWith("A") || label.endsWith("W"))
                label = label.left(label.length() - 1);
            if(label.startsWith("&"))
                label = label.right(label.length() - 1);
            labels.insert(label);
        }
    }
    return labels.size() != 0;
}
This will let your carbon processor called "brain" cool down a bit after delving into the complex logical processes of its silicon counterpart :)
The diagnostic rule from the micro-optimization group gives us a hint about the usage of entities. We initialize it with the required values and do not modify it in the future. Thus, we can avoid using an entity whose number of elements can be changed at runtime.
The analyzer warnings:
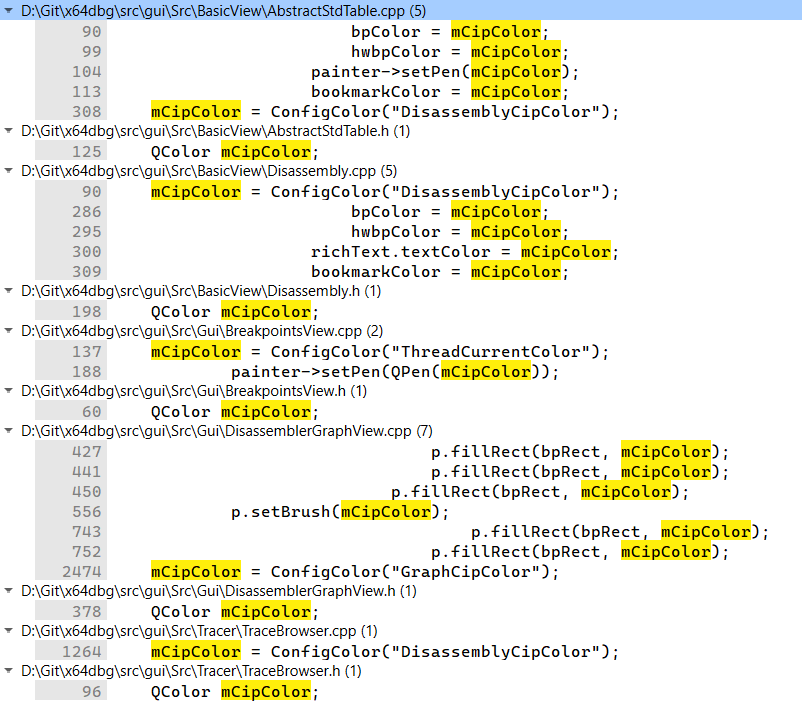
V703 It is odd that the 'mCipBackgroundColor' field in derived class 'BreakpointsView' overwrites field in base class 'AbstractStdTable'. Check lines: BreakpointsView.h:59, AbstractStdTable.h:124. BreakpointsView.h 59
V703 It is odd that the 'mCipColor' field in derived class 'BreakpointsView' overwrites field in base class 'AbstractStdTable'. Check lines: BreakpointsView.h:60, AbstractStdTable.h:125. BreakpointsView.h 60
class AbstractStdTable : public AbstractTableView
{
    ....
protected:
    ....
    QColor mCipBackgroundColor;                                  // <=
    QColor mCipColor;                                            // <=
    QColor mBreakpointBackgroundColor;
    QColor mBreakpointColor;

class StdTable : public AbstractStdTable
{
....
}

class BreakpointsView : public StdTable
{
    ....
private:
    ....
    std::unordered_map<duint, const char*> mExceptionMap;
    QStringList mExceptionList;
    int mExceptionMaxLength;
    std::vector<BRIDGEBP> mBps;
    std::vector<std::pair<RichTextPainter::List, RichTextPainter::List>> mRich;
    QColor mDisasmBackgroundColor;
    QColor mDisasmSelectionColor;
    QColor mCipBackgroundColor;                                   // <=
    QColor mCipColor;                                             // <=
    QColor mSummaryParenColor;
    ....
}
If you want to create a puzzle out of nothing, give an element of the derived class the same name as one in the base class. If it's too easy, add another one. Same variable names can confuse developers as they may think they are working with one object, but in fact it's another one. Don't do it.

Let's see what has changed in the x64dbg interface code since July. Now the joke about Time Travel Debugging from the new WinDbg would be up to time, as we'll see how many errors found by PVS-Studio have disappeared. Since TTD has no relation to static analysis, we just do Time Travel six months ahead and...
Four months ago, it was high time for the Breakpoints class to undergo refactoring. The commonalities are evident, but the error found by the V1091 diagnostic rule is no longer present. The question of the temporary QByteArray object remains open...
bool Breakpoints::editBP(BPXTYPE type,
                         const QString & module,
                         duint address,
                         QWidget* widget,
                         const QString & createCommand)
{
    QString addrText;
    BP_REF ref;
    switch(type)
    {
    case bp_dll:
        addrText = module;
        DbgFunctions()->BpRefDll(&ref, module.toUtf8().constData()); // <=
        break;
    ....
    }
    ....
}
Refactoring is not a quick process, but the result of it can bring a huge pile of the old code base problems overboard. Debugger developers also use Coverity for static analysis, which likely explains the decrease of warnings for both the core and the x64dbg graphical shell.
Making a solid debugger is no easy feat, as well as creating a user-friendly and convenient interface. Everyone can find flaws, but can anyone find beauty in program code? Errors can be beautiful too. But code fixed through regular use of a static analyzer, for example, PVS-Studio, will be even more delightful. For open-source projects, we offer a free license with the option to renew it in the future.
I wish the x64dbg development team success in completing the transition to up-to-date build tools and in releasing a cross-platform version of the debugger as soon as possible. And I also wish you less time wasted on debugging the debugger :)
0