In part 1 we discussed the basics of C and C++ projects compiling. We also talked over linking and optimizations. In part 2 we are going to delve deeper into intermodular analysis and discuss its another purpose. But this time we won't talk about source code optimizations — we're going to find out how to improve the quality of static analysis by the example of PVS-Studio.

The way most static analyzers (including PVS-Studio) work is similar to the way compiler's frontend works. To parse the code, developers build a similar model and use the same traversal algorithms. So, in this part of the article, you'll learn many terms related to compilation theory. We discussed many of them in part 1 — do take a look if you haven't already!
Long ago our developers have already implemented intermodular analysis in the C# analyzer. This became possible thanks to the infrastructure provided by the Roslyn platform.
But when we just started implementing intermodular analysis for C and C++, we encountered a number of problems. And now I'd like to share some solutions that we used — hope you'll find them useful.
The first problem was with the analyzer's architecture — our analyzer was obviously not ready for intermodular analysis. Let me explain why. Take a look at the following scheme:

The analyzer performs syntax and semantic analysis of the program text and then apply diagnostic rules. Translation and semantic analysis — particularly data flow analysis — are done in one pass. This approach saves memory and works well.
And everything is fine until we need information that is located further in the code. To continue the analysis, developers have to collect the analysis artifacts in advance and process them after the translation. Unfortunately, this adds memory overhead and complicates the algorithm. The reason for this is our legacy code. We have to maintain it and adapt it to the needs of static analysis. But we want to improve this in the future and perform analysis not in one pass. Nevertheless, our legacy code did not cause significant problems until we faced with the task of implementing intermodular analysis.
Let's consider the following figure as an example:
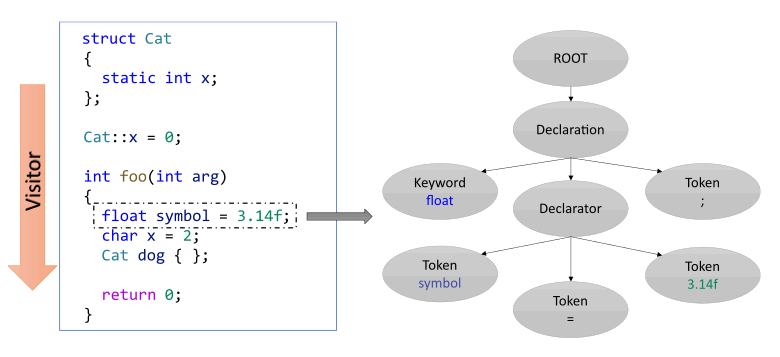
Suppose the analyzer builds an internal representation for the translated function foo. A parse tree is built for it in sequence according to instructions. This tree will be destroyed when the analyzer leaves the context of the translation unit. If we need to examine the body of the translation unit again, we will again have to translate it and all the symbols in it. However, this is not very efficient in performance. Moreover, if developers use the intermodular analysis mode, they might need to retranslate lots of functions in different files.
The first solution is to save intermediate results of code parsing into files — so that they can be reused later. With this approach we do not have to translate the same code many times. It is more convenient and saves time. But there's a problem here. The internal representation of the program code in the analyzer's memory can differ from the source code. Some fragments that are insignificant for analysis can be deleted or modified. So, it is impossible to link the representation to the source file. Besides, there are difficulties with saving semantic analysis data (data flow, symbolic execution, etc.) that are stored only in the context of the block where they are collected. Compilers, as a rule, transform the program's source code into an intermediate representation that is isolated from the language context (that's exactly what GCC and Clang do). This language context can often be represented as a separate language with its own grammar.
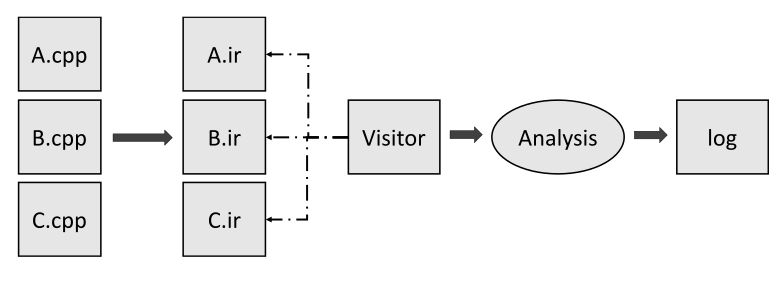
This is a good solution. It is easier to perform semantic analysis on such a representation because it has a quite limited operation set with memory. For example, it is immediately clear when the stack memory is read or written in LLVM IR. This happens with the help of load/store instructions. However, in our case, we had to make serious changes in the analyzer's architecture to implement intermediate representation. It would take too much time that we didn't have.
The second solution is to run semantic analysis (without applying diagnostic rules) on all files and collect information in advance. Then save it in some format to use it later during the second analyzer's pass. This approach will require further development of the analyzer's architecture. But at least it would take less time. Besides, this approach has its advantages:
With such implementation, we needed to save information about the symbols somehow. Now you see why I talked so much about them in the first part of the article. In fact, we had to write our linker. And instead of merging the object code, it should merge semantic analysis' results. Despite the fact that a linker's work is easier than a compiler's work, the algorithms that linkers use came in handy for us.
Now let's move on to semantic analysis. When the source code of the program is analyzed, the analyzer collects information about types and symbols.
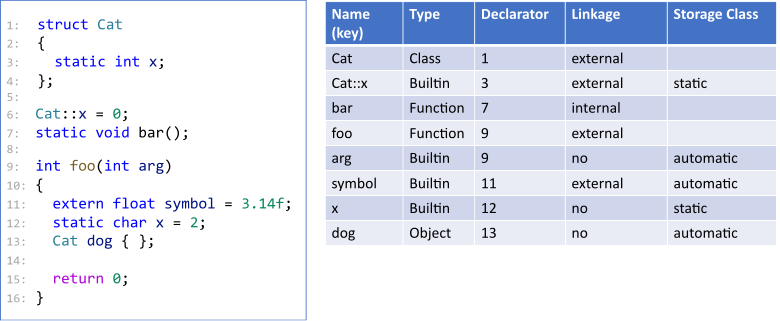
In addition to common information, the locations of all declarations are also collected. These facts must be stored between modules to display messages in diagnostic rules later. At the same time, symbolic execution and data flow analysis are performed. The result is recorded as facts related to symbols. Let's consider the following figure as an example:
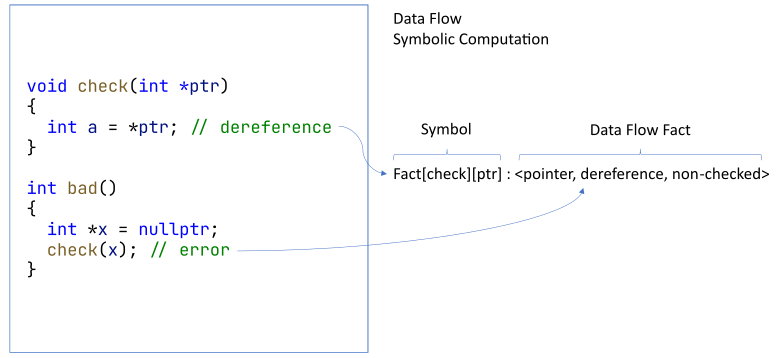
In the check function, the pointer is dereferenced. But this pointer was not checked. The analyzer can remember this. Then, the bad function receives unchecked nullptr. At this point, the analyzer can definitely issue a warning about null pointer dereference.
We decided to implement both interprocedural and intermodular analysis because this helps store symbols along with semantic facts — a set of conclusions that the analyzer made while reviewing the code.
And now we're getting closer to the most interesting part. Here it is! Data Flow Object (.dfo) — our format for representing binary semantic analysis data.
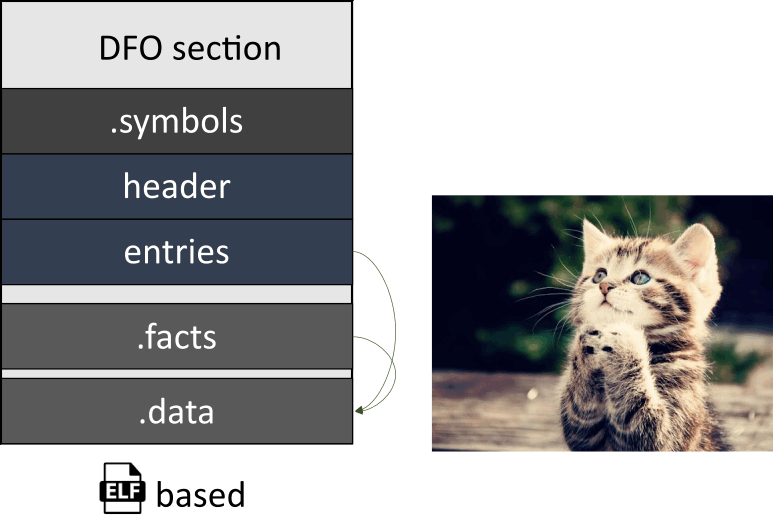
Our task is to store information about symbols and data for them in each translation unit. Suppose it is stored in the corresponding files in a special format. However, to use the information later, we need to merge them into one file to load it further while running the analyzer's pass.

Looks like a linker, don't you think so? That is the reason we didn't want to reinvent the wheel — we just created our DFO format that is similar to ELF. Let's take a closer look at it.
The file is divided into sections: DFO section, .symbol, .facts, and .data.
The DFO section contains additional information:
The section with symbols comes next.
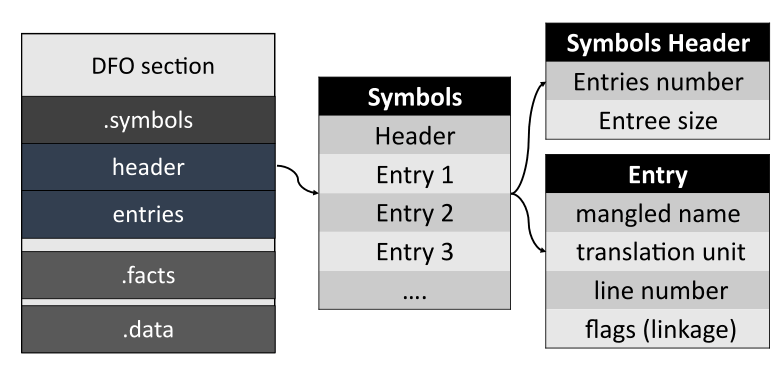
Header contains information about the number of records in the table. Each record contains a mangled name, location of the symbol in the source code file, information about the linkage, and storage duration.
Finally, the Facts section.

Just like with symbols, header contains information about the number of entries. These entries consist of references to symbols, and various facts for them. The facts are encoded as a fixed length tuple — this makes them easier to read and write. At the time of writing this article, facts are saved only for functions and their arguments. We do not yet save information about symbolic execution that the analyzer performs for the returned function values.
The data section contains strings referenced by other entries in the file. This allows creating the data interning mechanism to save memory. Besides, all records are aligned exactly as they are stored in memory in the form of structures. The alignment is calculated with the help of the following formula:
additionalBytes = (align - data.size() % align) % alignLet's say we already have data in the file — and it is written as follows:

Then we want to insert an integer of type int there.
Align(x) = alignof(decltype(x)) = 4 bytes
Size(x) = sizeof(x) = 4 bytes
data.size = 3 bytes
additionalBytes = (align - data.size() % align) % align =
= (4 - 3 % 4) % 4 = 1 byte;
We get a shift of 1 byte. Now we can insert the integer.

Now let's take a closer look at the stage of merging .dfo files into one file. The analyzer sequentially loads information from each file and collects it into one table. Besides, the analyzer — as well as a linker — has to resolve conflicts between symbols that have the same name and signature. In a schematic representation, this looks as follows:
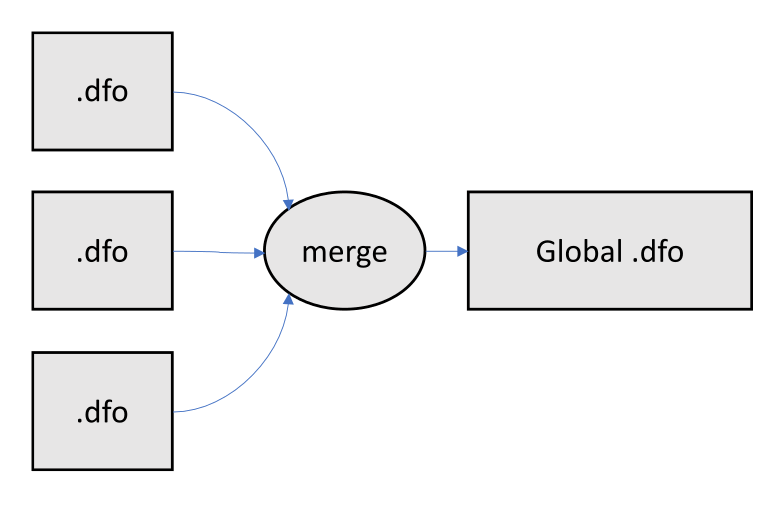
However, there are several pitfalls.
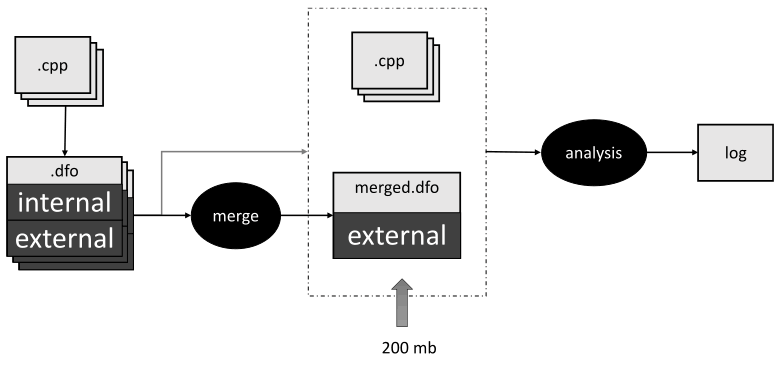
Some time ago, my colleague wrote an article "Linux kernel turns 30: congratulations from PVS-Studio". Quite an interesting one! Do read when you have some time. After my teammate started analyzing the Linux kernel, he got a 30 GB shared .dfo file! So, we tried to find out the reason and discovered a mistake. By this time, we've already knew how to determine the category of symbol linkage. However, we still wrote them all into a common .dfo file. We did this to make the analysis more precise in specific translation units in which these symbols were defined. Let's take a look at the picture:
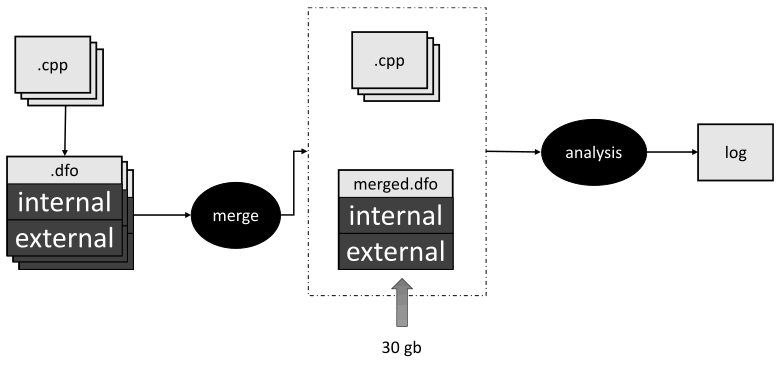
As I mentioned earlier, .dfo files are generated for each translation unit. Then, they are merged into one file. After that, PVS-Studio uses only this file and source files to perform further analysis.
But when we checked the Linux kernel, we found out that there were more symbols with an internal linkage than those with an external. This resulted in such a large .dfo file. The solution was obvious. We needed to combine only symbols with the external linkage at the stage of merging. And during the second analyzer's pass, we sequentially uploaded 2 .dfo files — the combined file and the file obtained after the first stage. This allowed us to merge all symbols with the external linkage obtained after the analysis of the entire project, and symbols with an internal linkage for a specific translation unit. So, the file size did not exceed 200 MB.
But what to do if there are 2 symbols with the same name and signature and one of them has an external linkage? This is definitely the ODR violation. It's not a good idea for a compiled program to contain such a thing. And we can have a conflict between symbols if the analyzer starts to check files that are not actually merged. For example, CMake generates a common compile_commands.json file for the entire project without taking into account the linker's commands. We'll discuss this in detail a bit later. Fortunately, even if the ODR is violated, we can still continue the analysis (provided that the semantic information of the symbols matches). In this case, you can simply choose one of symbols. If the information does not match, we will have to remove all symbols with this signature from the table. Then the analyzer will lose some information — however, it will still be able to continue the analysis. For example, this can happen when the same file is included in the analysis several times, provided that its contents change depending on compilation flags (e.g., with the help of #ifdef).
I'd like to note that at the time of writing this article, the functionality has not yet been implemented. But I want to share an idea of how it can be done. We might include it in future analyzer's versions — unless we come up with some better idea.
We focused on the fact that we can transfer information from one file to another. But what if the data chain is longer? Let's consider an example:

The null pointer is passed via main -> f1 -> f2. The analyzer can remember that f1 receives a pointer, and that the pointer is dereferenced in f2. But the analyzer will not notice that f2 receives the null pointer. To notice this, the analyzer first needs to run intermodular analysis of the main and f1 functions to understand that the ptr pointer is null. Then the analyzer should check the f1 and f2 functions again. But this will not happen with the current implementation. Let's have a look at the following scheme:
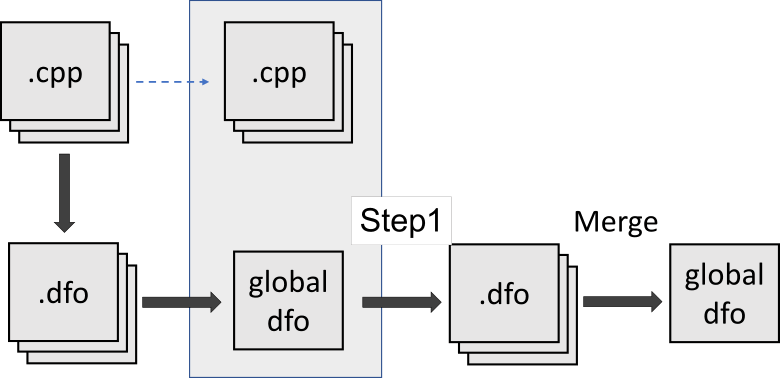
As you can see, after the merge stage, the analyzer is no longer able to continue intermodular analysis. Well, to be honest, this is a flaw in our approach. We can fix this situation if we separately reanalyze the file that we need again. Then we should merge the existing summary .dfo file and the new information:
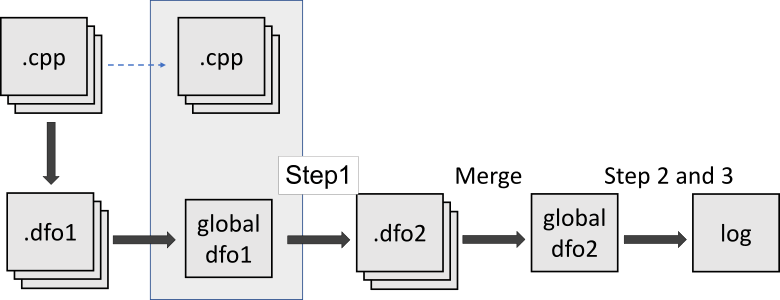
But how to find out which translation units we should analyze again? An analysis of external calls from functions would help here. To do this, we need to build a call graph. Except that we don't have one. We want to create a call graph in the future but at the time of writing this article, there is no such functionality. Besides, as a rule, a program contains quite a lot of external calls. And we can't be sure that this will be effective. The only thing that we can do is to reanalyze all the translation units again and rewrite the facts. Each pass increases the analysis depth by 1 function. Yep, it takes a while. But we can do this at least once a week on weekends. It's better than nothing. If we create intermediate representation in the future, we would solve this problem.
So, now we are done with discussing the internal part of intermodular analysis. However, there are several thought-provoking points related to the interface part. So, let's move from the analyzer core to the tools that run it.
Imagine the following situation. You are developing a project that has already been checked by a static analyzer. And you don't want to run the full analysis every time you change some files. Our analyzer provides a feature (similar to compilation) that runs the analysis only on modified files. So, is it possible to do the same with intermodular analysis? Unfortunately, it's not that simple. The easiest way is to collect information from modified files and combine it with the common file. The next step is to run the analysis on modified files and the common file together. When the depth of analysis equals one function, this will work. But we'll lose errors in other files that could have been caused by new changes. Therefore, the only thing that we can optimize here is the semantic data collection stage. Let's consider the illustration:
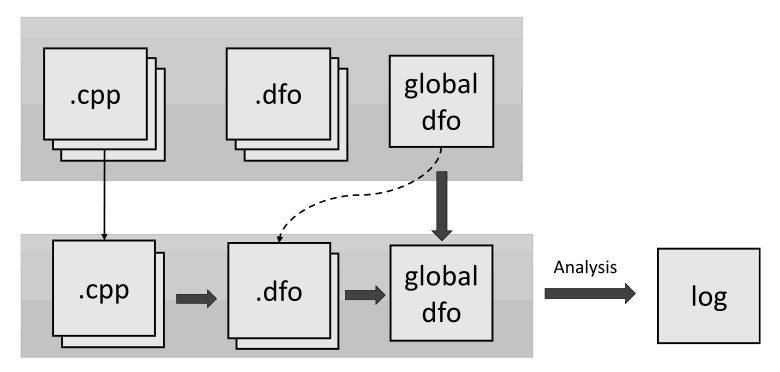
The first line shows the status of the entire project. The second line illustrates files that have been changed. After that:
Most often, a project with the source code of programs consists of several parts. Moreover, each can have its own set of symbols. It often happens that the same file is merged with several of them. In this case, the developer is responsible for passing the correct parameters to the linker. Modern build systems make this process relatively convenient. But there are many such systems, and not all of them allow you tracking compilation commands.
PVS-Studio supports 2 C and C++ project formats — Visual Studio (.vcxproj) and JSON Compilation Database. We don't have problems with Visual Studio (.vcxproj). This format provides all the necessary information to determine the project components. But the JSON Compilation Database format is a bit complicated...
The JSON Compilation Database format (aka compile_commands.json) is intended for code analysis tools such as clangd, for example. And so far we have had no problems with it. However, there's one nuance — all compilation commands in it are written in a flat structure (in one list). And, unfortunately, these commands don't include commands for a linker. If one file is used in several parts of the project, the commands for it will be written one after another without any additional information. Let's illustrate this with an example. To generate compile_commands.json we will use CMake. Suppose we have a common project, and 2 of its components:
// CMakeLists.txt
....
project(multilib)
....
add_library(lib1 A.cpp B.cpp)
add_library(lib2 B.cpp)

> cmake -DCMAKE_EXPORT_COMPILE_COMMADS=On /path/to/source-root

// compile_commands.json

[
  {
    "file": "....\\A.cpp",
    "command": "clang-cl.exe ....\\A.cpp -m64 .... -MDd -std:c++latest",
    "directory": "...\\projectDir"
  },
  {
    "file": "....\\B.cpp",
    "command": "clang-cl.exe ....\\B.cpp -m64 .... -MDd -std:c++latest",
    "directory": "...\\projectDir "
  },
  {
    "file": "....\\B.cpp",
    "command": "clang-cl.exe ....\\B.cpp -m64 .... -MDd -std:c++latest",
    "directory": "....\\projectDir "
  }
]
As you can see, when we compile the entire project, the resulting compile_commands.json contains the command for B.cpp. And this command is repeated twice. In this case, the analyzer will load the symbols of one of the commands, because they are identical. But if we make the contents of the B.cpp file dependent on compilation flags (for example, with the help of the preprocessor directives), there will be no such guarantee. At the time of writing this article, this problem has not been solved properly. We plan to do this, but for now, we have to work with what we have.
Alternatively, I found out the possibility to manage the contents of compile_commands.json via CMake. However, this approach is not very flexible. We have to modify CMakeLists.txt manually. In CMake 3.20 and newer versions, it is possible to specify the EXPORT_COMPILE_COMMANDS property for the target. If it is set to TRUE, commands will be written to the final file for the target. So, adding a few lines to CMakeLists.txt, we can generate the necessary set of commands:
CMakeLists.txt:
....
project(multilib)
....

set(CMAKE_EXPORT_COMPILE_COMMANDS FALSE) #disable generation for all targets

add_library(lib1 A.cpp B.cpp)
add_library(lib2 B.cpp)

#enable generatrion for lib2
set_property(TARGET lib2 PROPERTY EXPORT_COMPILE_COMMANDS TRUE)
Then, we run the analysis on compile_commands.json:
pvs-studio-analyzer analyze -f /path/to/build/compile_commands.json ....Note that if we set this property for several build targets at once, their compilation commands will also merge into one list.
PVS-Studio provides a way to run analysis with the help of the Compilation Database directly via CMake. To do this, you need to use a special CMake module. You can learn more about this in the documentation. At the time of writing this article, we haven't implemented the support of intermodular analysis. However, this direction is quite promising.
Another option would be to track linker commands, as we do for compilation commands with the help of our CLMonitor utility or via strace. We'll probably do this in the future. However, such approach also has a disadvantage — to track all calls, it is necessary to build the project.
Imagine the following situation. You have a main project that you need to analyze. Pre-compiled third-party libraries are connected to the project. Will intermodular analysis work with them? Unfortunately, the answer is "no". If your project does not have compilation commands for a third-party library, semantic analysis will not run on them, because only header files can be accessed. However, there is a theoretical possibility to prepare a semantic information module for the library in advance and connect it to the analysis. To do this, we should merge this file with the main file for the project. At the time of writing the article, this can be done only manually. However, we want to automate this process in the future. Here's the main idea:
At the same time, we must keep in mind that paths in .dfo files are stored as absolute. So, we cannot move the sources of a third-party library or pass the file to other machines. We still have to come up with a convenient way to configure third-party semantic modules.
Well, we figured everything out about analysis algorithms. Now, I'd like to discuss two optimizations that we consider interesting.
Here I mean data caching in a single source so that it can be referenced from anywhere. Most often, such optimization is implemented for strings. By the way, our files contain quite a lot of strings. Because each position for symbols and facts is stored in the DFO file as string. Here is an example of how it might look like:
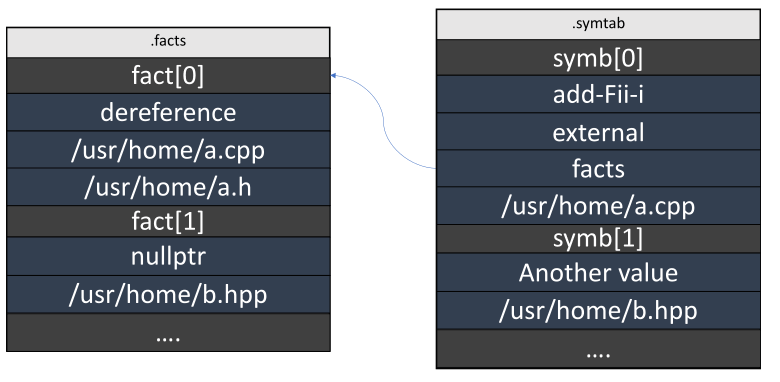
As we see, the data is often duplicated. If we add all unique strings to the .data section, the file size will decrease significantly, as well as the time to read and write data to the file. It is quite simple to implement such an algorithm with the help of an associative container:
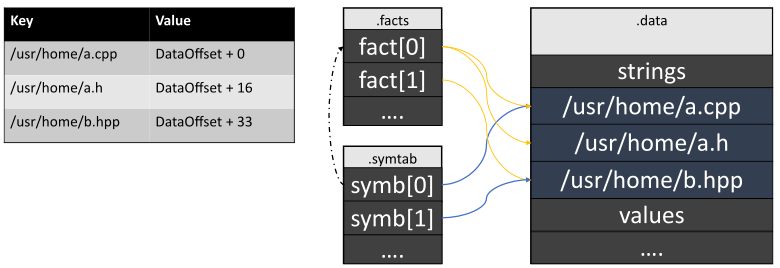
Now, all sections, except for data sections, contain only corresponding string addresses.
Despite the fact that strings are now unique, the data in them is still duplicated. For example, in the figure below, all paths have the same first part, or prefix:

And this situation repeats quite often. However, the trie solves this problem.

In such view, the end nodes (leaves) will be references. We should not have situations when a string completely coincides with the prefix of another string. This shouldn't happen because we work with files that are unique in the system. We can restore a full string by passing it back to the root of the trie. The search operation in such a trie is directly proportional to the length of the string that we search. There may be problems in case-insensitive file systems. Two different paths may point to the same file, but in our case this can be ignored because this is processed later during comparing. However, in .dfo files, we can still store the original paths that have already been normalized.
Intermodular analysis provides many previously inaccessible possibilities and helps find interesting errors that are difficult to detect during usual code review. Nevertheless, we still have to do a lot to optimize and expand functionality. You can try intermodular analysis right now. It is available in PVS-Studio v7.14 and newer versions. You can download the latest analyzer version on our website. Want to learn more about intermodular analysis? Do read the previous article if you haven't already. If you have any problems or ideas, feel free to write us, we'll definitely try to help. Please note that when requesting a trial via the provided link, you can get an Enterprise license for 30 days. We hope that this mode will help fix errors in your project.
0