
Our website uses cookies to enhance your browsing experience.

"I'll be back" (c). I think everybody knows this phrase. Although, today we aren't going to talk about the return of the terminator, the topic of the article is similar in some way. We'll discuss the analysis of the the machine learning library TensorFlow and will try to find out, if we can sleep peacefully or Skynet is already coming...

TensorFlow is a machine learning library, developed by Google corporation and available as an open-source project since November, 9th, 2015 year. At the moment it is actively used in research work and in dozens of commercial products of Google, including Google Search, Gmail, YouTube, Photos, Translate, Assistant, etc. The source code is available at the repository on GitHub and on the Google Open Source platform.

Why was this project chosen?
Of course, we cannot miss a chance to check such a project. I don't even know why my colleagues haven't checked it yet. Well, it's time to do this.
If you know what PVS-Studio is, then you know the answer. In case you are still not aware, please don't rush reading on. For example, it could be interesting to know that we have a C# analyzer for more than a year, and a Linux version for roughly half a year.

Here is also the general information about the tool. The analysis was done using a static code analyzer PVS-Studio that finds bugs in programs written in C, C++ and C#. PVS-Studio works under Linux and Windows; currently it has more than 400 diagnostics, whose description you may find on this page.
Besides developing the static analyzer, we also check open source projects and write reports about the results. By this moment we have checked more than 280 projects, where we found more than 10 800 errors. These aren't some small and insignificant projects, but quite well known ones: Chromium, Clang, GCC, Roslyn, FreeBSD, Unreal Engine, Mono and others.
PVS-Studio is available for download, that's why I suggest trying it on your project and checking out what it may find in your code.
By the way, PVS-Studio has its own tag on Stack Overflow (link). I recommend asking questions there, so that other developers could quickly find the necessary information without waiting for our reply by the e-mail. In our turn we are always glad to help our users.
This time I want to divert from a traditional flow of the analysis: Downloaded the project - checked - wrote about the found bugs. I also want to tell about some analyzer settings and the ways they can be useful. In particular I will show how to fight against false positives, how to benefit from disabling certain diagnostics and excluding particular files from the analysis. Of course, we will have a look at the errors that PVS-Studio managed to find in the source code TensorFlow.
Now that PVS-Studio is also available under Linux, we have a choice of how to perform the analysis: under Linux or Windows. Quite recently I checked one project under openSUSE, which was quite simple and convenient, but still I decided to check TensorFlow under Windows. It was more familiar for me. What's more, it can be built using CMake which presupposes further work in the Visual Studio IDE, for which we have a special plugin (the latest version obtained code highlighting of erroneous fragments).
Officially, the built of TensorFlow under Windows is not supported (according to the website). Nevertheless, there is also a link of how to build a project using CMake.
As a result we get a set of .vcxproj files, combined as one .sln, which means that further on it will be comfortable to work with the project from Visual Studio, which is great. I worked from the Visual Studio 2017 IDE, whose support was added to the PVS-Studio 6.14 release.
Note. It's a good idea to build a project before the analysis and make sure that it gets compiled and there are no errors. It is necessary to reassure that the analysis will be done efficiently and the analyzer will have all the syntactic and semantic information. There is now a note on the TensorFlow site: By default, building TensorFlow from sources consumes a lot of RAM. Well, it's okay, because I have a 16 GB RAM on the machine. What do you think? During the build I had a Fatal Error C1060 (compiler is out of heap space)! My machine ran our of memory! It was quite unexpected. No, I didn't have five virtual machines running concurrently with the build. In all fairness it has to be added, that using bazel for build, you may limit the number of RAM used (the description is given in TensorFlow build instructions).
I couldn't wait to press the sacred button "Analyze solution with PVS-Studio" and see those interesting bugs we found, but first it would be great to exclude those files from the analysis which aren't much interesting: third-party libraries, for example. It can be easily done in the PVS-Studio settings: on the tab 'Don't Check Files' we set masks of those files and paths, whose analysis is of no interest. The settings already have a certain set of paths (/boost/, for example). I have replenished it with two masks: /third_party/ and /external/. This allows not only excluding warnings from the output window, but also excluding the files of the directories from the analysis, which decreases the analysis time.
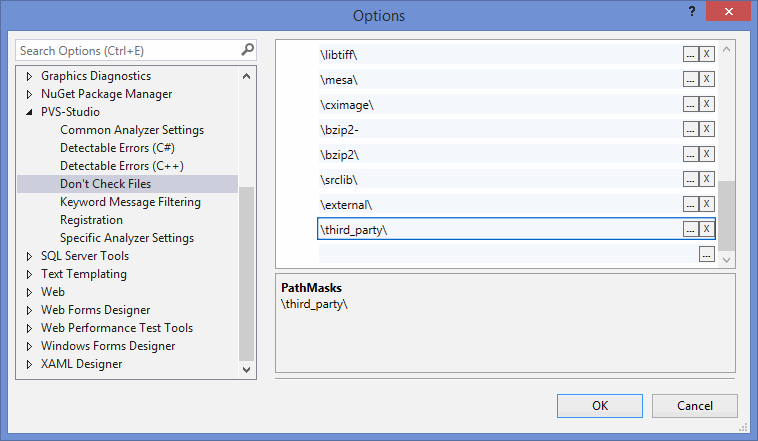
Figure 1 - Set exception analysis in PVS-Studio preferences
Finally, we can run the analysis and see what was found.
Note. 'Don't Check Files' can be configured before and after the analysis. I have just described the first case, the second scenario allows filtering the obtained log, which is also useful and can save you from viewing unnecessary warnings. This will be described below.
False positives - a headache for everybody: for us, the developers of a static code analyzer and for the users because they clutter up useful output. A large number of false positives may repel people from using the tool. In addition, people usually judge the analyzer based on the criteria of the percentage of false positives. It is not that easy as it may seem, and this topic is for another article and discussion. My colleague has recently written an article about this, I recommend having a look at it.
Our task is to try getting rid of the false positives on the analysis stage, so that the users never see them. To do this, we add exceptions to the diagnostic rules, i.e. special cases, when the analyzer shouldn't issue warnings at all. The number of these exceptions can vary greatly from the diagnostic to diagnostic: for some diagnostics we don't have to write exceptions at all and sometimes we may have dozens of such exceptions implemented.
Nevertheless, we aren't able to cover all the cases (sometimes they are too specific), that's why our second task is to allow our user exclude the false positives from the analysis themselves. PVS-Studio provides several mechanisms for this: suppression by comments, configuration files and suppression bases. There is a separate article devoted to this, so I won't go deep into details.
Why have I started speaking about false positives in general? Firstly, because it is very important to fight against false positives, secondly, because of what I saw when I checked TensorFlow and filtered and output by the diagnostic rule V654 (the image is clickable).
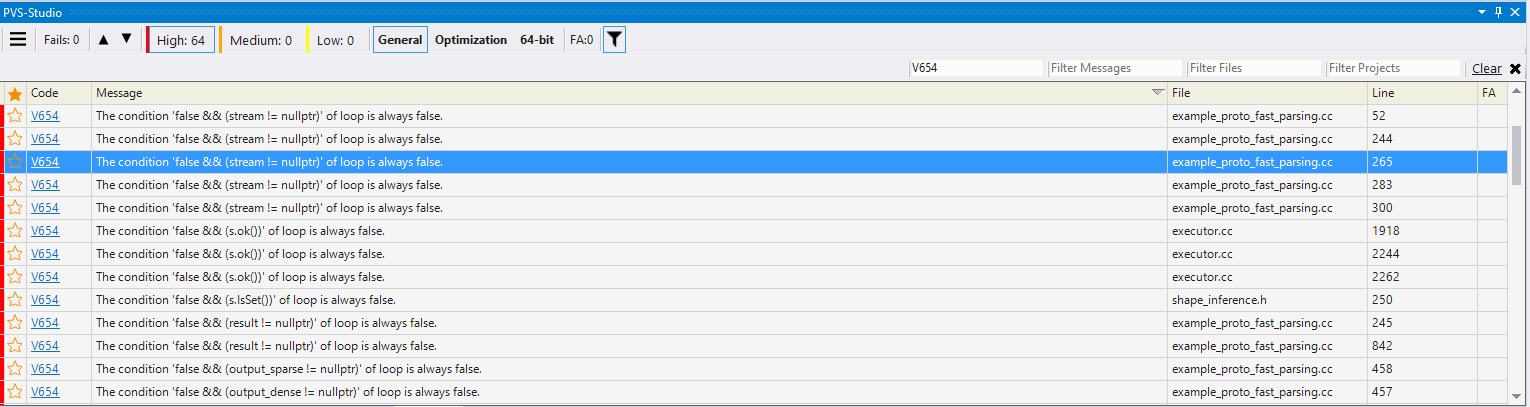
Figure 2 - All the found warnings of V654 have the same pattern
64 warnings and all of them have the same pattern - the following code:
false && exprIn the code itself, these fragments look like this:
DCHECK(v);
DCHECK(stream != nullptr);
DCHECK(result != nullptr);
Here is how the macro DCHECK is declared:
#ifndef NDEBUG
....
#define DCHECK(condition) CHECK(condition)
....
#else
....
#define DCHECK(condition) \
  while (false && (condition)) LOG(FATAL)
....
#endif
What follows from this code? DCHECK - is a debugging macro. In the debug version it is expanded to the check of the condition (CHECK(condition)), in the release version - to a loop that will never be executed - while (false && ....). Since I was building a release version of the code, the macro expanded correspondingly (to the while loop). As a result, the analyzer seems to complain correctly - because the result of the expression is always false. But what's the point of these warnings, if they are issued for the code that was meant to be like this? So, the percentage of false positives for this diagnostic will be the same as on the diagram below.
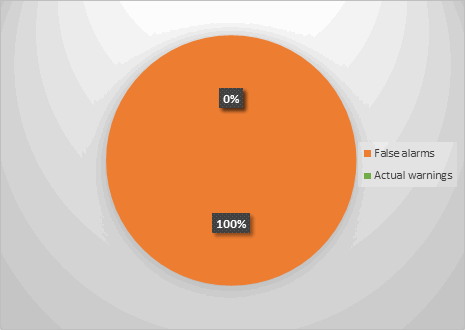
Figure 3 - The ratio of good and false positives of diagnostics V654
You may have thought that this was a joke? No, we are not kidding, there are 100% of false positives. This is exactly what I was talking about. I also said that there are various ways to fight against them. By pressing 'Add selected messages to suppression base' we can correct this to the opposite direction (the image is clickable).
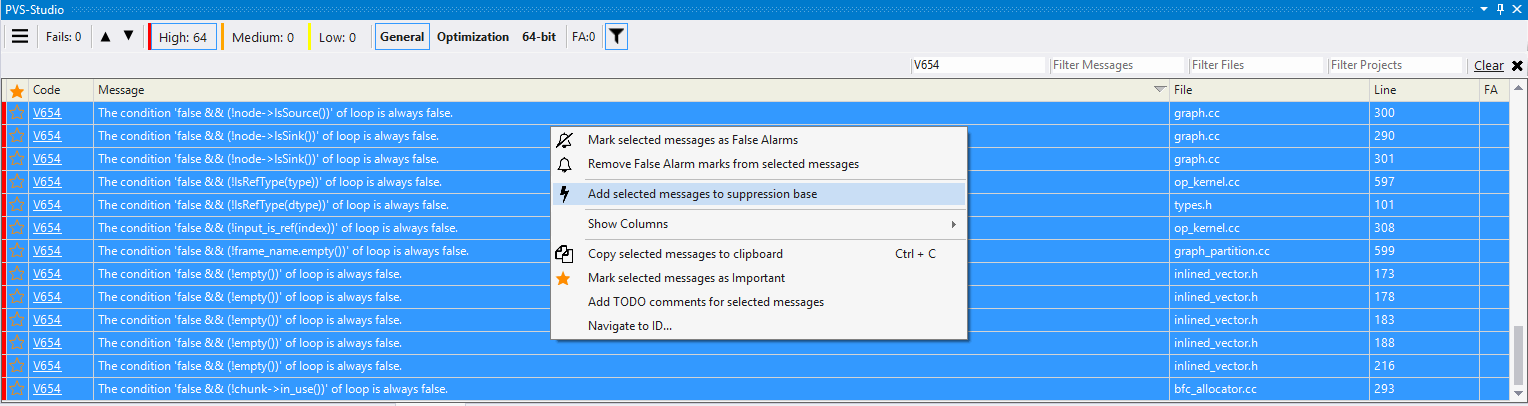
Figure 4 - Fighting against false positives
This is the way to suppress all current warnings by removing them from the output window. But it is not quite correct, because if you start using the DCHECK macro again when writing new code, you will get warnings again. There is a solution. We need to suppress the warning in the macro by leaving a special comment. Then the suppression code will be as follows:
//-V:DCHECK:654
#define DCHECK(condition) \
  while (false && (condition)) LOG(FATAL)
The comment should be written in the same header file, where the macro is declared.
That's it, we may forget about DCHECK macro, because the V654 warning will not be issued for it anymore. As a result, we have successfully dealt with false positives. After these simple actions, the diagram of false positives for V654 will be as follows.
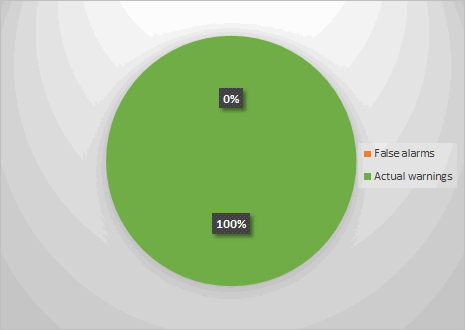
Figure 5 - We successfully eliminated false positives
We see a completely different picture, as the percentage of false positives is 0. Quite an amusing arithmetic. Why did I start talking about false positives in general? I just wanted to explain that false positives are inevitable. The general aim of the analyzer is to decrease their number on the phase of the analysis, but you'll probably have to deal with them due to some peculiarities of the project. I hope I managed to convey that false alarms can be handled (and should be handled), and it is quite simple.
Perhaps, you can't wait to take a look at the bugs we found, but please, be patient and read about couple more settings that will make the life easier during the work with the analysis results.
During the analysis we checked not only the code, which was written manually by the programmers, but the automatically generated. It won't be interesting for us to warning for such code, that's why we will exclude them from the analysis. 'Don't check files' settings are coming to aid here. Specifically for this project, I specified the following file names:
pywrap_*
*.pb.cc
This allowed hiding more than 100 warnings of general analysis (GA) of the medium certainty level.
One more analyzer setting that turned out to be very useful - disabling groups of diagnostic rules. Why can it be relevant? For example, there were about 70 warnings V730 (not all the class members are initialized in the constructor). These warnings really need reviewing, because they might signal about hard-to-detect bugs. Nevertheless, it may not be clear to a person, who is not much familiar with the code, if the uninitialized member will lead to problems or there is another tricky way of it further initialization. For an article, these errors aren't much interesting too. That's why, the developers should really review them and we won't focus on it here. Therefore, we have a goal - to disable a whole group of diagnostic rules. It can be easily done: in settings of the PVS-Studio plugin you should just uncheck the necessary diagnostic.
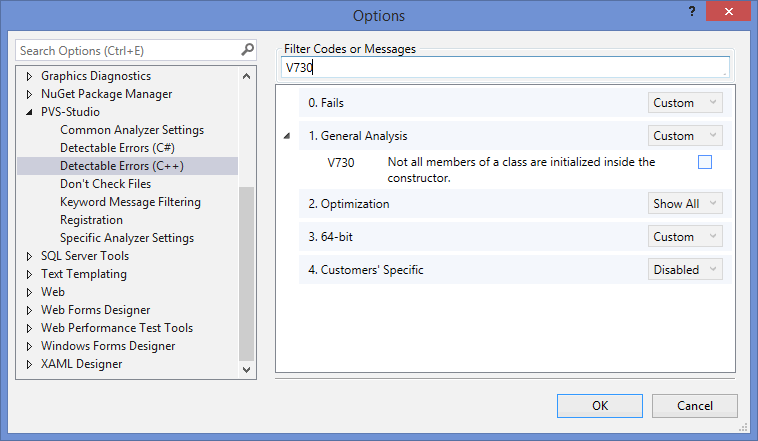
Figure 6 - Disabling irrelevant diagnoses
Disabling those diagnostic rules that are not relevant to your project, you simplify the further work with the output of the analyzer.
Well, now let's move on to the most intriguing part - those code fragments that the analyzer found suspicious.
Usually, I like starting with a classic error, that is made both in C# and C++ projects - an error a == a, which gets detected by V501 and V3001 diagnostic rules. But there are no such errors here! In general, the bugs detected in this project... is quite peculiar... So, here we go.
void ToGraphDef(const Graph* g, GraphDef* gdef, bool pretty) {
  ....
  gtl::InlinedVector<const Edge*, 4> inputs;
  ....
  for (const Edge* e : inputs) {
    const string srcname = NewName(e->src(), pretty);
    if (e == nullptr) {
      ndef->add_input("unknown");
    } else if (!e->src()->IsOp()) {
    } else if (e->IsControlEdge()) {
      ndef->add_input(strings::StrCat("^", srcname));
    } else if (e->src_output() == 0) {
      ndef->add_input(srcname);
    } else {
      ndef->add_input(strings::StrCat(srcname, ":", e->src_output()));
    }
  }
  ....
}PVS-Studio warning: V595 The 'e' pointer was utilized before it was verified against nullptr. Check lines: 1044, 1045. function.cc 1044
In the loop we see that certain vector elements get iterated and depending on the value of the elements, certain actions are performed. The check e == nullptr presupposes that the pointer can be null. The thing is that we see the dereference of this pointer during the call of the function NewName: e->src(). The result of such an operation is undefined behavior, which may lead, inter alia, to the program crash.
But the code of TensorFlow is not that simple. The filling of this vector (inputs) happens earlier and looks as follows:
for (const Edge* e : n->in_edges()) {
  if (e->IsControlEdge()) {
    inputs.push_back(e);
  } else {
    if (inputs[e->dst_input()] == nullptr) {
      inputs[e->dst_input()] = e;
    } else {
      LOG(WARNING) << "Malformed graph node. multiple input edges: "
                   << n->DebugString();
    }
  }
}
Looking carefully at the code, you can understand that the null pointers will never be written to the inputs vector, because there will always be the null pointer dereference before adding the elements, besides that the check against nullptr is missing before the dereference of the pointer. Since the inputs vector won't contain null pointers, it turns out that the statement e == nullptr, that we spoke about before, will always be false.
Anyway, this code is really tricky and PVS-Studio found it really successfully. Let's move on.
Status MasterSession::StartStep(const BuildGraphOptions& opts,
                                int64* count,
                                ReffedClientGraph** rcg,
                                bool is_partial) {
  ....
  ReffedClientGraph* to_unref = nullptr;
  ....
  if (to_unref) to_unref->Unref();
  ....
}PVS-Studio warning: V547 Expression 'to_unref' is always false. master_session.cc 1114
In the body of the method we see that a local variable to_unref is declared, being initialized by the nullptr value. Before the if statement, this pointer is not used in any way, its value doesn't get changed. Thus, the body of the if statement won't be executed, because the pointer remained null. Perhaps, this code was left after the refactoring. There is a chance that this pointer was to be used somewhere between the initialization and the check, but instead of it, the programmer used another one (mixed them up), but I didn't find similar names. Looks suspicious.
Let's go on.
struct LSTMBlockCellBprop ....
{
  ....
  void operator()(...., bool use_peephole, ....) {
  ....
  if (use_peephole) {
    cs_prev_grad.device(d) =
        cs_prev_grad +
        di * wci.reshape(p_shape).broadcast(p_broadcast_shape) +
        df * wcf.reshape(p_shape).broadcast(p_broadcast_shape);
  }

  if (use_peephole) {
    wci_grad.device(d) =
      (di * cs_prev).sum(Eigen::array<int, 1>({0}));
    wcf_grad.device(d) =
      (df * cs_prev).sum(Eigen::array<int, 1>({0}));
    wco_grad.device(d) =
      (do_ * cs).sum(Eigen::array<int, 1>({0}));
  }
  ....
  }
};PVS-Studio warning: V581 The conditional expressions of the 'if' operators situated alongside each other are identical. Check lines: 277, 284. lstm_ops.h 284
There are two conditional operators with an identical conditional statement, but between these statements, the expression (in this case the use_peephole parameter) doesn't get changed. Sometimes it may indicate a serious enough error, when a wrong statement was used in one of the cases, but in this case, judging by the context, we can say that the conditional statements were just duplicated. I think it's not a bug, but all the operations could be put in a single conditional statement.
One does not simply write an write and skip copy-paste errors.
struct CompressFlags {
  ....
  Format format;

  ....
  int quality = 95;

  ....
  bool progressive = false;

  ....
  bool optimize_jpeg_size = false;

  ....
  bool chroma_downsampling = true;

  ....
  int density_unit = 1;
  int x_density = 300;
  int y_density = 300;

  ....
  StringPiece xmp_metadata;

  ....
  int stride = 0;
};

class EncodeJpegOp : public OpKernel {
  ....
  explicit EncodeJpegOp(OpKernelConstruction* context) :
    OpKernel(context) {
    ....
    OP_REQUIRES_OK(context,
      context->GetAttr("quality", &flags_.quality));
    OP_REQUIRES(context,
      0 <= flags_.quality && flags_.quality <= 100,
      errors::InvalidArgument("quality must be in [0,100], got ",
      flags_.quality));
    OP_REQUIRES_OK(context,
      context->GetAttr("progressive",
                       &flags_.progressive));
    OP_REQUIRES_OK(context,
      context->GetAttr("optimize_size",
                       &flags_.optimize_jpeg_size));
    OP_REQUIRES_OK(context,
      context->GetAttr("chroma_downsampling",         // <=
                       &flags_.chroma_downsampling));
    OP_REQUIRES_OK(context,
      context->GetAttr("chroma_downsampling",         // <=
                       &flags_.chroma_downsampling));
    ....
  }
  ....
  jpeg::CompressFlags flags_;
}PVS-Studio warning: V760 Two identical blocks of text were found. The second block begins from line 58. encode_jpeg_op.cc 56
As you can see in the code, the programmer checks the values of the flags, read from the field flags_ in the constructor of the EncodeJpegOp class via the macros OP_REQUIRES_OK and OP_REQUIRES. However, in the last lines of the given fragment, the value of the same flag is checked for the constructor. It looks very much like copy-paste: the code was copied, but not edited.
The most interesting (and the hardest part) is to understand if the copy-paste redundant or something else was meant to be here. If the code is redundant, then there is nothing horrible, but the situation is completely different, if another code fragment was meant here, because we get a logical error here.
Having reviewed the body of the constructor, I haven't found the check of the stride field. Perhaps, in one of the cases, this very check was meant to be. On the other hand, the order of the fields in the constructor is similar with the order of field declaration in the structure CompressFlags. Thus, it's hard to say how this code should be fixed, we can only make assumptions. In any case, this code is worth paying attention to.
The analyzer also found several suspicious fragments related to the bit shifting. Let's have a look at them. I want to remind, that incorrect use of the shift operations leads to undefined behavior.
class InferenceContext {
  ....
  inline int64 Value(DimensionOrConstant d) const {
    return d.dim.IsSet() ? d.dim->value_ : d.val;
  }
  ....
}
REGISTER_OP("UnpackPath")
    .Input("path: int32")
    .Input("path_values: float")
    .Output("unpacked_path: float")
    .SetShapeFn([](InferenceContext* c) {
      ....
      int64 num_nodes = InferenceContext::kUnknownDim;
      if (c->ValueKnown(tree_depth)) {
        num_nodes = (1 << c->Value(tree_depth)) - 1;    // <=
      }
      ....
    })
....;PVS-Studio warning: V629 Consider inspecting the '1 << c->Value(tree_depth)' expression. Bit shifting of the 32-bit value with a subsequent expansion to the 64-bit type. unpack_path_op.cc 55
The strangeness of this code is in the fact that the 32 and 64 bit values are mixed in the shift and assignment operations. The literal 1 is a 32-bit value, for which a left-side shift is performed. The result of the shift still has a 32-bit type, but is written to the 64-bit variable. It is suspicious, because we may get undefined behavior if the value returned by the Value method is more than 32.
Here is a quote from the standard: The value of E1 << E2 is E1 left-shifted E2 bit positions; vacated bits are zero-filled. If E1 has an unsigned type, the value of the result is E1 * 2^E2, reduced modulo one more than the maximum value representable in the result type. Otherwise, if E1 has a signed type and non-negative value, and E1*2^E2 is representable in the result type, then that is the resulting value; otherwise, the behavior is undefined.
This code can be fixed by writing 1 as a 64-bit literal or doing the type extension via casting. More details on the shift operations can be found in the article "Wade not in unknown waters. Part three".
The extension through the casting was used in another fragment as well. Here is the code:
AlphaNum::AlphaNum(Hex hex) {
  ....
  uint64 value = hex.value;
  uint64 width = hex.spec;
  // We accomplish minimum width by OR'ing in 0x10000 to the user's
  // value,
  // where 0x10000 is the smallest hex number that is as wide as the
  // user
  // asked for.
  uint64 mask = ((static_cast<uint64>(1) << (width - 1) * 4)) | value;
  ....
}PVS-Studio warning: V592 The expression was enclosed by parentheses twice: ((expression)). One pair of parentheses is unnecessary or misprint is present. strcat.cc 43
This code is actually correct, but the analyzer found it suspicious, having detected duplicate parentheses. The analyzer thinks in the following way: the double brackets do not affect the evaluation result, so perhaps one pair of brackets is placed not where it should be.
We cannot exclude that the brackets were probably meant to explicitly underline the precedence of evaluations and to avoid remembering the priorities of the operations '<<' and '*'. They aren't much necessary as they are in the wrong place anyway. I reckon that this evaluation order is correct (first we specify a shift value, and then do the shift itself), so we just have to put the brackets in the correct order, so that they do not confuse people.
uint64 mask = (static_cast<uint64>(1) << ((width - 1) * 4)) | value;Let's go on.
void Compute(OpKernelContext* context) override {
  ....
  int64 v = floor(in_x);
  ....
  v = ceil(in_x1);
  x_interp.end = ceil(in_x1);
  v = x_interp.end - 1;
  ....
}PVS-Studio warning: V519 The 'v' variable is assigned values twice successively. Perhaps this is a mistake. Check lines: 172, 174. resize_area_op.cc 174
The v variable is assigned twice, but between these assignments, the value of this variable is not used in any way. Moreover, the variable x_interp.end is assigned with the same value of the variable that was written to the v variable. Even if we omit the fact that the call of the ceil function is redundant here, as it is not critical (although...), the code looks strange: either it is weirdly written or it contains a tricky error.
What's next?
void Compute(OpKernelContext* context) override {
  ....
  int64 sparse_input_start;                                     // <=
  ....
  if (sparse_input) {
    num_total_features += GetNumSparseFeatures(
      sparse_input_indices, *it, &sparse_input_start);          // <=
  }
  if (num_total_features == 0) {
    LOG(WARNING) << "num total features is zero.";
    break;
  }
  if (rand_feature < input_spec_.dense_features_size()) {
    ....
  } else {
    ....
    const int32 sparse_index = sparse_input_start +             // <=
      rand_feature - input_spec_.dense_features_size();
    ....
  }
  ....
}PVS-Studio warning: V614 Potentially uninitialized variable 'sparse_input_start' used. sample_inputs_op.cc 351
The suspicious thing about this code is that during the initialization of the sparse_index constant, a potentially uninitialized variable sparse_input_start can also be used. At the time of declaration, this variable is not initialized with any value, i.e. it contains some junk. Further on, in case the statement sparse_input is true, the address of the variable sparse_input_start is passed to the function GetNumSparseFeatures, where perhaps, the variable initialization takes place. Otherwise, if the body of this conditional operator isn't executed, sparse_input_start will remain uninitialized.
Of course, we can suppose that in case if sparse_input_start remains uninitialized, it won't get used, but it's too bold and unobvious, so better to set a standard value for the variable.
Well, yes and no. To be honest, I was hoping to find more defects and write an article in the style of the articles Qt, Mono, Unreal Engine 4 and similar to them, but it didn't work. The project authors did a great job, there were not so many errors found. I was also hoping that the project would of a bigger size, but there were only 700 files checked in the chosen configuration, including the auto generated files.
Besides that, a lot of things were left outside the scope of this article, for example:
Nevertheless, there was quite a number of interesting fragments found, which we reviewed in this article.
TensorFlow turned out to be quite an interesting and high-quality project in terms of code, but, as we saw, not without flaws. At the same time PVS-Studio proved once more that it is able to find errors even in the code of well-known developers.
In conclusion, I cannot but compliment all the developers of TensorFlow for the qualitative code and wish them the best of luck in the future.

Thank you for the attention to those who got to the end of the article and don't forget to use PVS-Studio!
0
0
0
0