
Our website uses cookies to enhance your browsing experience.


Our company develops, promotes, and sells the PVS-Studio static code analyzer for C/C++ programmers. However, our collaboration with customers is not limited solely to selling PVS-Studio licenses. For example, we often take on contract projects as well. Due to NDAs, we're not usually allowed to reveal details about this work, and you might not be familiar with the projects names, anyway. But this time, we think you'll be excited by our latest collaboration. Together with Epic Games, we 're working on the Unreal Engine project. This is what we're going to tell you about in this article.
This article was originally published at Unreal Engine Blog. Republished by the editors' permission.

As a way of promoting our PVS-Studio static code analyzer, we've thought of an interesting format for our articles: We analyze open-source projects and write about the bugs we manage to find there. Take a look at this updatable list of projects we have already checked and written about. This activity benefits everyone: readers enjoy learning from others' mistakes and discover new means to avoid them through certain coding techniques and style. For us, it's a way to have more people learn about our tool. As for the project authors, they too benefit by gaining an opportunity to fix some of the bugs.
Among the articles was "A Long-Awaited Check of Unreal Engine 4". Unreal Engine's source code was extraordinarily high quality, but all software projects have defects and PVS-Studio is excellent at surfacing some of the most tricky bugs. We ran an analysis and reported our findings to Epic. The Unreal Engine teamT thanked us for checking their code, and quickly fixed the bugs we reported. But we didn't want to stop there, and thought we should try selling a PVS-Studio license to Epic Games.
Epic Games was very interested in using PVS-Studio to improve the engine continuously over time. They suggested we analyze and fix Unreal Engine's source code so that they were completely clear of bugs and the tool wouldn't generate any false positives in the end. Afterwords, Epic would use PVS-Studio on their code base themselves, thus making its integration into their development process as easy and smooth as possible. Epic Games promised to not only purchase the PVS-Studio license, but would also pay us for our work.
We accepted the offer. The job is done. And now you are welcome to learn about various interesting things we came across while working on Unreal Engine's source code.
Pavel Eremeev, Svyatoslav Razmyslov, and Anton Tokarev were the participants on the PVS-Studio's part. On the Epic Game's, the most active participants were Andy Bayle and Dan O'Connor - it all would have been impossible without their help, so many thanks to them!
To manage the build process, Unreal Engine employs a build system of its own - Unreal Build Tool. There is also a set of scripts to generate project files for a number of different platforms and compilers. Since PVS-Studio is first of all designed to work with the Microsoft Visual C++ compiler, we used the corresponding script to generate project files (*.vcxproj) for the Microsoft Visual Studio IDE.
PVS-Studio comes with a plugin that can integrate into the Visual Studio IDE and enables a "one-click" analysis. However, projects generated for Unreal Engine are not the "ordinary" MSBuild projects used by Visual Studio.
When compiling Unreal Engine from Visual Studio, the IDE invokes MSBuild when starting the build process, but MSBuild itself is used just as a "wrapper" to run the Unreal Build Tool program.
To analyze the source code in PVS-Studio, the tool needs a preprocessor's output - an *.i file with all the headers included and macros expanded.
Quick note. This section is only interesting if you have a customized build process like Unreal's If you are thinking of trying PVS-Studio on a project of yours that has some intricate peculiarities about its build process, I recommend reading this section to the end. Perhaps it will be helpful for your case. But if you have an ordinary Visual Studio project or can't wait to read about the bugs we have found, you can skip it.
To launch the preprocessor correctly, the tool needs information about compilation parameters. In "ordinary" MSBuild projects, this information is inherent; the PVS-Studio plugin can "see" it and automatically preprocess all the necessary source files for the analyzer that will be called afterwards. With Unreal Engine projects, things are different.
As I've already said above, their projects are just a "wrapper" while the compiler is actually called by Unreal Build Tool. That's why compilation parameters in this case are not available for the PVS-Studio plugin for Visual Studio. You just can't run analysis "in one click", though the plugin can be used to view the analysis results.
The analyzer itself (PVS-Studio.exe) is a command-line application that resembles the C++ compiler regarding the way it is used. Just like the compiler, it has to be launched individually for every source file, passing this file's compilation parameters through the command line or response file. And the analyzer will automatically choose and call the appropriate preprocessor and then perform the analysis.
Thus, the universal solution for integrating the PVS-Studio analyzer into the build process is to call its exe-file in the same place where the compiler is called, i.e. inside the build system - Unreal Build Tool in our case. Sure, it will require modifying the current build system, which may not be desirable, as in our case. Because of that, just for cases like this, we created a compiler call "intercepting" system - Compiler Monitoring.
The Compiler Monitoring system can "intercept" compilation process launches (in the case with Visual C++, thisis the cl.exe proces), collecting all of the parameters necessary for successful preprocessing, thenre-launch preprocessing for files under compilation for further analysis. That's what we did.
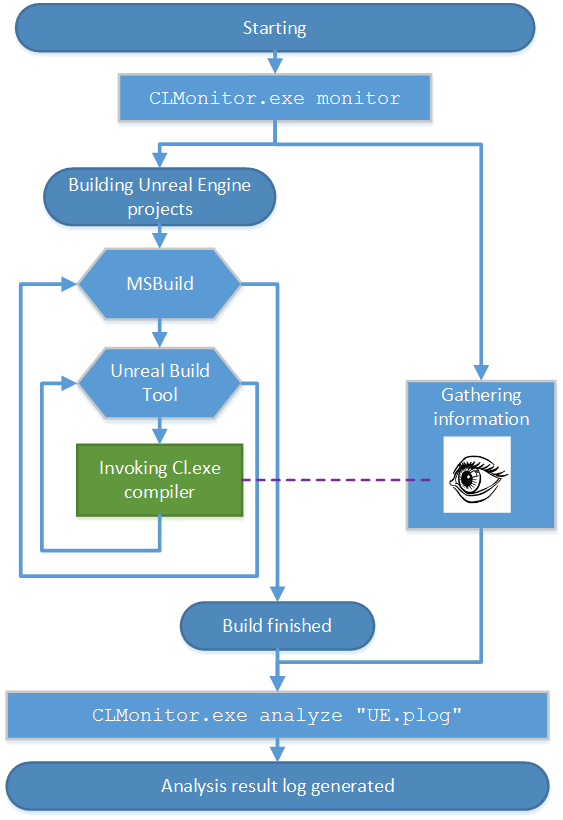
Figure 1. A scheme of the analysis process for the Unreal Engine project
Unreal Engine analysis integration comes down to calling, right before the build process, the monitoring process (CLMonitor.exe) that will make all the necessary steps to do the preprocessing and launch the analyzer at the end of the build process. To run the monitoring process, we need to run a simple command:
CLMonitor.exe monitorCLMonitor.exe will call itself in "tracking mode" and terminate. At the same time, another CLMonitor.exe process will remain running in the background "intercepting" the compiler calls. When the build process is finished, we need to run another simple command:
CLMonitor.exe analyze "UE.plog"Please pay attention: in PVS-Studio 5.26 and above you should write:
CLMonitor.exe analyze –l "UE.plog"Now CLMonitor.exe will launch the analysis of previously-collected source files, saving the results into the UE.plog file that can be easily handled in our IDE plugin.
We set a nightly build process of the most interesting Unreal Engine configurations followed by their analysis on our Continuous Integration server. It was a means for us to, first, make sure our edits hadn't broken the build and, second, to get in the morning a new log about Unreal Engine's analysis with all the edits of the previous day taken into account. So, before sending a Pull Request for submitting our edits to the Unreal Engineproject repository on GitHub, we could easily make sure that the current version was stable in our repository by simply rebuilding it on the server.
So, we have solved the project build process and analysis. Now let's talk about bug fixes we've done based on the diagnostic messages output by the analyzer.
At first glance, it may seem natural that the number of warnings output by the analyzer should drop evenly from day to day: about the same number of messages is suppressed by certain PVS-Studio mechanisms as the number of fixes that are done in the code.
That is, theoretically you could expect a graph looking somewhat like this:
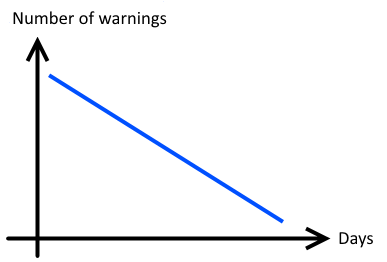
Figure 2. A perfect graph. The number of bugs drops evenly from day to day.
In reality, however, messages are eliminated faster during the initial phase of the bug fixing process than at the later stages. First, at the initial stage, we suppress warnings triggered by macros, which helps quickly reduce the overall number of issues. Second, it happened so that we had fixed the most evident issues first and put off more intricate things until later. I can explain on this. We wanted to show the Epic Games developers that we had started working and there was a progress. It would be strange to start with difficult issues and get stuck there, wouldn't it?
It took us 17 working days in total analyzing the Unreal Engine code and fixing bugs. Our goal was to eliminate all the general analysis messages of the first and second severity levels. Hereis how the work progressed:
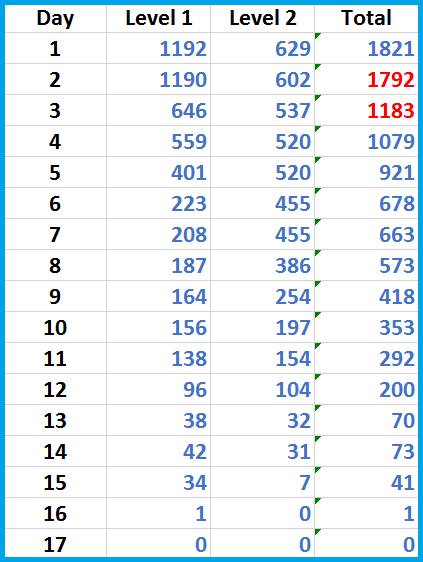
Table 1. The number of warnings remaining on each day.
Notice the red figures. During the first two days, we were getting accustomed to the project and then suppressed warnings in some macros, thus greatly reducing the number of false positives.
Seventeen working days is quite a lot and I'd like to explain why it required this amount of time. First, it was not the whole team that worked on the project, but only two of its members. Of course, they were busy with some other tasks as well during this time. Secondly, Unreal Engine's code was entirely unfamiliar to us, so making fixes was quite a tough job. We had to stop every now and then to figure out if and how we should fix a certain spot.
Now, here is the same data in the form of a smoothed graph:
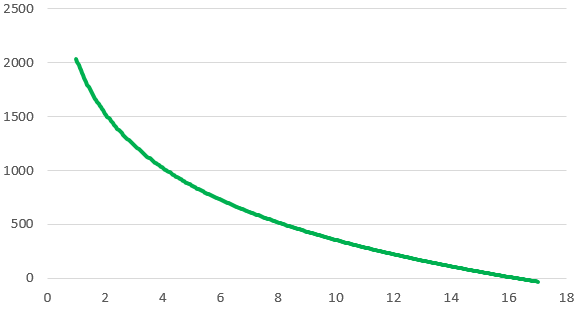
Figure 3. A smoothed graph of the warning numbers over time.
A practical conclusion - to remember ourselves and tell others: It's a bad idea to try estimating the time it will take you to fix all the warnings based on only the first couple of days of work. It's very pacey at first, so the forecast may appear too optimistic.
But we still needed to make an estimate somehow. I think there should be a magical formula for this, and hopefully we'll discover it and show it to the world someday. But presently, we are too short of statistical data to offer something reliable.
We have fixed quite a lot of code fragments. These fixes can be theoretically grouped into 3 categories:
As I promised, here are some examples of the bugs. We have picked out the most interesting defects that were clear to understand.
The first interesting message by PVS-Studio: V506 Pointer to local variable 'NewBitmap' is stored outside the scope of this variable. Such a pointer will become invalid. fontcache.cpp 466
void GetRenderData(....)
{
  ....
  FT_Bitmap* Bitmap = nullptr;
  if( Slot->bitmap.pixel_mode == FT_PIXEL_MODE_MONO )
  {
    FT_Bitmap NewBitmap;
    ....
    Bitmap = &NewBitmap;
  }
  ....
  OutRenderData.RawPixels.AddUninitialized(
    Bitmap->rows * Bitmap->width );
  ....
}
The address of the NewBitmap object is saved into the Bitmap pointer. The trouble with it is that right after this, the NewBitmap object's lifetime expires and it is destroyed. So it turns out that Bitmap is pointing to an already destroyed object.
When trying to use a pointer to address a destroyed object, undefined behavior occurs. What form it will take is unknown. The program may work well for years if you are lucky enough that the data of the dead object (stored on the stack) is not overwritten by something else.
A correct way to fix this code is to move NewBitmap's declaration outside the 'if' operator:
void GetRenderData(....)
{
  ....
  FT_Bitmap* Bitmap = nullptr;

  FT_Bitmap NewBitmap;
  if( Slot->bitmap.pixel_mode == FT_PIXEL_MODE_MONO )
  {
    FT_Bitmap_New( &NewBitmap );
    // Convert the mono font to 8bbp from 1bpp
    FT_Bitmap_Convert( FTLibrary, &Slot->bitmap, &NewBitmap, 4 );

    Bitmap = &NewBitmap;
  }
  else
  {
    Bitmap = &Slot->bitmap;
  }
  ....
  OutRenderData.RawPixels.AddUninitialized(
    Bitmap->rows * Bitmap->width );
  ....
}
The next warning by PVS-Studio: V522 Dereferencing of the null pointer 'GEngine' might take place. Check the logical condition. gameplaystatics.cpp 988
void UGameplayStatics::DeactivateReverbEffect(....)
{
  if (GEngine || !GEngine->UseSound())
  {
    return;
  }
  UWorld* ThisWorld = GEngine->GetWorldFromContextObject(....);
  ....
}
If the GEngine pointer is not null, the function returns and everything is OK. But if it is null, it gets dereferenced.
We fixed the code in the following way:
void UGameplayStatics::DeactivateReverbEffect(....)
{
  if (GEngine == nullptr || !GEngine->UseSound())
  {
    return;
  }

  UWorld* ThisWorld = GEngine->GetWorldFromContextObject(....);
  ....
}
An interesting typo is waiting for you in the next code fragment. The analyzer has detected there a meaningless function call: V530 The return value of function 'Memcmp' is required to be utilized. pathfollowingcomponent.cpp 715
int32 UPathFollowingComponent::OptimizeSegmentVisibility(
  int32 StartIndex)
{
  ....
  if (Path.IsValid())
  {
    Path->ShortcutNodeRefs.Reserve(....);
    Path->ShortcutNodeRefs.SetNumUninitialized(....);
  }
  FPlatformMemory::Memcmp(Path->ShortcutNodeRefs.GetData(),
                          RaycastResult.CorridorPolys,
                          RaycastResult.CorridorPolysCount *
                            sizeof(NavNodeRef));
  ....
}
The return result of the Memcmp function is not used. And this is what the analyzer didn't like.
The programmer actually intended to copy a region of memory through the Memcpy() function but made a typo. This is the fixed version:
int32 UPathFollowingComponent::OptimizeSegmentVisibility(
  int32 StartIndex)
{
  ....
  if (Path.IsValid())
  {
    Path->ShortcutNodeRefs.Reserve(....);
    Path->ShortcutNodeRefs.SetNumUninitialized(....);

    FPlatformMemory::Memcpy(Path->ShortcutNodeRefs.GetData(),
                            RaycastResult.CorridorPolys,
                            RaycastResult.CorridorPolysCount *
                              sizeof(NavNodeRef));
  }
  ....
}
Now let's talk about a diagnostic message you are sure to encounter in nearly every project - so common is the bug it refers to. We are talking about the V595 diagnostic. In our bug database, it is at the top of the list regarding the frequency of its occurrence in projects (see examples). At first glance, that list is not as large as, say, for the V501 diagnostic. But it's actually because V595 diagnostics are somewhat boring and we don't write out many of them from every single project. We usually just cite one example and add a note like: And 161 additional diagnostic messages. In half of the cases, these are real errors. This is what it looks like:
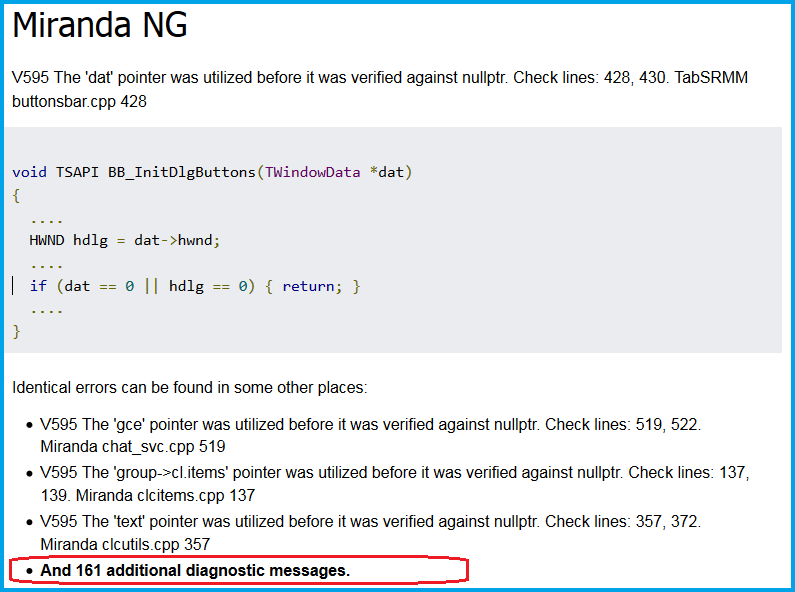
Figure 4. The dread of V595 diagnostic.
Diagnostic rule V595 is designed to detect code fragments where a pointer is dereferenced before being checked for null. We always find some quantity of these in projects we analyze. The pointer check and dereferencing operation may be set quite far from each other within a function - tens or even hundreds of lines away, which makes it harder to fix the bug. But there are also small and very representative examples like, for example, this function:
float SGammaUIPanel::OnGetGamma() const
{
  float DisplayGamma = GEngine->DisplayGamma;
  return GEngine ? DisplayGamma : 2.2f;
}
PVS-Studio's diagnostic message: V595 The 'GEngine' pointer was utilized before it was verified against nullptr. Check lines: 47, 48. gammauipanel.cpp 47
We fixed this in the following way:
float SGammaUIPanel::OnGetGamma() const
{
  return GEngine ? GEngine->DisplayGamma : 2.2f;
}
Moving on to the next fragment:
V517 The use of 'if (A) {...} else if (A) {...}' pattern was detected. There is a probability of logical error presence. Check lines: 289, 299. automationreport.cpp 289
void FAutomationReport::ClustersUpdated(const int32 NumClusters)
{
  ...
  //Fixup Results array
  if( NumClusters > Results.Num() )         // <=
  {
    for( int32 ClusterIndex = Results.Num();
         ClusterIndex < NumClusters; ++ClusterIndex )
    {
      ....
      Results.Add( AutomationTestResult );
    }
  }
  else if( NumClusters > Results.Num() )    // <=
  {
    Results.RemoveAt(NumClusters, Results.Num() - NumClusters);
  }
  ....
}
In its current form, the second condition will never be true. It is logical to assume that the mistake has to do with the sign used in it that initially was meant to provide for removing unnecessary items from the 'Result' array:
void FAutomationReport::ClustersUpdated(const int32 NumClusters)
{
  ....
  //Fixup Results array
  if( NumClusters > Results.Num() )
  {
    for( int32 ClusterIndex = Results.Num();
         ClusterIndex < NumClusters; ++ClusterIndex )
    {
      ....
      Results.Add( AutomationTestResult );
    }
  }
  else if( NumClusters < Results.Num() )
  {
    Results.RemoveAt(NumClusters, Results.Num() - NumClusters);
  }
  ....
}
And here's a code sample to test your attentiveness. The analyzer's warning: V616 The 'DT_POLYTYPE_GROUND' named constant with the value of 0 is used in the bitwise operation. pimplrecastnavmesh.cpp 2006
/// Flags representing the type of a navigation mesh polygon.
enum dtPolyTypes
{
  DT_POLYTYPE_GROUND = 0,
  DT_POLYTYPE_OFFMESH_POINT = 1,
  DT_POLYTYPE_OFFMESH_SEGMENT = 2,
};

uint8 GetValidEnds(...., const dtPoly& Poly)
{
  ....
  if ((Poly.getType() & DT_POLYTYPE_GROUND) != 0)
  {
    return false;
  }
  ....
}
Everything looks fine at a first glance. You may think that some bit is allocated by mask and its value is checked. But it is actually just named constants that are defined in the 'dtPolyTypes' enumeration and they are not meant for allocating any certain bits.
In this condition, the DT_POLYTYPE_GROUND constant equals 0, which means the condition will never be true.
The fixed code:
uint8 GetValidEnds(...., const dtPoly& Poly)
{
  ....
  if (Poly.getType() == DT_POLYTYPE_GROUND)
  {
    return false;
  }
  ....
}
A typo detected: V501 There are identical sub-expressions to the left and to the right of the '||' operator: !bc.lclusters ||!bc.lclusters detourtilecache.cpp 687
dtStatus dtTileCache::buildNavMeshTile(....)
{
  ....
  bc.lcset = dtAllocTileCacheContourSet(m_talloc);
  bc.lclusters = dtAllocTileCacheClusterSet(m_talloc);
  if (!bc.lclusters || !bc.lclusters)   // <=
    return status;
  status = dtBuildTileCacheContours(....);
  ....
}
When copy-pasting a variable, the programmer forgot to rename it from 'bc.lclusters' into 'bc.lcset'.
The examples above are by far not all the bugs found in the project, but just a small part of them. We cited them to show you what kind of bugs PVS-Studio can find, even in world-class thoroughly-tested code.
However, we'd remind you that running a single code base analysis is not the right way to use a static analyzer. Analysis needs to be performed regularly - only then will it enable you to catch a huge bulk of bugs and typos early in the coding stage, instead of the testing or maintenance stages.
The Unreal Engine project is a wonderful opportunity to prove our words with real-life examples.
Initially we fixed defects in the code without keeping track of whether they were fresh changes or old. It simply wasn't interesting in the early stages, when there were so many bugs to get through. But we did notice how the PVS-Studio analyzer started detecting bugs in freshly written or modified code after we cut the number of warnings to 0.
In fact, it took us a bit longer than 17 days to finish with this code. When we stopped making edits and achieved a "zero defect" message from the analyzer, we had to wait for two days more for the Unreal Engine team to integrate our final Pull Request. During this time, we continually updated our version of the code base from the Epic's repository, and analyzing the new code.
We could see the analyzer detect bugs in new code during those two days. Those bugs, we also fixed. This is a great example of how useful regular static analysis checks are.
In fact, the tip of the "number of warnings" graph now looked like this:
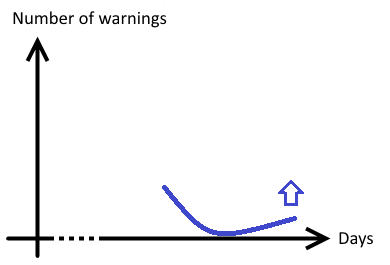
Figure 5. A schematic graph representing the growth of the warning number after it was cut to 0.
Now let's see what we managed to find during those last two days, when analyzing fresh updates of the project code.
Message one: V560 A part of conditional expression is always true: FBasicToken::TOKEN_Guid. k2node_mathexpression.cpp 235
virtual FString ToString() const override
{
  if (Token.TokenType == FBasicToken::TOKEN_Identifier ||
      FBasicToken::TOKEN_Guid) // <=
  {
    ....
  }
  else if (Token.TokenType == FBasicToken::TOKEN_Const)
  {
    ....
}
The programmer forgot to write "Token.TokenType ==". It will cause the condition to always be true since the named constant 'FBasicToken::TOKEN_Guid' is not equal to 0.
Message two: V611 The memory was allocated using 'new T[]' operator but was released using the 'delete' operator. Consider inspecting this code. It's probably better to use 'delete [] CompressedDataRaw;'. crashupload.cpp 222
void FCrashUpload::CompressAndSendData()
{
  ....
  uint8* CompressedDataRaw = new uint8[BufferSize];         // <=

  int32 CompressedSize = BufferSize;
  int32 UncompressedSize = UncompressedData.Num();
  ....
  // Copy compressed data into the array.
  TArray<uint8> CompressedData;
  CompressedData.Append( CompressedDataRaw, CompressedSize );
  delete CompressedDataRaw;                                 // <=
  CompressedDataRaw = nullptr;
  ....
}
This bug doesn't always show up in practice as we are dealing with allocation of an array of items of the char type. But it is still a bug that can cause undefined behavior and must be fixed.
Message one: V521 Such expressions using the ',' operator are dangerous. Make sure the expression is correct. unrealaudiodevicewasapi.cpp 128
static void GetArrayOfSpeakers(....)
{
  Speakers.Reset();
  uint32 ChanCount = 0;
  // Build a flag field of the speaker outputs of this device
  for (uint32 SpeakerTypeIndex = 0;
       SpeakerTypeIndex < ESpeaker::SPEAKER_TYPE_COUNT,    // <=
       ChanCount < NumChannels; ++SpeakerTypeIndex)
  {
    ....
  }

  check(ChanCount == NumChannels);
}
A nice, fat bug.
The comma operator ',' is used to execute the two expressions to the either side of it in the left-to-right order and get the value of the right operand.
As a result, the loop termination condition is represented by the following check only: ChanCount < NumChannels.
The fixed condition:
static void GetArrayOfSpeakers(....)
{
  Speakers.Reset();
  uint32 ChanCount = 0;
  // Build a flag field of the speaker outputs of this device
  for (uint32 SpeakerTypeIndex = 0;
       SpeakerTypeIndex < ESpeaker::SPEAKER_TYPE_COUNT &&
       ChanCount < NumChannels; ++SpeakerTypeIndex)
  {
    ....
  }
  check(ChanCount == NumChannels);
}
Message two. V543 It is odd that value '-1' is assigned to the variable 'Result' of HRESULT type. unrealaudiodevicewasapi.cpp 568
#define S_OK       ((HRESULT)0L)
#define S_FALSE    ((HRESULT)1L)

bool
FUnrealAudioWasapi::OpenDevice(uint32 DeviceIndex,
                               EStreamType::Type StreamType)
{
  check(WasapiInfo.DeviceEnumerator);

  IMMDevice* Device = nullptr;
  IMMDeviceCollection* DeviceList = nullptr;
  WAVEFORMATEX* DeviceFormat = nullptr;
  FDeviceInfo DeviceInfo;
  HRESULT Result = S_OK;                      // <=
  ....
  if (!GetDeviceInfo(DataFlow, DeviceIndex, DeviceInfo))
  {
    Result = -1;                              // <=
    goto Cleanup;
  }
  ....
}
HRESULT is a 32-bit value split into three different fields: error severity code, device code, and error code. To work with HRESULT, special constants are used such as S_OK, E_FAIL, E_ABORT, and so on. And to check HRESULT values, such macros as SUCCEEDED and FAILED are used.
Warning V543 is output only when the programmer attempts to write values -1, true, or false into a variable of the HRESULT type.
Writing the value "-1" is incorrect. If you want to report some unknown error, you should use the value 0x80004005L (Unspecified failure). This and other similar constants are defined in "WinError.h".
It may make some programmers and managers feel sad to learn that they need over two weeks to integrate static analysis into their project. But you don't necessarily have to go this way. You just should understand that the Epic Games developers chose an IDEAL PATH, yet not the simplest and quickest one.
Yes, the ideal scenario is to get rid of all the bugs right away and then promptly address only new messages triggered by freshly written code. But you can also start benefiting from static analysis without having to spend time up front fixing the old code.
PVS-Studio actually offers a special "message marking" mechanism for this purpose. Below is a general description of this feature:
All the messages output by the analyzer are marked in a special database as inactive. After that, the user can see only those messages which refer to freshly written or modified code. That is, you can start benefiting from static analysis right away. And then, when you have time and mood, you can gradually work on messages for the old code.
For details on this subject, see the following sources: documentation, how to quickly integrate static analysis into your project.
After publishing every new article about checking some project, people will ask: "Have you reported the bugs to the project authors?" And of course we always do! But this time, we've not only "reported the bugs to the authors" but fixed all those bugs ourselves. Everyone interested can benefit from the results themselves in the Unreal Engine repository on GitHub (after you've created an Epic Games account and linked your GitHub account)
We hope that developers using Unreal Engine will appreciate PVS-Studio's role in improving Unreal Engine's source codend we are looking forward to seeing many awesome new Unreal Engine-based projects!
Here are some final conclusions to draw from the results of our work:
Thanks to everyone for reading this article. May your code stay bugless! Sincerely yours, developers of the PVS-Studio analyzer. It's a good time right now to download and try it on your project.
0
0
0
0