
Our website uses cookies to enhance your browsing experience.
Webinar: Let's make a programming language. Lexer - 29.04

Static analysis goes beyond just running a check. How to handle reports, send warnings to developers, and visualize results? We'll show you how to use PVS-Studio utilities and integrations to transform raw analyzer data into an effective code enhancement process.

In previous articles, we discussed the importance of performing regular static code analyses and how to incorporate them into your development workflow, including via Pull Request analysis and CI/CD automation.
However, running the analysis is only the beginning. Being able to work with the information the analyzer provides is also important. After all, obtaining results is only the first step. They must be handled and delivered to the right people in a way that makes them easy to understand. Ultimately, the analyzer report must lead to real changes.
Today, we'll show you how to use different tools to streamline the process of handling the analyzer report and distribute the task of processing the analysis results among the entire team.
An effective way to improve the experience of working with a static analyzer during the development stage is to integrate it into an IDE using special plugins. Such plugins allow you to perform analysis directly from the IDE interface without leaving your workspace. They also enable you to conveniently view the results, display warnings in real time, navigate to erroneous code fragments with a single click, and apply automatic fixes. This significantly reduces the cognitive load on developers and speeds up the process of identifying and eliminating errors early on.
Let's take a look at the PVS-Studio plugin for IntelliJ IDEA, for example.
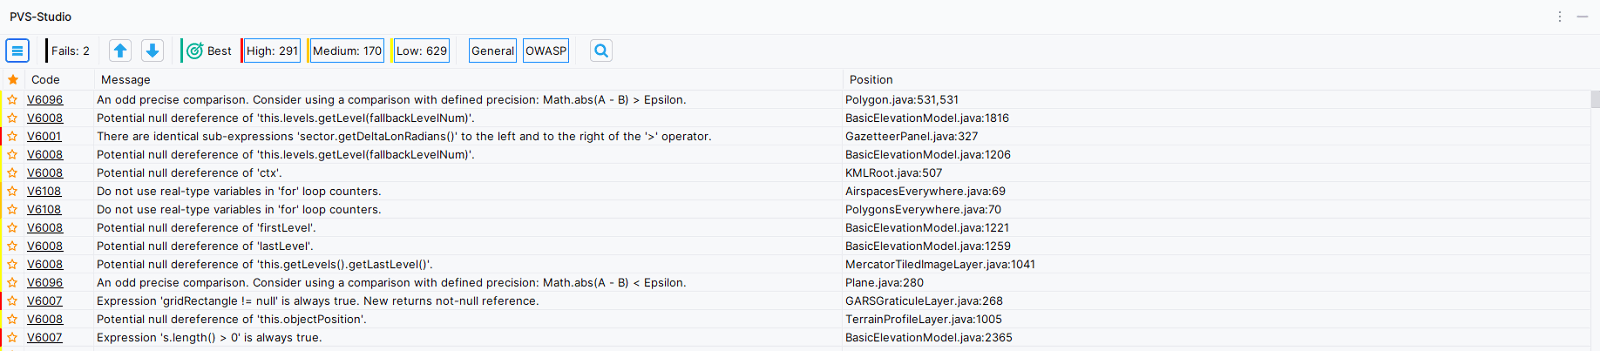
A separate IDE window displays a table containing the results of the analyzer work. Here, we can conveniently filter warnings by the diagnostic rule reliability level (High, Medium, or Low) and category (General or OWASP).
The PVS-Studio plugins for IntelliJ IDEA, CLion, Rider, and Visual Studio also feature a special Best Warnings button that displays ten of the most interesting warnings detected by the analyzer:
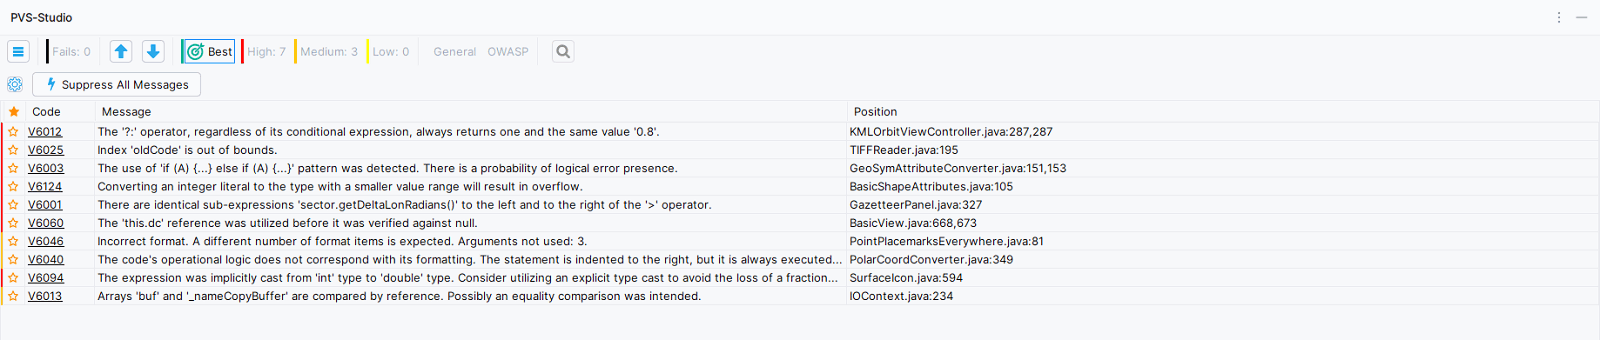
This feature is useful for quickly evaluating our tool's capabilities for your project.
Note. You can try PVS-Studio static analyzer on your project using a free trial key, which you can get here.
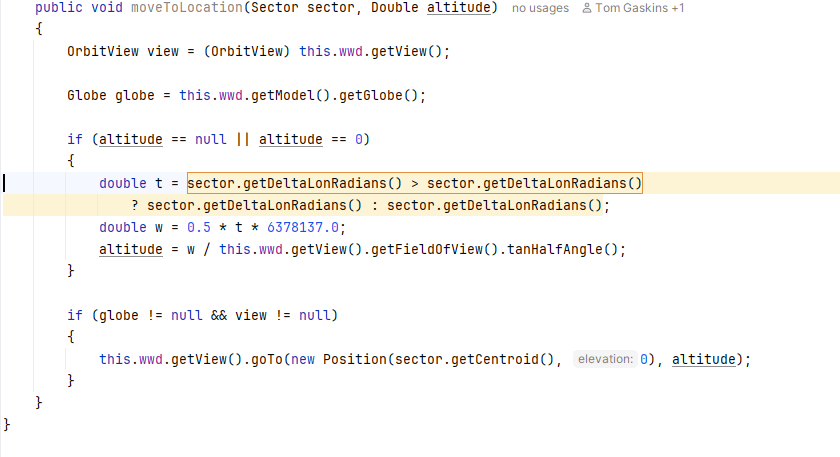
Double-clicking on a warning takes us to the code fragment that triggered it. The warning trace will then be highlighted in the code.
Using IDE plugins is convenient because we don't need to pass flags to the analyzer start command each time, which makes storing settings easier.
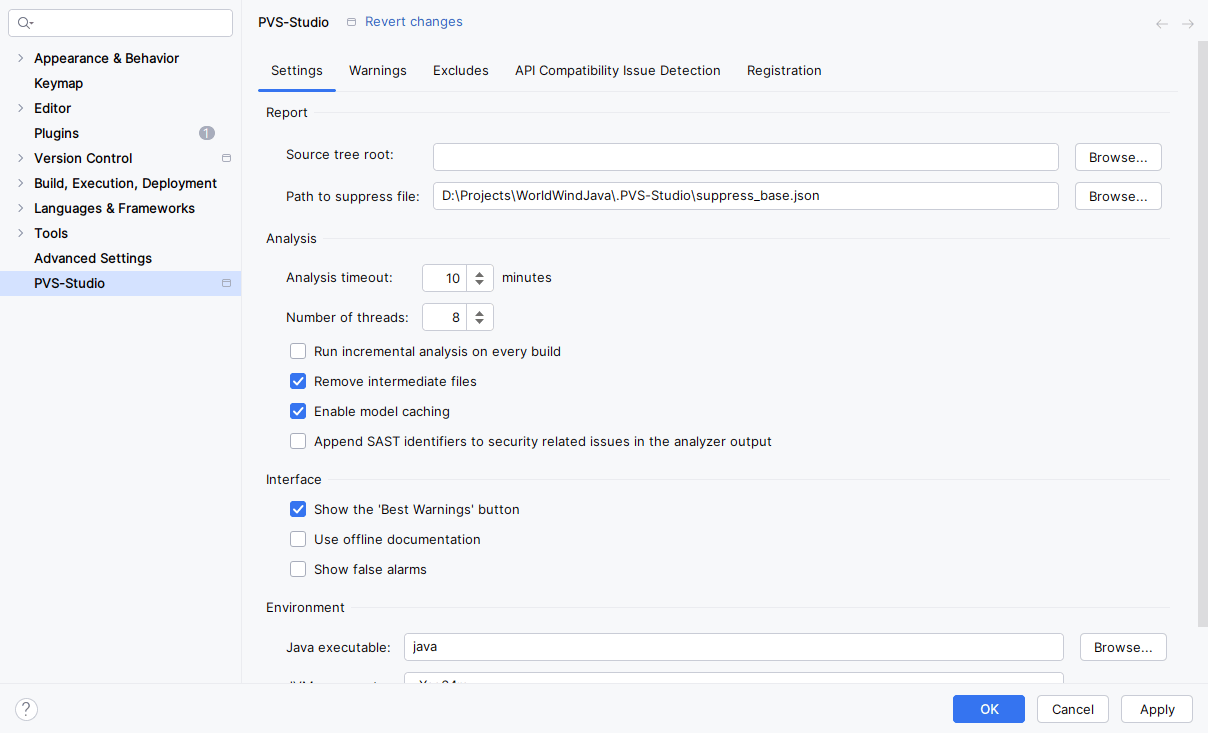
Note. Follow the link for more information about the PVS-Studio plugin settings for IntelliJ IDEA.
In addition to the plugin for IntelliJ IDEA, there are also PVS-Studio plugins for other development environments: Visual Studio, CLion and Rider, Visual Studio Code, and Qt Creator.
After performing the analysis, we receive the analyzer report that can appear in a variety of formats. For example, PVS-Studio can generate it in .plog, .log, or .json formats, depending on the analyzer and platform used.
Programmers may sometimes want to convert the analyzer report to a different format. This can be useful for uploading a report to a web interface (bear with us, we'll talk about this later), because the required format may vary depending on the tool you are using.
At PVS-Studio, we developed a separate component of our analyzer called the Plog Converter utility to solve such tasks.
Let's say we want to convert a report from json to the SARIF static analyzer report format. This utility can help us accomplish this.
The command for Windows:
PlogConverter.exe -t sarif -o ./report.sarif report.jsonThe command for Linux:
plog-converter -t sarif -o ./ -n report -a ALL report.jsonIn this command, we used the -t flag to set the format we want to convert the report to, and we used the -o flag to specify where the analyzer report will be saved. For Linux, we used the -a flag to specify that all warnings in the original report should be retained. We also added the report name using the -n flag (in the Windows implementation, the file name can be written directly in the path to the converted report).
By the way, this utility can do more than convert reports from one format to another, it can also filter them as needed. As we saw in the example above, the -a flag enables you to include only specific diagnostic rule categories and levels in the report.
For example, to keep only the warnings from the General Analysis group with reliability levels 1 and 2, we would write -a "GA:1,2" in the command.
Note. The section of our documentation dedicated to Plog Converter explains how it works.
It's important to promptly react to the warnings issued by the analyzer after receiving the report. It's also important to know who will be responsible for fixing bugs detected by the analyzer. The Blame Notifier utility can help PVS-Studio users here.
It automatically links analyzer warnings to the developers whose code changes triggered them, using blame data from the version control system. Based on this, personalized HTML reports are generated and sent directly to those who made changes in the problematic code areas. This eliminates uncertainty, speeds up the response time, and encourages a sense of personal responsibility for quality.
The utility extracts the name of the code change author, the date, and the revision number. This allows to determine exactly when and in which commit the potentially problematic fragment appeared. The information enables developers to filter warnings by code modification time and generate reports that include only the warnings related to recently edited sections.
This approach helps teams concentrate on maintaining the quality of new or modified code without getting sidetracked by outdated comments.
Note. You can read more about how the Blame Notifier utility works in our documentation.
After receiving the analyzer report, it's important to react promptly and to have an easy way to view and handle it collaboratively. Although integrating the analyzer into the IDE enables you to view warnings in real time, this approach isn't well-suited for teamwork—it's geared toward individual developers.
Attempting to use a VCS to synchronize reports—for example, via a shared file—quickly leads to issues. The report format isn't designed for merging changes, and attempts to synchronize in Git or another VCS lead to conflicts and loss of the current state.
Switching to specialized tools for managing static analysis results is the solution to this problem. For example, PVS-Studio reports can be integrated into platforms such as SonarQube, DefectDojo, CodeChecker, and others. They provide a web interface that makes it convenient to view, filter, and analyze warnings. This makes the report handling process transparent and accessible to the entire team.
The centralized database stores all warnings in one place, which eliminates conflicts when collaborating. These systems enable you to view and distribute warnings, assign responsible developers, add comments, explain reasons for suppressing false positives, and track the status of each warning.
Also, many of these platforms let you analyze how code quality changes over time. This turns static analysis from a one-time activity into an integral part of a continuous product enhancement process.
We recently published a guide on how to use CodeChecker and integrate PVS-Studio analyzer reports into it. You can read it on our blog.
Now that we know about the warnings, it's time to fix them, right?
To do this, let's return to the IDE and review the report step by step, addressing the warnings issued by the analyzer as we go. There may be an issue where false positives that we marked in the web interface are still displayed in the report. We need to eliminate them.
To do this, we can use the suppression mechanisms implemented in the PVS-Studio analyzer and the IDE plugins. We recently published a separate article about these mechanisms on our blog. You can read it here.
In this article, we expanded on the topic of using a static analyzer and delved into the question of what to do next. What to do when we have already received the report?
These tips will improve your experience with the tool and make it more efficient.
If you aren't already using a static analyzer for your project, you can try PVS-Studio with a free trial license via this link.
0
0
0

0