
Our website uses cookies to enhance your browsing experience.

Are you a Java developer and prefer to work in VS Code? Good news! Now you can enhance code safety with the PVS-Studio extension, which helps detect errors in Java projects and much more.

The PVS-Studio analyzer is a tool for automatic detection of potential errors and vulnerabilities in C, C++, C#, and Java code. It consists of two elements:
PVS-Studio for VS Code is one of such plugins. It has recently received a major update, and now you can use the extension to run the analysis for Java projects.
So, I'd like to show you how to work with the plugin, as I did in one of my previous articles. Now we're aiming to find errors in the Java project, not in the C# one. Let's get cracking!
First, install the Java analyzer core and the extension for VS. You can find a small installation guide in one of my previous articles.
To analyze Java projects with the PVS-Studio extension, you need to have the standard Java extensions installed in VS Code: Language Support for Java(TM) by Red Hat and Project Manager for Java.
Note: to autodetect the core, install the extension in the default directory for your OS. You can also install the core in an arbitrary directory and specify the path to it in the VS Code settings (File -> Preferences -> Settings -> PVS-Studio: Java Projects Analyzer Path).
The analyzer requires JDK versions 11-19 to work. If you use another one, download the necessary JDK and specify the path to its executable file in the corresponding setting (File -> Preferences -> Settings -> PVS-Studio: Java For Running Analyzer).
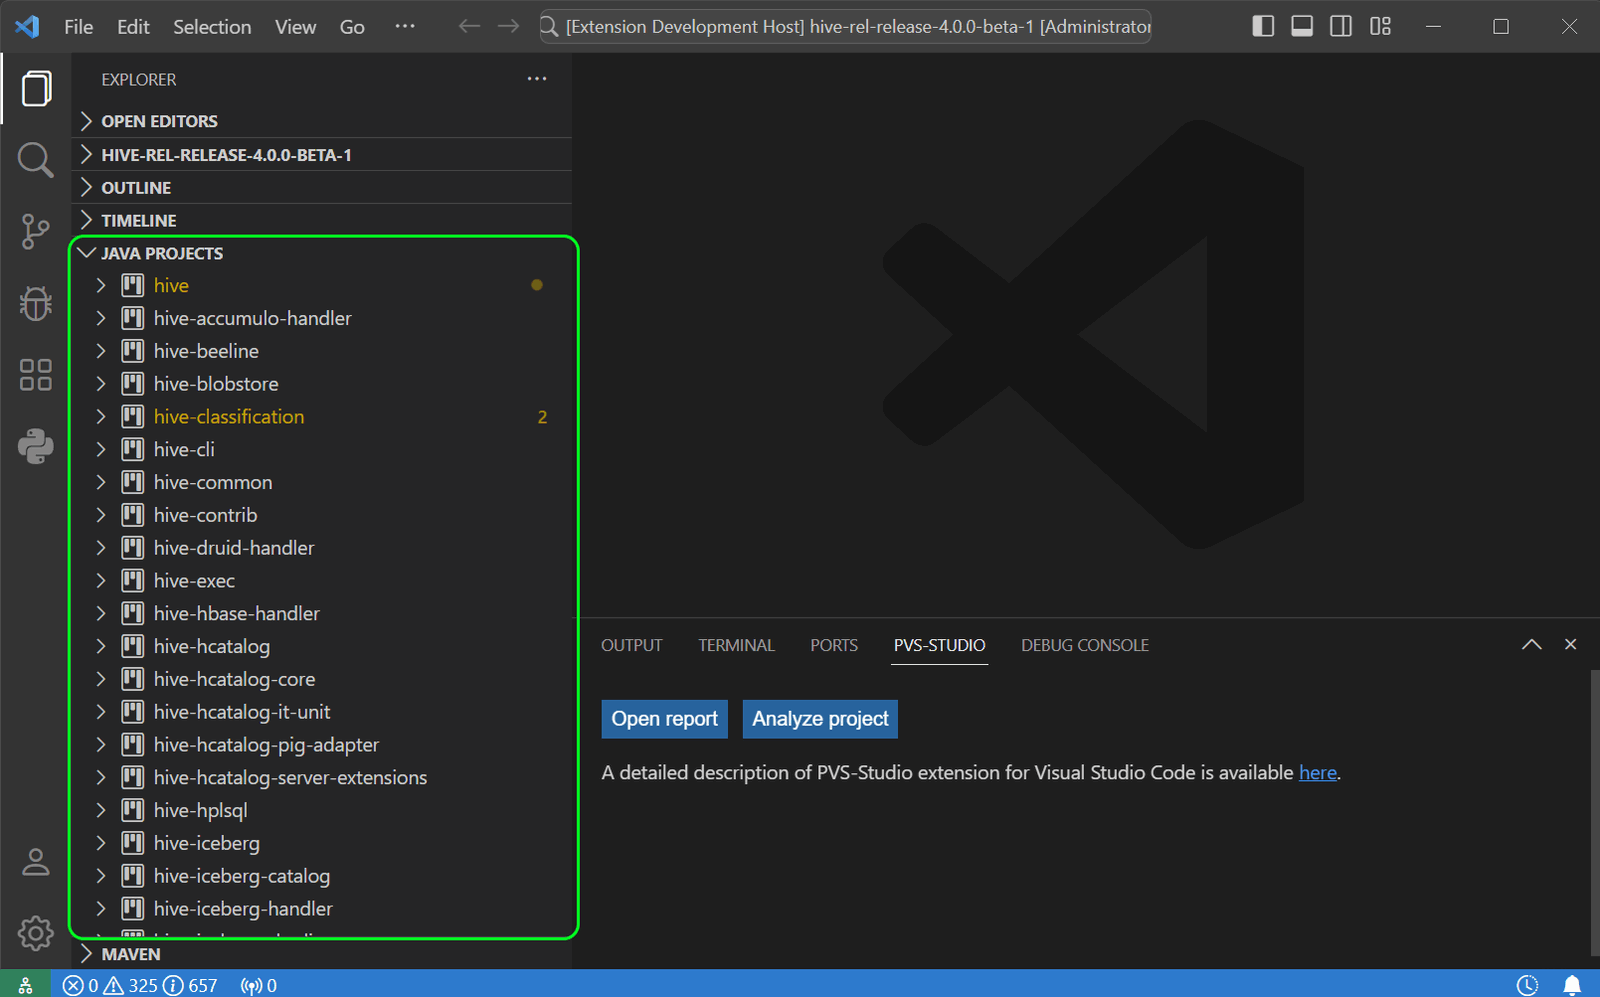
Open the project and wait until its structure loads in the Java projects view:
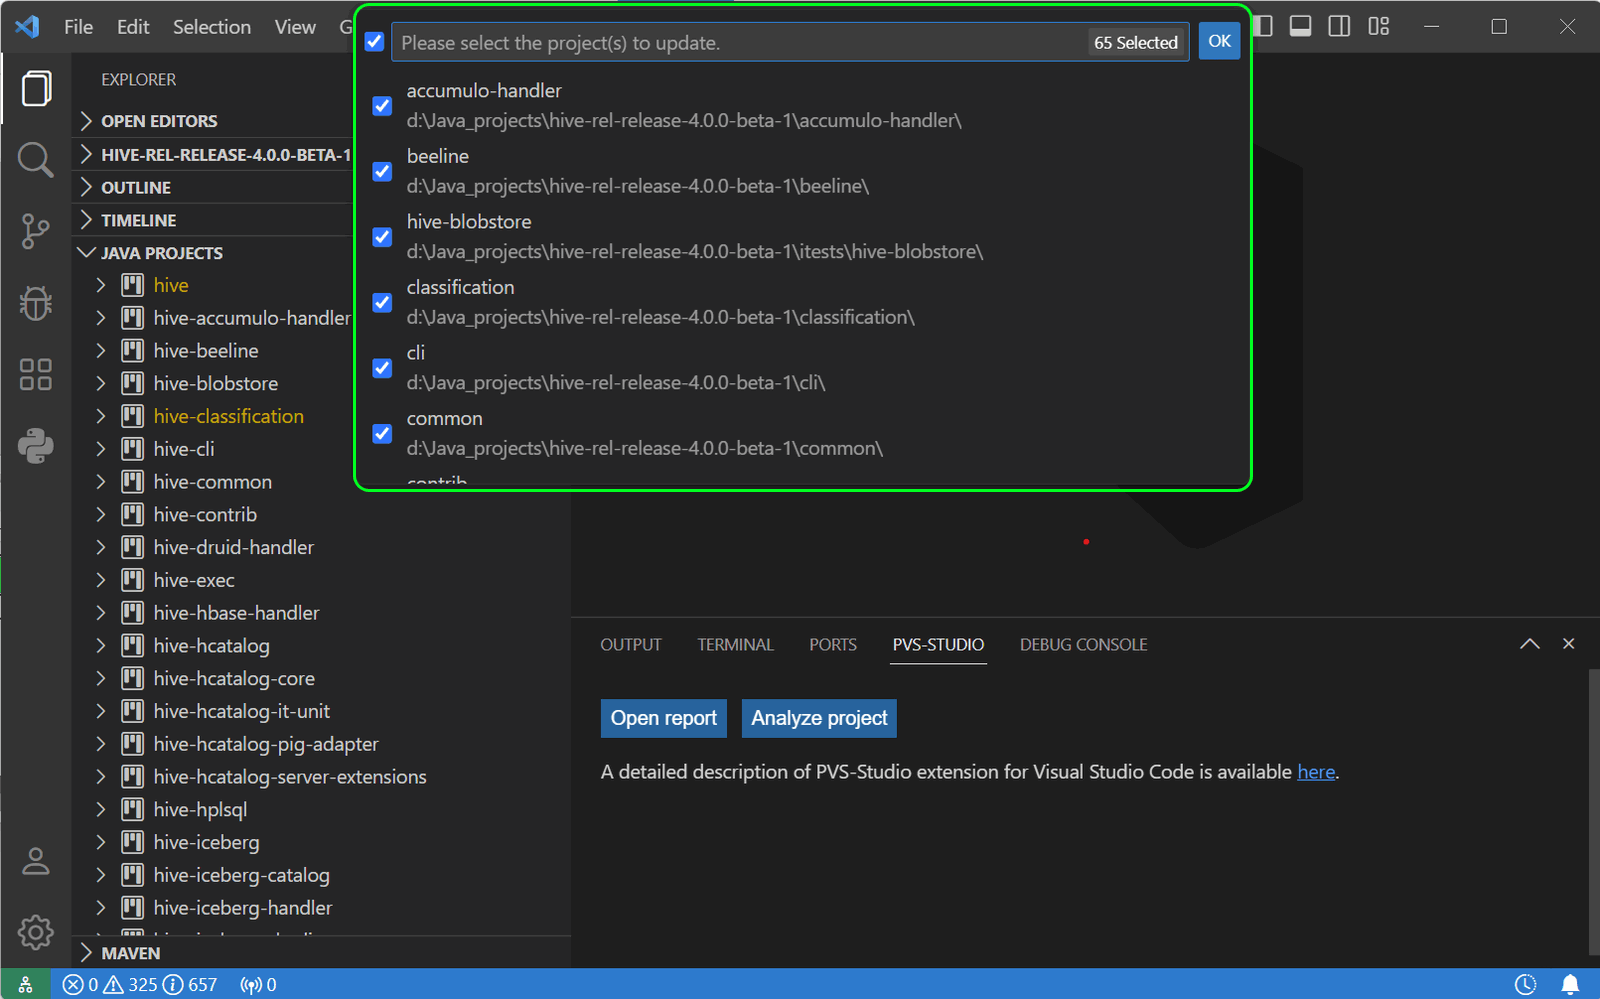
If your project includes projects or folders located outside the open directory, run the "Java: Reload Projects" command. After that, a list of all included projects will be displayed — mark the projects to be analyzed.
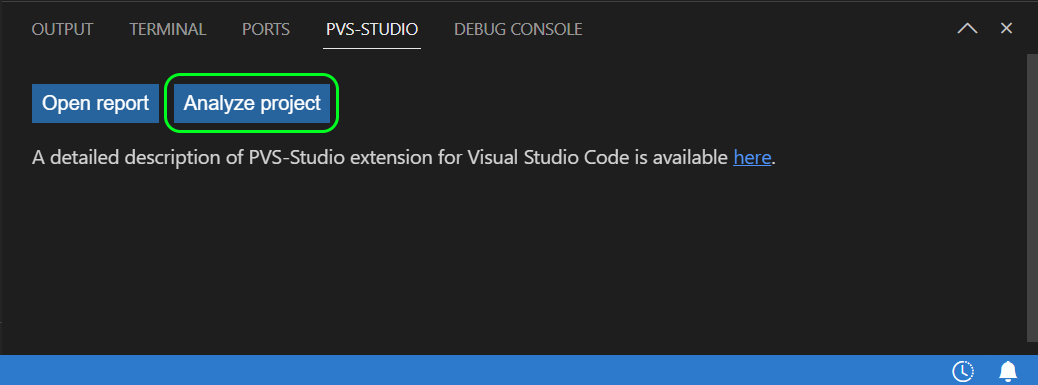
Now you can easily run the analysis. There are different ways to do it. It depends on whether you want to analyze: the entire project, its individual files, or folders. To run the full analysis, click the corresponding button in the PVS-Studio tab of the VS Code bottom panel.
During the first analysis, you'll be prompted to create a file where you can specify some optional analysis parameters, similar to those in the console version of the analyzer.
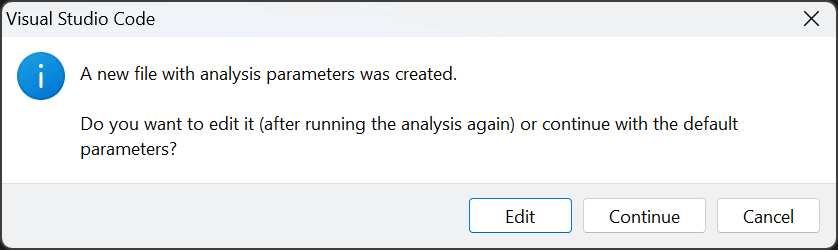
Click the Edit button to open the file in the editor without running the analysis. Click Continue to run it with the default parameters.
Don't worry if the analysis progress freezes at 0 for some time. It usually occurs for the following reasons:
Soon after running, you'll see the first warnings that will be gradually displayed in the table.
After the analysis is complete, you can move on to the most challenging, yet interesting part: examining the received warnings to find errors.
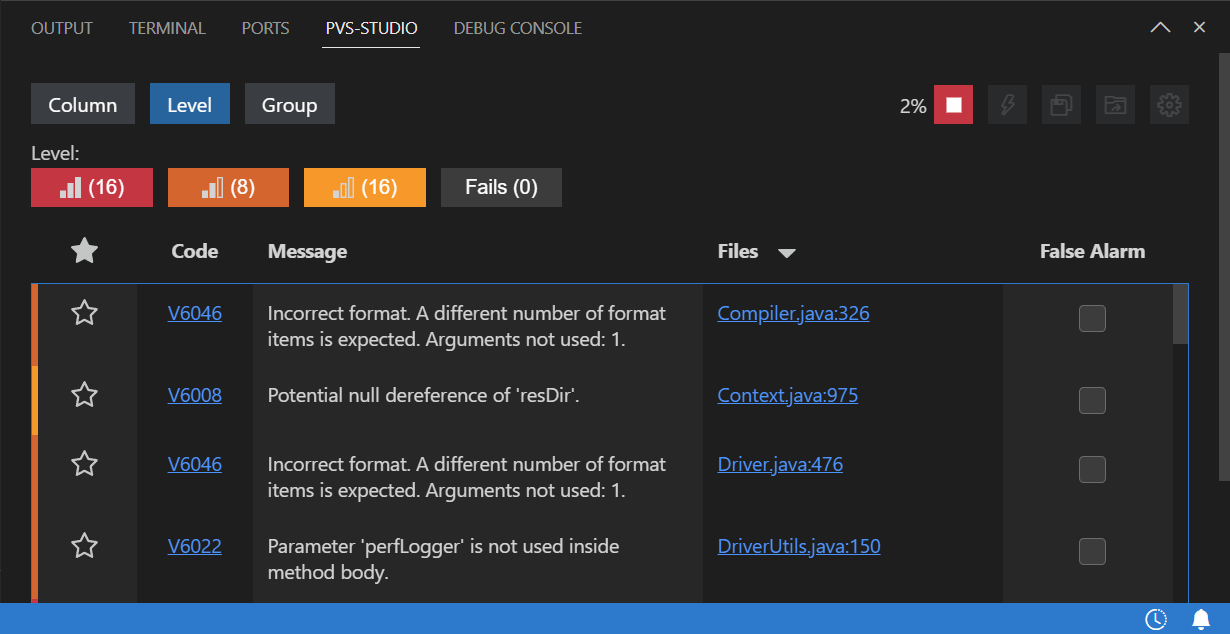
Don't be afraid if you receive many warnings. Not all of them conceal a real error. All warnings are categorized into 3 levels: they show how true errors will turn out to be:
When reviewing warnings, use the available features, such as filtering and column sorting — they're very helpful.
For example, sorting by the Code column will group similar warnings together. Checking similar warnings in a row is easier than checking them in random order.
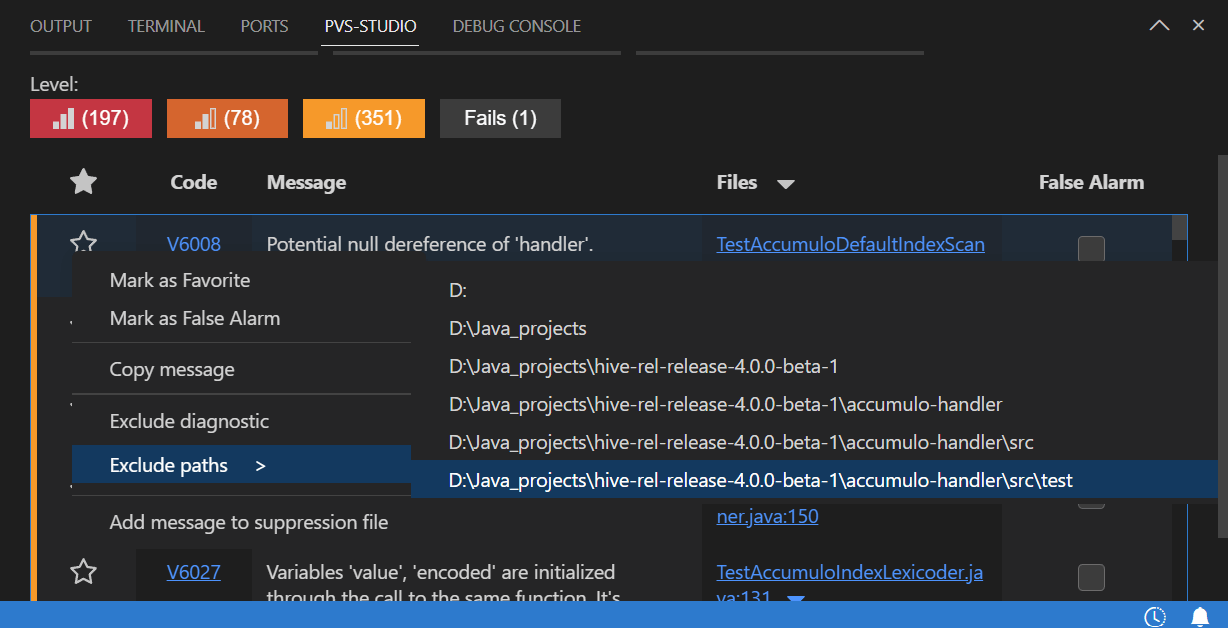
You can also exclude some warnings. For example, warnings in the test files. To do this, select the corresponding option in the context menu of the warning:
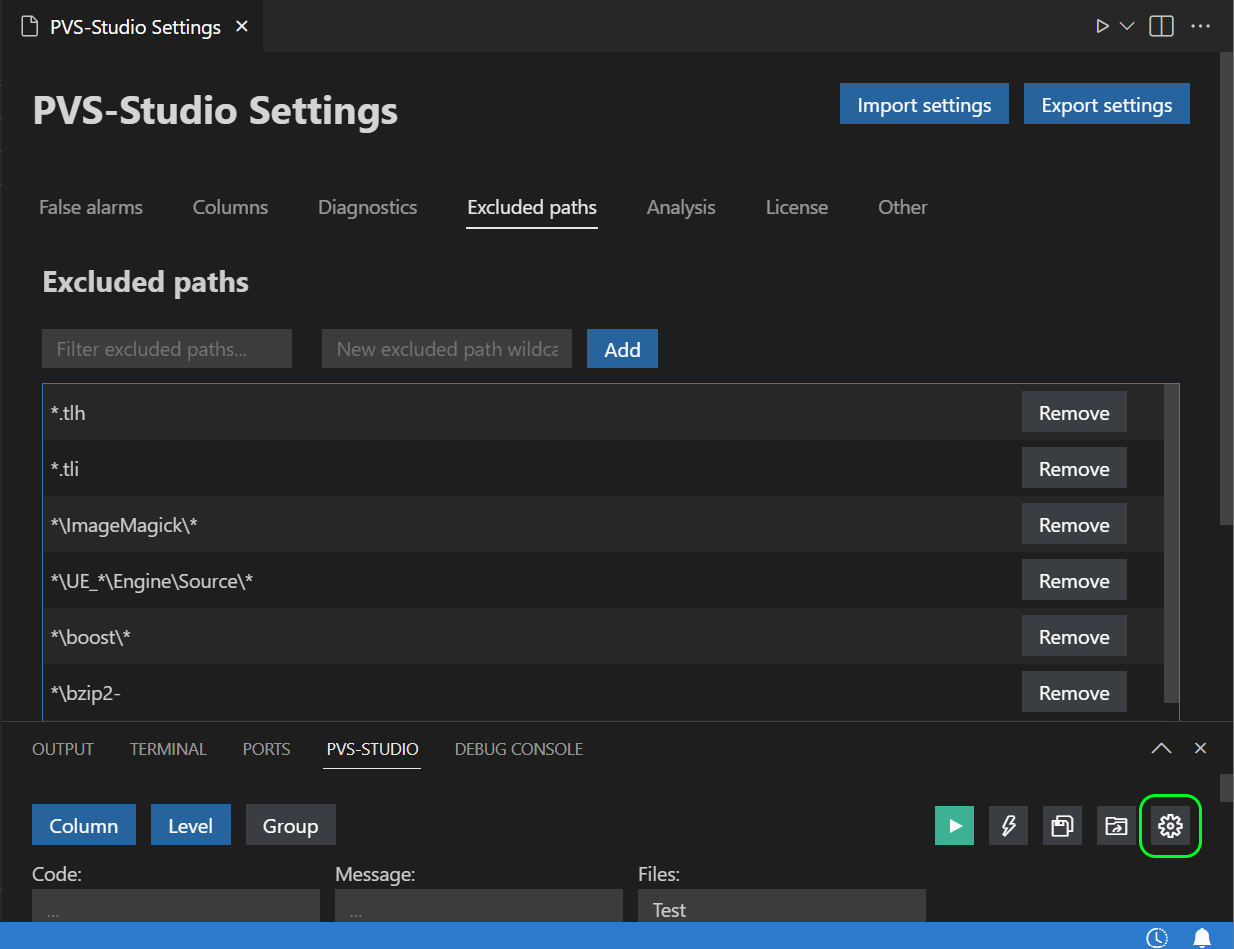
Or specify the path in the corresponding settings tab (the gear icon):
After analyzing the Apache Hive project and checking some of the warnings in the report, I've found a few potential bugs.
public void logSargResult(int stripeIx, boolean[] rgsToRead)
{
  ....
  for (int i = 0, valOffset = 0; i < elements; ++i, valOffset += 64) {
    long val = 0;
    for (int j = 0; j < 64; ++j) {
      int ix = valOffset + j;
      if (rgsToRead.length == ix) break;
      if (!rgsToRead[ix]) continue;
      val = val | (1 << j);                // <=
    }
    ....
  }
  ....
}Warning: V6034 Shift by the value of 'j' could be inconsistent with the size of type: 'j' = [0 .. 63]. IoTrace.java: 264.
Pay attention to the 1 << j expression. Its result is used to evaluate the new value of the val variable. This expression performs a bitwise shift of 1 j bits to the left. As we can see from the loop definition, j can have values in the range of 0 to 64. However, the default numeric literal is of the int type, which is limited to 32 bits.
If the value is shifted by 32 bits or more, the shift looping occurs instead of extending the limit to 64 bits. Thus, the 32-bit shift produces 1 again, the 33-bit shift produces 2, and so on.
public static Operator<? extends OperatorDesc> findSourceRS(....)
{
  ....
  List<Operator<? extends OperatorDesc>> parents = ....;
  if (parents == null | parents.isEmpty()) {
    // reached end e.g. TS operator
    return null;
  }
  ....
}Warning: V6030 The method located to the right of the '|' operator will be called regardless of the value of the left operand. Perhaps, it is better to use '||'. OperatorUtils.java:555.
Here, a NullPointerException will be thrown in the parents.isEmpty() expression. The point is that the conditional expression uses the bitwise OR operator instead of the logical one. As a result, the parents.isEmpty() expression is executed regardless of whether parents is null or not.
Issue 1
private void generateDateTimeArithmeticIntervalYearMonth(String[] tdesc)
throws Exception
{
  ....
  String colOrScalar1 = tdesc[4];
  ....
  String colOrScalar2 = tdesc[6];
  ....
  if (colOrScalar1.equals("Col") &&
      colOrScalar1.equals("Column"))    // <=
  {
    ....
  } else if (colOrScalar1.equals("Col") &&
 colOrScalar1.equals("Scalar")) // <=
  {
    ....
  } else if (colOrScalar1.equals("Scalar") &&
             colOrScalar1.equals("Column"))  // <=
  {
    ....
  }
}Warning:
Here, each logical expression has the colOrScalar1 variable, which is compared twice to different values via the logical && operator. As a result, none of the conditions will ever be true.
Issue 2
@Override
public List<LlapServiceInstance> getAllInstancesOrdered(....) {
  ....
  Collections.sort(list, new Comparator<LlapServiceInstance>() {
    @Override
    public int compare(LlapServiceInstance o1, LlapServiceInstance o2) {
      return o2.getWorkerIdentity().compareTo(o2.getWorkerIdentity()); // <=
    }
  });
  ....
}Warning: V6009 Function 'compareTo' receives an odd argument. An object 'o2.getWorkerIdentity()' is used as an argument to its own method. LlapFixedRegistryImpl.java:260.
In this case, the compare method compares the second object to itself instead of comparing two different objects.
Once we have looked at the warnings and fixed the errors, we need to suppress false positives and minor warnings. This way, we won't be distracted during the next analyses.
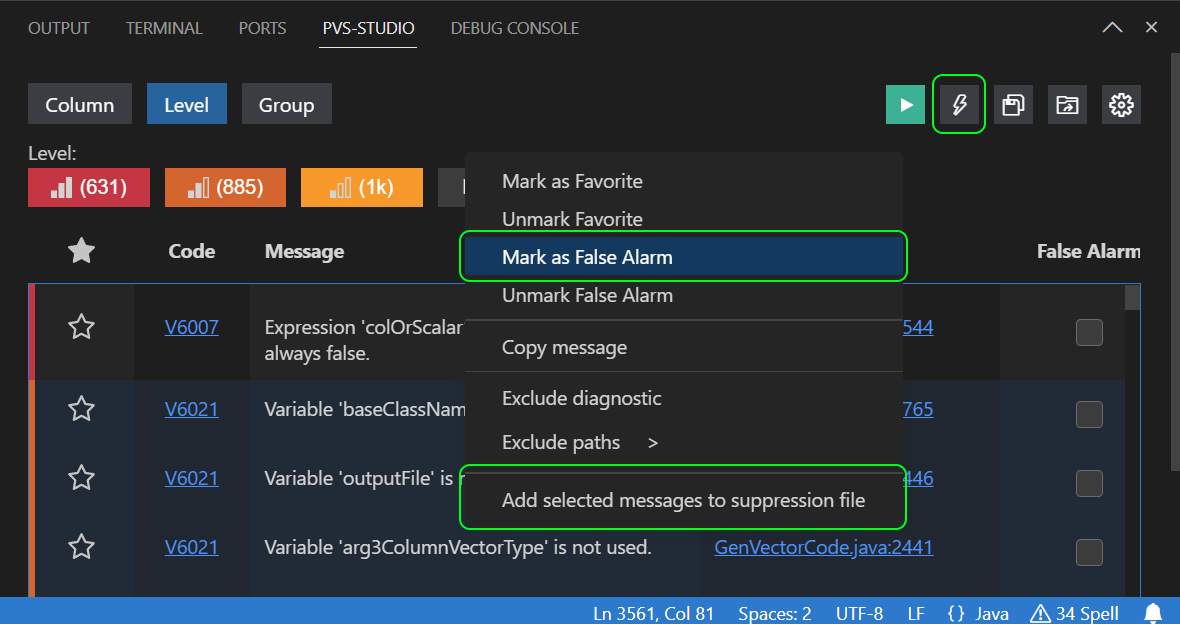
Select warnings in the table (the Ctrl + A key combination selects all of them at once), open the context menu and select Mark as a False Alarm or Add selected messages to suppression file. Note: you can apply the last option to all warnings at once or only to the unfiltered ones using the lightning icon in the upper right corner of the PVS-Studio window.
The first option differs from the second: it suppresses the warning by adding a comment of the //-V[Warning Code] form to the first line of code the warning points out. The second feature saves information about suppressed warnings in a special file.
Using the Mark as a False Alarm option is preferable to suppress unnecessary warnings.
Adding warnings to the suppress file is a convenient option for setting aside technical debt and focusing on the quality of new code.
In this case, the standard scenario for using the feature is as follows:
You can read more about the topic in the article "How to introduce a static code analyzer into a project and not demotivate the team".
If you plan to migrate your project to a newer Java version, it'll be better not to depend on an API that will be removed in the target release. The special V6078 diagnostic rule is at your service. When working with the PVS-Studio extension for VS Code, you can enable the diagnostic rule in the JavaAnalyzerConfig.jsonc file in the .PVS-Studio folder of the working directory as follows:
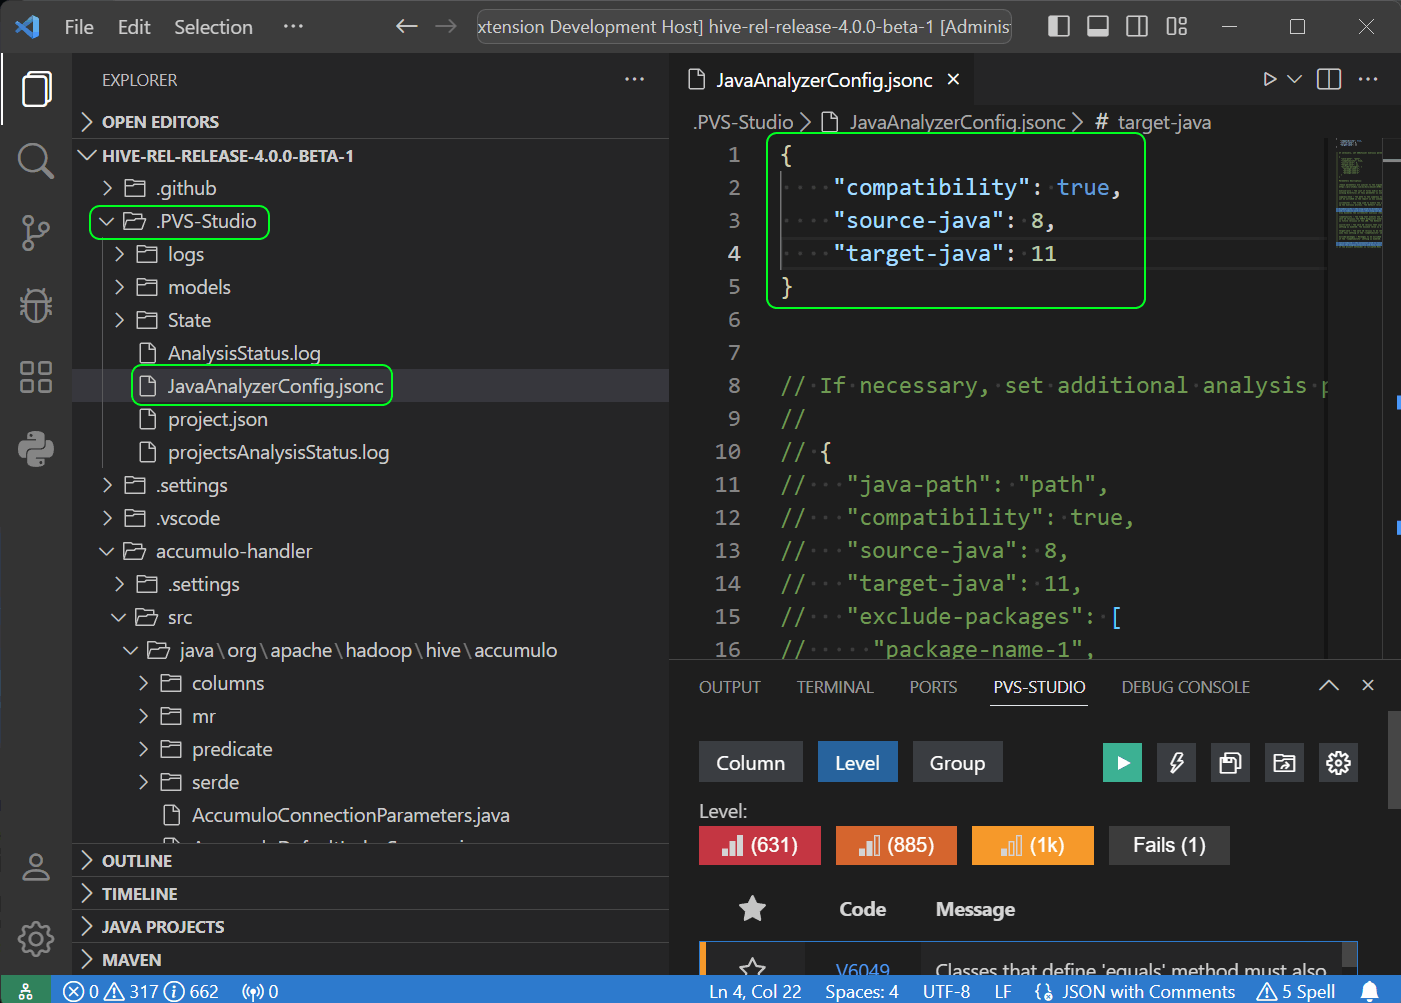
The following arguments are used here:
When we have been analyzing the large Elasticsearch project (more than 18,000 code files), we've discovered that executing the Project Manager for Java extension can lead to a severe RAM overrun. It can cause the VS Code window to crash. If you have any ideas on how to optimize the mentioned extension performance in such cases, please share your tips in the comments.
This is the end of our short review. I hope this article helped you see how useful the PVS-Studio VS Code plugin can be.
Clean code and successful projects to you! See you in the next articles!
0
0
0

0