
Our website uses cookies to enhance your browsing experience.

We can't develop programs without debugging. Modern IDEs have a built-in debugger, but there are cases when using IDE for debugging is superfluous or impossible. So, standalone debuggers come to the rescue. One of such debuggers is x64dbg.

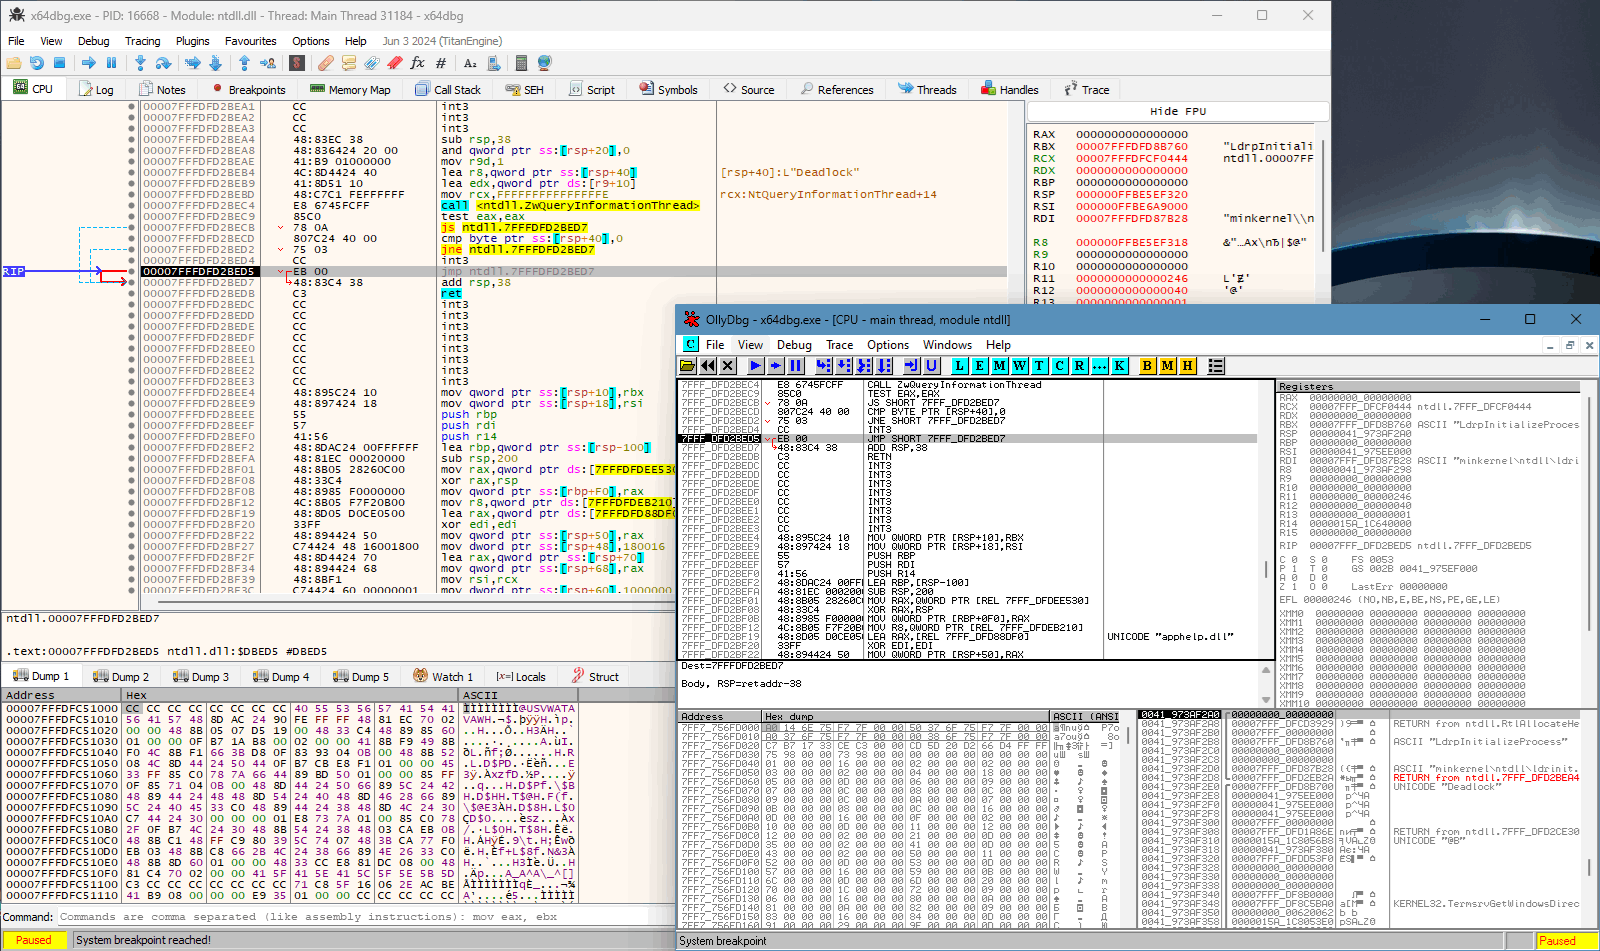
x64dbg is an open-source debugger for 32-bit and 64-bit versions of Windows. It provides an "intuitive and familiar, yet new user interface". It looks similar to OllyDbg but with a little bit better interface and enhanced functionality.
The debugger doesn't have regular releases. Instead, developers release snapshot builds about once a month. The cross-platform version is being developed in parallel.
When a developer needs a standalone debugger? For example, Visual Studio 2022 builds executables with Windows Vista support by default. However, we can't install it on Windows Vista and use remote debugging because Vista is unsupported OS—we need at least Windows 7.
In general, developers use a standalone debugger to analyze executables whose source code and debug symbols are not accessible. Antivirus labs define the malware algorithm to describe it in their knowledge base and then add its definition to AV databases. Various communities for reviving old-school online games or programs don't keep their hands off the debugger that helps resurrect their servers. And not just the old ones—server emulators are released even for recent online games. So, how well made is a "Swiss army knife" for reverse-engineering? So, it's time to run the PVS-Studio analyzer.
You can download PVS-Studio here. To analyze the project, you'll need a license. Here you can get a trial version. The PVS-Studio has a user-friendly installation interface: each step is explained, and if you have any difficulties, the guide for a quick start on Windows is always at your service. We need two additional IDE integrations: for Qt Creator (the installer will extract it in the PVS-Studio folder) and for Visual Studio. The current version of the analyzer at the moment of writing the article is 7.31.
The debugger consists of two components: the core and the GUI. The first component is built in Visual Studio, and the second is in Qt Creator. The project's wiki has a guide on how to compile a project, and the author strongly recommends using certain versions of dependencies. In this part of the article, we'll analyze the debugger core. The code matches the f518e50 commit in the development branch.
Let's open the x64dbg.sln solution file and exclude third-party libraries from the check. This would help us not to drown in the noise of the x64dbg-unreleated code warnings. These libraries are listed in the Third Party filter of the x64dbg_dbg project in the header file section:
\dbghelp\
\DeviceNameResolver\
\jansson\
\LLVMDemangle\
\lz4\
\msdia\
\ntdll\
\TitanEngine\
\WinInet-Downloader\
\XEDParse\
Now, let's exclude the folders from the analysis in the Visual Studio plugin settings: Extensions > PVS-Studio > Options > Don't Check Files. Alternative ways to manage the list of excluded paths are described in our documentation.
Shake your insecticide spray and let's get rid of the debugger bugs! No debugger, as promised.
V570 The 'mLastChar' variable is assigned to itself. lexer.cpp 149
class Lexer
{
....
private:
  ....
  int mLastChar = ' ';
  ....
....
}

Lexer::Token Lexer::getToken()
{
  ....
  //character literal
  if(mLastChar == '\'')
  {
    std::string charLit;
    while(true)
    {
      ....
      if(mLastChar == '\\') //escape sequence
      {
        nextChar();
        if(mLastChar == EOF)
          return reportError("unexpected end of file in character literal (2)");
        if(mLastChar == '\r' || mLastChar == '\n')
          return reportError("unexpected newline in character literal (2)");
        if(   mLastChar == '\'' || mLastChar == '\"'
           || mLastChar == '?' || mLastChar == '\\')
          mLastChar = mLastChar;                                   // <=
        else if(mLastChar == 'a')
          mLastChar = '\a';
        ....
      }
      ....
    }
    ....
  }
}
This function escapes certain characters: newlines, backslashes, quotation marks, and other control characters. The mLastChar variable is a member of the Lexer class and contains the last read literal. The nextChar function reads the next character and writes it to mLastChar. If the mLastChar value updates it via calling, why should we reassign the same value? Here's a similar warning:
V547 Expression '!expr' is always true. parser.cpp 118
uptr<Expr> Parser::ParseExpr()
{
  return nullptr;
}

uptr<Return> Parser::ParseReturn()
{
  if(CurToken.Token == Lexer::tok_return)
  {
    NextToken();
    auto expr = ParseExpr();
    if(!expr)                              // <=
    {
      ReportError("failed to parse Return (ParseExpr failed)");
      return nullptr;
    }
    return make_uptr<Return>(move(expr));
  }
  return nullptr;
}
What is the chance that something can come from nothing? Is the medieval superstition that mice grow out from sweaty shirts true? Science has proven that it is not. Obtaining other data from nullptr is also unfeasible.
I'll also give here the definition of the uptr class, which is actually the common std::unique_ptr:
template<class T>
using uptr = unique_ptr<T>;V560 A part of conditional expression is always false: !haveCurrValue. watch.cpp 61
....
currValue = val;
haveCurrValue = true;
if(getType() != WATCHVARTYPE::TYPE_INVALID)
{
  switch(getWatchdogMode())
  {
  ....
  case WATCHDOGMODE::MODE_CHANGED:
    if(currValue != origVal || !haveCurrValue)         // <=
    {
      duint cip = GetContextDataEx(hActiveThread, UE_CIP);
      dprintf(....);
      watchdogTriggered = 1;
    }
    break;
  case WATCHDOGMODE::MODE_UNCHANGED:
    if(currValue == origVal || !haveCurrValue)         // <=
    {
      duint cip = GetContextDataEx(hActiveThread, UE_CIP);
      dprintf(....);
      watchdogTriggered = 1;
    }
    break;
  }
}
return val;
....
At least we have a case of copy-paste-oriented programming, at most, we have a case when the haveCurrValue variable is never modified before the end of the switch statement.
Here's a similar warning:
V783 Dereferencing of the invalid iterator might take place. LinearPass.cpp 130
void LinearPass::AnalyseOverlaps()
{
  ....
  // Erase blocks marked for deletion
  m_MainBlocks.erase(std::remove_if(
    m_MainBlocks.begin(), m_MainBlocks.end(), [](BasicBlock & Elem)
    {
      return Elem.GetFlag(BASIC_BLOCK_FLAG_DELETE);
    }));
  ....
}
Developers often use the erase-remove idiom to eliminate data from an array. Its essence is as follows: the std::remove function selects the array elements and moves them to the end. Then the function will return the iterator from which the std::erase function will start removing the moved elements. The code author has thought that this call will delete all elements with the erase flag—that's what the comment above the m_MainBlocks.erase call hints at.
This code has two issues:
Let's try to fix both issues at once: we'll use the second std::erase function overload, which accepts iterators to the beginning and the end of the sub-array to delete.
m_MainBlocks.erase(std::remove_if(
  m_MainBlocks.begin(), m_MainBlocks.end(), [](BasicBlock & Elem)
  {
      return Elem.GetFlag(BASIC_BLOCK_FLAG_DELETE);
  }), m_MainBlocks.end());
Thus, we've fixed the erasing of only one element, and at the same time, we protected against an erasing an empty list. The documentation clearly states that nothing will be executed in this case.
V560 A part of conditional expression is always true: addr < _base + _size. cmd-undocumented.cpp 382
bool cbInstrVisualize(int argc, char* argv[])
{
  if(IsArgumentsLessThan(argc, 3))
    return false;
  duint start;
  duint maxaddr;
  ....
  {
    ....
    //initialize
    Zydis zydis;
    duint _base = start;
    duint _size = maxaddr - start;
    Memory<unsigned char*> _data(_size);
    MemRead(_base, _data(), _size);
    for(duint addr = start, fardest = 0; addr < maxaddr;)
    {
      ....
      //continue algorithm
      const unsigned char* curData =
        (addr >= _base && addr < _base + _size)         // <=
          ? _data() + (addr - _base)
          : nullptr;
      if(zydis.Disassemble(addr, curData, MAX_DISASM_BUFFER))
      {
        if(addr + zydis.Size() > maxaddr)
          break; //we went past the maximum allowed address
        ....
      }
      ....
    }
    ....
  }
  ....
}
The _base variable is assigned the start variable value. This means that the check for the maximum allowed address has already been in the loop condition (addr < maxaddr) and doesn't make sense in the ternary operator when we initialize the curData variable. It's clear that nothing is clear. Now watch this:
To get maxaddr, let's add _size up to start. Using some simple math, we get the following expression:
maxaddr = start + _sizeThus, we understand that the addr < maxaddr loop condition is identical to the addr < _base + _size condition inside the loop. It turns out to be the same thing but in a more "complete" form.
V1053 Calling the 'AddRef' virtual function in the constructor may lead to unexpected result at runtime. pdbdiafile.cpp 23
//Taken from: https://msdn.microsoft.com/en-us/library/ms752876(v=vs.85).aspx
class FileStream : public IStream
{
  FileStream(HANDLE hFile)
  {
    AddRef();                         // <=
    _hFile = hFile;
  }

....
public:
  virtual ULONG STDMETHODCALLTYPE AddRef(void)
  {
    return (ULONG)InterlockedIncrement(&_refcount);
  }
....
}
I see the phrase "Taken from", look at the sample code from Microsoft Learn, and notice that a developer just uses the _refcount variable instead of calling the AddRef function:
class FileStream : public IStream
{
  FileStream(HANDLE hFile)
  {
    _refcount = 1;
    _hFile = hFile;
  }
....
}
What can the virtual function call in constructors or destructors lead to? It's fraught with that there may be errors in their invocation in inherited classes. Yes, it is "copied right", but developers could call the InterlockedIncrement function with the reference to _refcount right away? It's even part of the system API!
V547 Expression '!bRedirectSupported' is always true. x64dbg_launcher.cpp 76
static BOOL isWowRedirectionSupported()
{
  BOOL bRedirectSupported = FALSE;

  _Wow64DisableRedirection = (LPFN_Wow64DisableWow64FsRedirection)
    GetProcAddress(GetModuleHandle(TEXT("kernel32")),
                   "Wow64DisableWow64FsRedirection");
  _Wow64RevertRedirection = (LPFN_Wow64RevertWow64FsRedirection)
    GetProcAddress(GetModuleHandle(TEXT("kernel32")),
                   "Wow64RevertWow64FsRedirection");

  if(!_Wow64DisableRedirection || !_Wow64RevertRedirection)
    return bRedirectSupported;
  else
    return !bRedirectSupported;     // <=
}
At first glance, the warning seems completely illogical. I looked at these lines for a long time, even had to take eye drops. I've already seen the abuse of memory in strings, but that... That's a victim of a dentist with a slightly unconventional approach to pulling out a bad tooth. Well, let's leave frightening metaphors aside, we have a great reason to refactor here! The static analyzer will serve us well here.
The GetProcAddress function returns the address of the exported function via its name, via its ordinal value from the module, or NULL if the requested function hasn't been located. You don't need another variable here at all to return the result of checking file system redirection support for the WoW64 subsystem. If we miss one of the functions, the default FALSE is returned. Therefore, the entire function can be reduced to literally three operations:
static BOOL isWowRedirectionSupported()
{
  _Wow64DisableRedirection = (LPFN_Wow64DisableWow64FsRedirection)
    GetProcAddress(GetModuleHandle(TEXT("kernel32")),
                  "Wow64DisableWow64FsRedirection");
  _Wow64RevertRedirection = (LPFN_Wow64RevertWow64FsRedirection)
    GetProcAddress(GetModuleHandle(TEXT("kernel32")),
                  "Wow64RevertWow64FsRedirection");

  return !_Wow64DisableRedirection || !_Wow64RevertRedirection;
}
However, my eyes go up to the Microsoft Learn documentation, to the description of the Wow64RevertWow64FsRedirection function:
This function should not be called without a previous call to the Wow64DisableWow64FsRedirection function.
Any data allocation on behalf of the Wow64DisableWow64FsRedirection function is cleaned up by this function.
One function can't exist without the other, so checking for redirection support is fundamentally wrong! Let's refine the refinement and fix the return value:
return _Wow64DisableRedirection && _Wow64RevertRedirection;Now everything is correct; if at least one function is missing, redirection isn't supported.
V1003 The macro 'TITANGETDRX' is a dangerous expression. The parameter 'titantype' must be surrounded by parentheses. breakpoint.h 8
#define TITANGETDRX(titantype) UE_DR0 + ((titantype >> 8) & 0xF)Through the code, I didn't find any case where the titantype parameter was represented as any expression—only options with a single variable pass. However, if someone stumbled and forgot to do exactly that and passed something like a mathematical expression to a macro, the debugger might have suddenly been visited by Dr. Watson or WER.
We can fix it quickly: the parameter is simply wrapped in a single pair of parentheses.
#define TITANGETDRX(titantype) UE_DR0 + (((titantype) >> 8) & 0xF)Here are similar warnings:
V560 A part of conditional expression is always true: * memorySize <= 512. The value range of unsigned char type: [0, 255]. TraceRecord.cpp 239
//See https://www.felixcloutier.com/x86/FXSAVE.html, max 512 bytes
#define memoryContentSize 512

static void HandleZydisOperand(
                 const Zydis & zydis, int opindex,
                 DISASM_ARGTYPE* argType, duint* value,
                 unsigned char memoryContent[memoryContentSize],
                 unsigned char* memorySize)
{
  ....
  case ZYDIS_OPERAND_TYPE_MEMORY:
  {
    *argType = arg_memory;
    const auto & mem = op.mem;
    if(mem.segment == ArchValue(ZYDIS_REGISTER_FS, ZYDIS_REGISTER_GS))
    {
      *value += ThreadGetLocalBase(ThreadGetId(hActiveThread));
    }
    *memorySize = op.size / 8;
    if(*memorySize <= memoryContentSize && DbgMemIsValidReadPtr(*value))  // <=
    {
      MemRead(*value, memoryContent, max(op.size / 8, sizeof(duint)));
    }
  }
  break;
  ....
}
Here we go again: the code where the debugger developer left a comment with a link to the documentation. The developer attached the FXSAVE instruction of the x86 architecture. The instruction saved the state of the floating-point unit as well as the MMX, XMM, and MXCSR registers to a 512-byte memory block. A colleague doubted the internet docs and deemed it unreliable. The result was a clamorous debate for a few minutes. While we were talking, I remembered that I had seen this table somewhere before...

With a sly grin on my face, I languidly walked over to the bookshelf and slowly pulled out the second volume of "IA-32 Intel Architecture Software Developer's Manual", published in 2002! The book described every supported instruction of the fresh and piping hot Pentium 4 processor. A heavy thick book landed on my desk with an ear-shattering smack, and I opened it to the page where I'd left a bookmark beforehand. In front of my opponent, the same table appeared in all its grandeur as it did in the e-book. That was the end of the debate. I could only suggest deleting the redundant size check. The unsigned char type can't take a value greater than 255—it's too small to reach all the data of the FXSAVE instruction.
....
*memorySize = op.size / 8;
if(DbgMemIsValidReadPtr(*value))
{
  MemRead(*value, memoryContent, max(op.size / 8, sizeof(duint)));
}
....V1048 The 'titsize' variable was assigned the same value. cmd-breakpoint-control.cpp 427
bool cbDebugSetHardwareBreakpoint(int argc, char* argv[])
{
  ....
  DWORD titsize = UE_HARDWARE_SIZE_1;
  if(argc > 3)
  {
    duint size;
    if(!valfromstring(argv[3], &size))
      return false;
    switch(size)
    {
    case 1:
      titsize = UE_HARDWARE_SIZE_1;         // <=
      break;
    case 2:
      titsize = UE_HARDWARE_SIZE_2;
      break;
    case 4:
      titsize = UE_HARDWARE_SIZE_4;
      break;
#ifdef _WIN64
    case 8:
      titsize = UE_HARDWARE_SIZE_8;
      break;
#endif // _WIN64
    default:
      titsize = UE_HARDWARE_SIZE_1;        // <=
      dputs(QT_TRANSLATE_NOOP("DBG", "Invalid size, using 1"));
      break;
    }
    ....
  }
  ....
}
Numeric variables are usually initialized with a null value. It's not forbidden to do it with a specific value. Besides, it's not forbidden to overwrite a variable with the same value during the program execution. But what's the point of it? Is it to make it look convincing, or to back it up?
V1037 Two or more case-branches perform the same actions. Check lines: 42, 45 commandparser.cpp 42
Command::Command(const String & command)
{
  ParseState state = Default;
  int len = (int)command.length();
  for(int i = 0; i < len; i++)
  {
    char ch = command[i];
    switch(state)
    {
    ....
    case Escaped:
      switch(ch)
      {
      case '\t':
      case ' ':
        dataAppend(' ');
        break;
      case ',':
        dataAppend(ch);         // <=
        break;
      case '\"':
        dataAppend(ch);         // <=
        break;
      default:
        dataAppend('\\');
        dataAppend(ch);
        break;
      }
      state = Default;
      break;
    ....
    }
  }
}
This code block has both fallthrough and duplicated parts. The fallthrough is used for tab and space—it means that the code author is obviously sure that both characters will add space without any problems. What's wrong with a comma or a double quote, why couldn't they make fallthrough for that pair of characters as well? The same action is executed: the ch variable value is added, not the other character. If we use fallthrough here, as we do for space and tab, the Earth won't explode:
switch(ch)
{
case '\t':
case ' ':
  dataAppend(' ');
  break;
case ',':
case '\"':
  dataAppend(ch);       // <=
  break;
default:
  dataAppend('\\');
  dataAppend(ch);
  break;
}
It looks like saving on bytes, but actually on the eyes of the code readers and the ticks of their brains to realize what is happening.
V1109 The 'InitCommonControls' function is deprecated. Consider switching to an equivalent newer function. x64dbg_launcher.cpp 426
int APIENTRY WinMain(HINSTANCE hInstance, HINSTANCE hPrevInstance,
                     LPSTR lpCmdLine, int nShowCmd)
{
  InitCommonControls();
  ....
}
This feature is declared as deprecated for a reason. First, it clutters up the import table. Secondly, there are the application manifests, support for which was introduced in Windows XP! First, developers could enable the support for the visual styles in app windows and select specific library versions. When Windows Vista was released, they could set the privilege level of an application. Visual Studio 2013 is used to build the project, where you can even integrate these manifests! This feature isn't so new that you should neglect it—the functionality of the manifest integration directly into the project appeared in Visual Studio 2005. Let's blow the dust off that IDE to see if my memory lets me down.
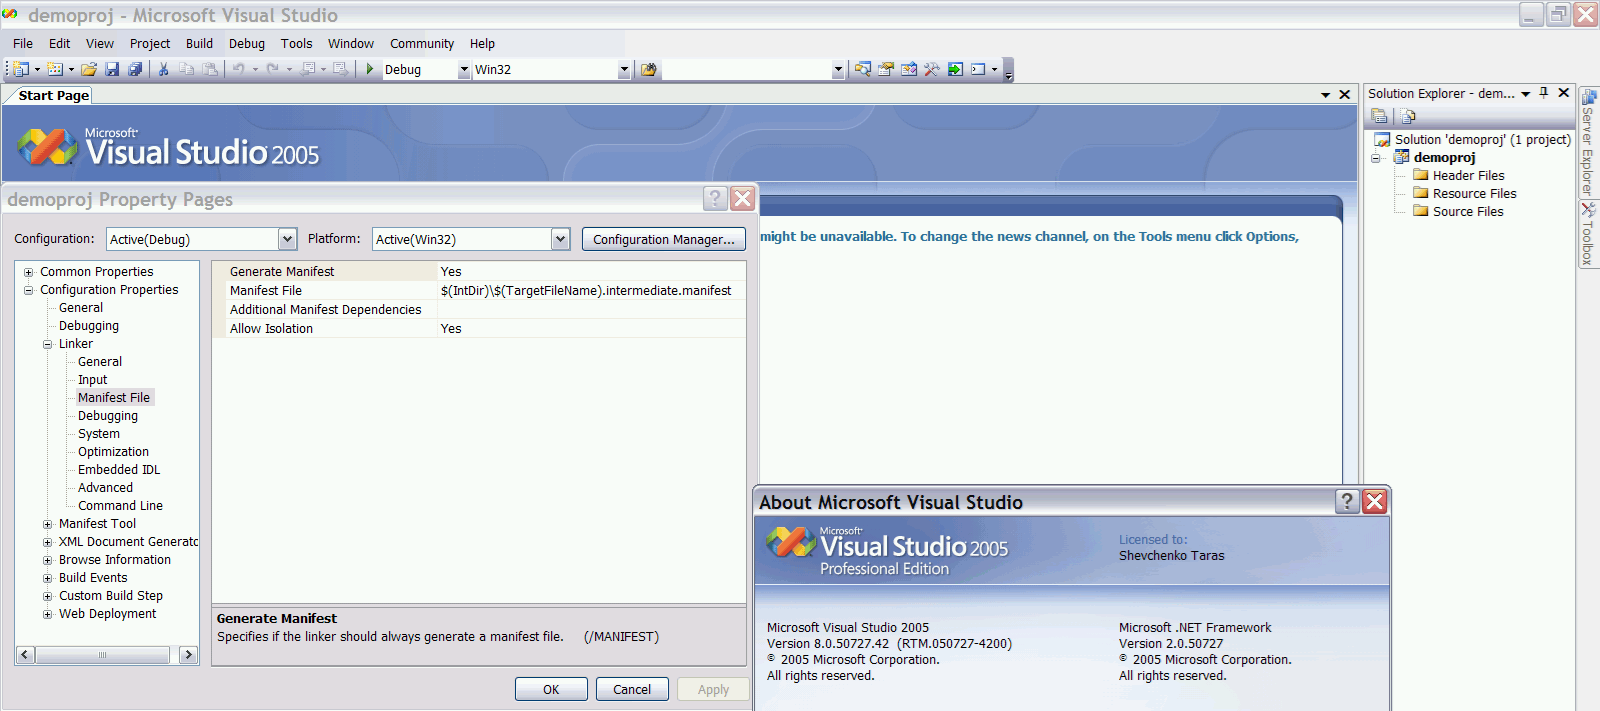
The feature to enable the manifest in the Windows apps or libraries has long been a common development activity that is executed once. Moreover, some functions won't operate correctly without the manifest.
V1109 The 'PathRemoveFileSpecW' function is deprecated. Consider switching to an equivalent newer function. x64dbg_launcher.cpp 114
static HRESULT AddDesktopShortcut(TCHAR* szPathOfFile,
                                  const TCHAR* szNameOfLink)
{
  HRESULT hRes = NULL;

  //Get the working directory
  TCHAR pathFile[MAX_PATH + 1];
  _tcscpy_s(pathFile, szPathOfFile);
  PathRemoveFileSpec(pathFile);
  ....
}
There are still some deprecated calls, such as to PathRemoveFileSpecW via a macro. The function enables us to remove the closing backslash from the path. It would be better to use PathCchRemoveFileSpec instead, but this function is only available on Windows 8 or higher. Since the application is deliberately written to support Windows XP, this warning can be suppressed if you need to work with deprecated functions:
PathRemoveFileSpec(pathFile); //-V1109 //-VH"2078475722"Pay attention to a new mechanism we used, the suppression with hash. It allows us to auto-remove all False Alarm marks if the line code has changed. This also protects you against replacing one deprecated function with another. If we manually rewrite the macro into a function (PathRemoveFileSpecW for Unicode, PathRemoveFileSpecA for ANSI) or replace the macro with another function, the hash won't match the string. Moreover, the analyzer will issue the V1109 warning in this line again if it occurs.
Here are similar warnings:
The legends say that we've got to repair one soldering iron using another. Roughly speaking, here's the same case with debugger. So, how shall we debug a debugger? We can try to search for bugs using the static analyzer. Let's say, PVS-Studio? x64dbg also keeps track of you and of the spent time, so don't forget that time is valuable!

The story doesn't end here: we should "step out" in the Qt GUI—it has lots of surprises in store for us! Stay tuned for part two. Don't switch processor contexts!
0
0
0

0