
Our website uses cookies to enhance your browsing experience.
Webinar: Let's make a programming language. Lexer - 29.04

We're continuing to explore ways of using PVS-Studio for free projects and more. This article covers the main stage of interacting with the tool—working with the report! We'll take a detailed look at the first experience of reviewing analyzer warnings, study the interface, and explore the errors found in the osu! project.

PVS-Studio is a tool for detecting potential bugs and vulnerabilities in C, C++, C#, and Java code. It works on Windows, Linux, and macOS, and supports numerous integration scenarios: as an IDE plugin, with game engines, code quality platforms, and much more. In the enterprise segment, PVS-Studio is a paid B2B solution used by many teams and companies around the world.
This is the third part of an article series on using PVS-Studio with a free license. Today, we continue diving into the tool and will practically explore the main stage of working with a static analyzer—reviewing the report and analyzing the errors!
Note. If you're interested in how to get a free license and set up PVS-Studio before the first project analysis, make sure you read the first and second parts of this series.
In the previous article, we concluded by performing an initial code analysis on the open-source osu! project and getting the analyzer report. It might seem that the tool's main job is done, but that's not the case. The most interesting part is just beginning :)
However, the rules of the game slightly change: now the primary responsibility lies with developers. It depends on them whether the analysis results will be interpreted correctly and how the detected issues will be fixed. The analyzer, in turn, becomes an assistant rather than the main character.
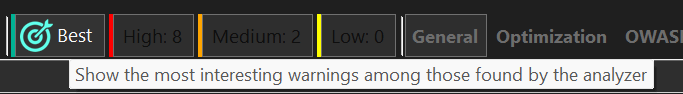
Enough digressions, let's continue. The analysis was completed. As we discussed in the previous article, the best way to quickly assess the tool's value for a project is to use the interface feature for selecting the most interesting warnings.
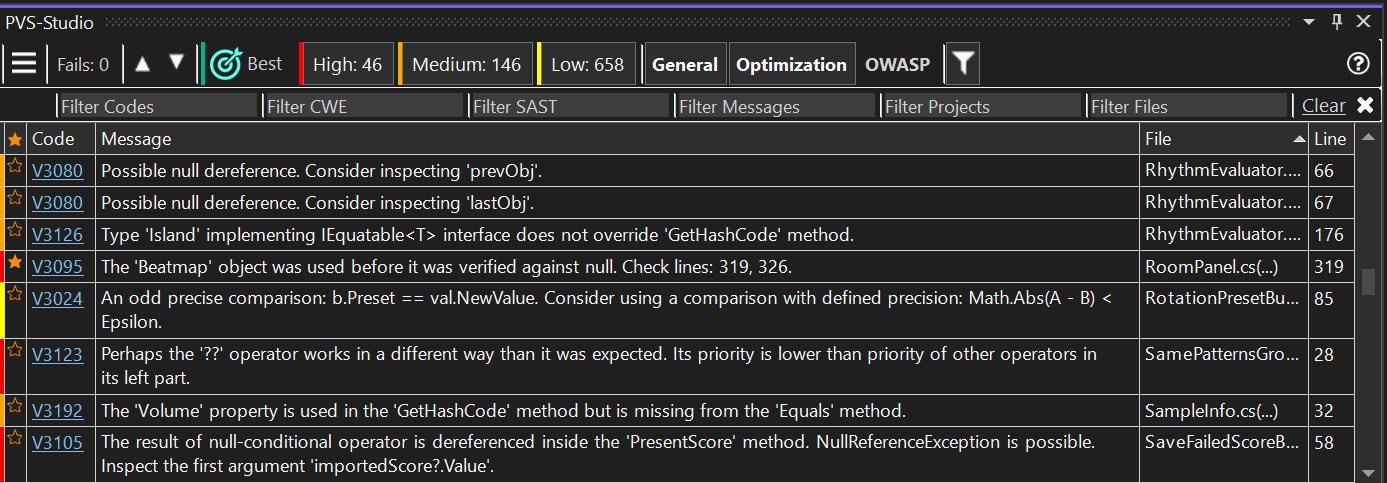
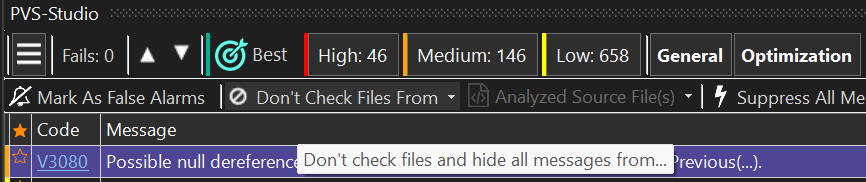
To display the most interesting warnings, click Best in the report interface. This filters the report down to 10 selected analyzer messages.

New users might be slightly puzzled by the number of buttons at first, but trust us, it's quite simple. Let's take a closer look. In the screenshot, we've marked the key areas: the diagnostic rule number (1), the analyzer message (2), the file with the error and line number where the warning triggered (3 and 4).
It's time to move on to the main event—reviewing the warnings! Let's choose the first message from the 10 Best ones.
Note. This is not the "top 10" list of analyzer warnings, but merely a selection of the most interesting ones. The order and placement here are not significant.
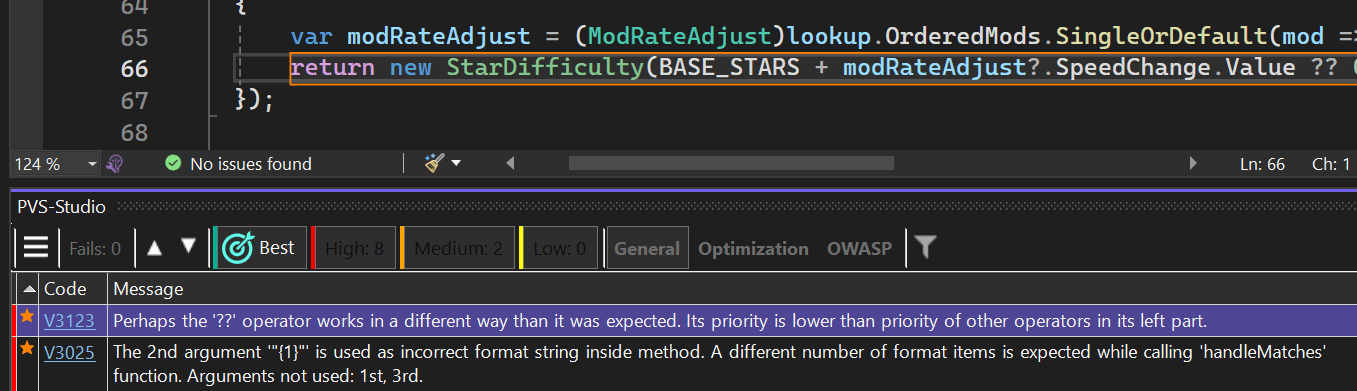
Clicking a warning opens the file where a potential error occurred. The analyzer navigates to the line and highlights the suspicious code fragment.
Let's examine it in more detail:
public partial class TestSceneBeatmapDifficultyCache
{
  ....
  AddStep(....)
  {
    var modRateAdjust = (ModRateAdjust)lookup.OrderedMods.SingleOrDefault(....);
    return new StarDifficulty
     (BASE_STARS + modRateAdjust?.SpeedChange.Value ?? 0, 0);
  }
}V3123 Perhaps the '??' operator works in a different way than it was expected. Its priority is lower than priority of other operators in its left part. TestSceneBeatmapDifficultyCache.cs 66
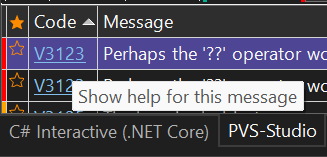
From the analyzer message, it becomes clear that the potential error involves an issue with operator precedence, specifically with the?? operator. Its precedence is lower than that of other operators. We can delve deeper into the diagnostic rule and check the documentation by clicking the error code:
The documentation opens directly in the IDE:
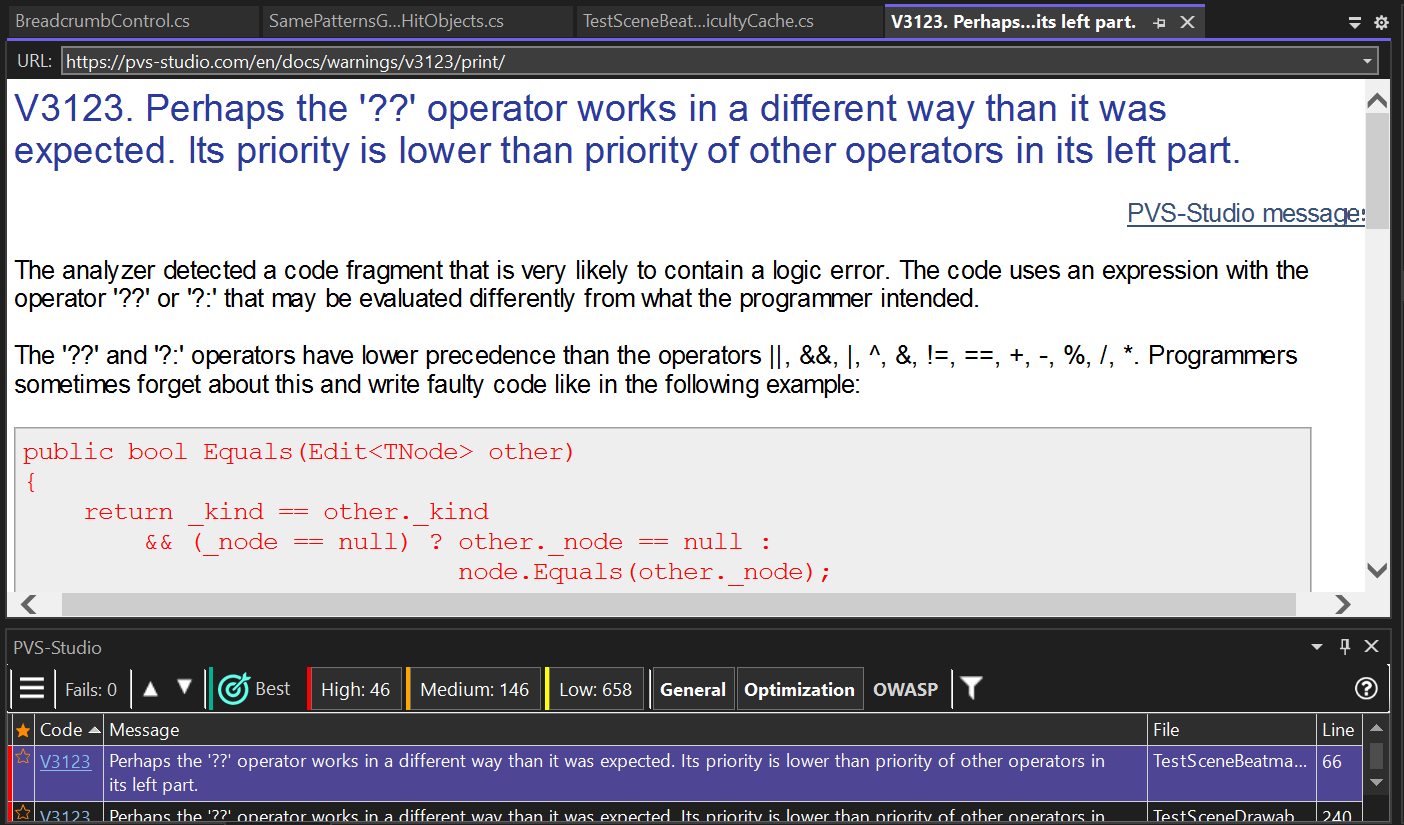
There, we can find the problem description, an example of the error, and its possible fix.
Now, let's return to the analyzer warning. For clarity, we can add extra parentheses (the diagnostic rule documentation also recommends adding them to avoid such errors). Based on the current code, we can assume developers expected this check:
BASE_STARS + (modRateAdjust?.SpeedChange.Value ?? 0)However, they might have made a mistake by not considering the specifics of the ?? operator and get this:
(BASE_STARS + modRateAdjust?.SpeedChange.Value) ?? 0But why do we think so? It's simple: if we look at the code beyond the fragment highlighted by the analyzer (which is necessary when studying a potential error), we can discover an important context:
public partial class TestSceneBeatmapDifficultyCache
{
  public const double BASE_STARS = 5.55;
  ....
  AddStep(....)
  {
    var modRateAdjust = (ModRateAdjust)lookup.OrderedMods.SingleOrDefault(....);
    return new StarDifficulty
     (BASE_STARS + modRateAdjust?.SpeedChange.Value ?? 0, 0);
  }
  ....
  AddUntilStep($"star difficulty -> {BASE_STARS + 1.5}",
    () =>   starDifficultyBindable.Value.Stars == BASE_STARS + 1.5);
  ....
  AddUntilStep($"star difficulty -> {BASE_STARS + 1.25}",
    () =>   starDifficultyBindable.Value.Stars == BASE_STARS + 1.25);
  ....
  AddUntilStep($"star difficulty -> {BASE_STARS + 1.75}",
    () =>   starDifficultyBindable.Value.Stars == BASE_STARS + 1.75);

}
We can already see that BASE_STARS is a constant, and there's no similar pattern of potential error elsewhere. Given that BASE_STARS is constant, it'd be strange to zero out the sum instead of the modRateAdjust?.SpeedChange.Value if the modRateAdjust? check fails.
Keep in mind that we're currently examining the code as external observers, without looking under the project's hood or knowing the developer's context. If you use the tool on a project familiar to you, it'll be much easier to fix the problems found by the analyzer.
But it's not just about fixing problems. The analyzer can be wrong, and developers must verify its results. Let's look at how to determine if the analyzer made a mistake and what to do in that case.
Let's examine a similar warning (the V3123 diagnostic rule) from the same project:
public class SamePatternsGroupedHitObjects
{
  public IReadOnlyList<SameRhythmHitObjectGrouping> Groups { get; }

  public SamePatternsGroupedHitObjects? Previous { get; }

  public double GroupInterval =>
    Groups.Count > 1 ? Groups[1].Interval :   Groups[0].Interval;

  public double IntervalRatio =>
    GroupInterval / Previous?.GroupInterval ?? 1.0d;
}V3123 Perhaps the '??' operator works in a different way than it was expected. Its priority is lower than priority of other operators in its left part. SamePatternsGroupedHitObjects.cs 28
It's difficult to say right now whether there is an error here, as the analyzer suggests. But everything falls into place if we display the comment for this code:
public class SamePatternsGroupedHitObjects
{
  ....

  /// The ratio of GroupInterval between this
and the previous SamePatternsGroupedHitObjects.
  ///In the case where there is no previous
SamePatternsGroupedHitObjects, this will have a value of 1.

  public double IntervalRatio =>
    GroupInterval / Previous?.GroupInterval ?? 1.0d;
}
Thanks to this comment, we can understand what developers have intended. If Previous?.GroupInterval is absent (null), the entire expression will be 1. Or, if we add parentheses, it'll look like this:
public double IntervalRatio =>
  (GroupInterval / Previous?.GroupInterval) ?? 1.0d;
Here we get one thing: there is no error! Yes, it's not obvious if we only look at the code. Without the comment, it'd be impossible to tell... But the fact remains: there is no problem.
What does this mean? Does the analyzer perform poorly? Not at all! False-positive warnings aren't a problem but a part of the technology. We should learn how to interact with it and understand how to distinguish a true warning from a false one. When developing diagnostic rules, we strive to minimize the possibility of false positives, filtering out obvious and non-obvious cases, and considering various known patterns of using certain constructs. But sometimes the analyzer simply lacks context. This is exactly where the tool configuration, which we discussed in the previous article, can help.
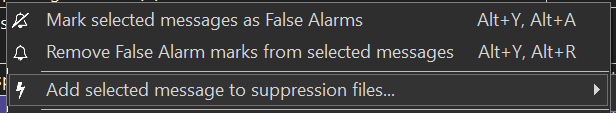
So, what should you do? Just ignore the warning? Of course not! You mark it as false by right-clicking the analyzer message and selecting the first item in the menu:
Note. This way, you mark the warning with a comment in the source code. You can also click Add selected message to suppression files, which will place warnings in a file created by the analyzer without modifying the source code.
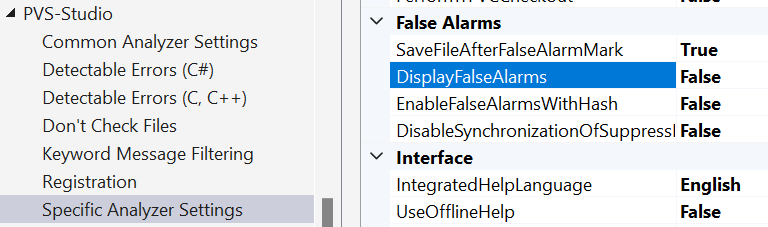
This mechanism doesn't remove the warning from the list of messages but marks it as false and hides it from the report. To restore such warnings, enable the DisplayFalseAlarm setting in the Specific Analyzer Settings:
Note. After you "remove" the message from the Best tab, another warning will take its place.
Then, you review the remaining analyzer warnings in the same way!
Did you enjoy the experience? Want to continue? Then let's move on!
Okay, you've reviewed and possibly fixed all 10 warnings. What's next? Continue reviewing and fixing the rest ones, right?... Well... almost.
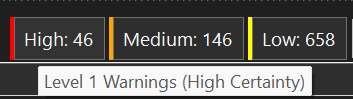
If it's a small project or a fairly fresh one, that's a reasonable choice. But if you have a large legacy project, the situation with the number of warnings might not be that rosy:
Most likely, you won't want to go and fix them all, and it might seem like you've reached a dead end because dealing with them isn't very appealing.
But all isn't lost! For this very scenario, our tool has a special mechanism for mass suppression:
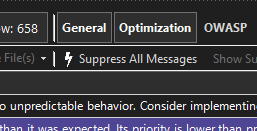
This mechanism allows you to hide all legacy warnings, so the analyzer will only issue warnings for new and modified code. This way, you can seamlessly start using the tool, dealing only with new potential errors.
All suppressed analyzer warnings aren't lost forever, and you can return to them later.
We've covered this topic in more detail in another article.
After the first experience, let's look at more advanced techniques for working with the report. For this, let's look closer at the interface:
Here you can:
Now let's break it down in more detail.
Let's go through the interface functionality again, this time covering all features.
Selecting the best warnings
To quickly evaluate the tool's value, there is the Best feature, which collects the 10 most interesting warnings from the entire report. To enable it, click Best at the top of the interface:
Sorting by certainty levels
The analyzer allows sorting messages by three certainty levels: High, Medium, and Low. The higher the certainty level, the greater the probability that the error is real and could affect the program. For standard work with analysis results, we recommend disabling the Low level.
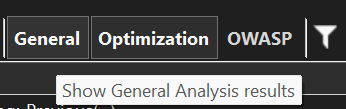
Enabling/disabling diagnostic groups
You can enable and disable diagnostic groups without opening the settings tab. For example, you can toggle optimization diagnostic rules or diagnostic rules based on the OWASP standard:
Quick filtering
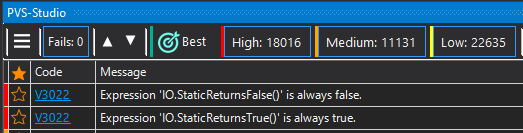
This mechanism enables you to filter the analyzer messages matching an entered value for a specific field. For instance, you can display only messages from the V3022 diagnostic rule in a specific file:

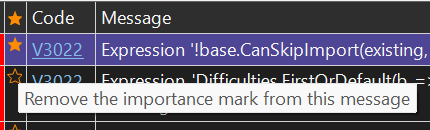
Marking interesting warnings
You can also add warnings to Favorites. These marks are saved in the report. You can also sort warnings by them:
Additional features
Right-clicking an analyzer message opens a context menu:
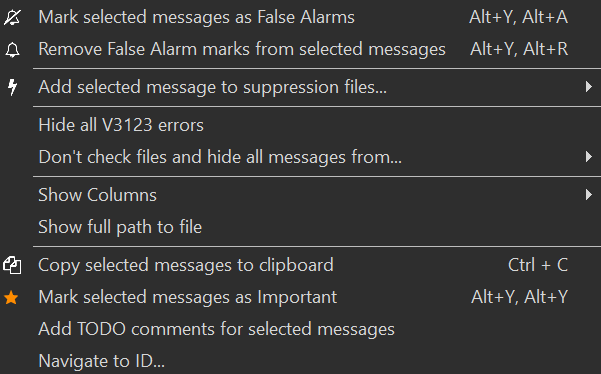
Here, you can:
For additional information on working with the report in the PVS-Studio plugin for Visual Studio, you can always refer to the documentation.
Note. While working on this article series, we found a considerable number of new errors in the osu! project. Certainly, we want to show them to you! Look forward to a new article with the project analysis on our blog.
In the first, second, and third parts of the articles on using PVS-Studio static analyzer for free projects, we've covered the tool's main capabilities and walked a beginner's path. We hope this small trip was helpful to you!
If you have suggestions for topics to cover, please share your ideas in the comments.
0
0
0

0