
Our website uses cookies to enhance your browsing experience.
Webinar: Let's make a programming language. Lexer - 29.04

We're continuing to explore ways of using PVS-Studio for free projects and more. This article covers the main settings of the analyzer, explains why they're important, and details where to start when running an analysis on a new project for the first time.
PVS-Studio is a tool for detecting potential errors and vulnerabilities in C, C++, C#, and Java code. It runs on Windows, Linux, and macOS and offers a wide range of integration scenarios—from IDE plugins to use in version control or code quality systems and more. In the enterprise segment, PVS-Studio is a paid B2B solution used by many teams and companies around the world.
This is the second part in a series of articles on using PVS-Studio with a free license. We continue our introduction to the tool. Today, we'll look at how to configure the analyzer for a new project and how to run it for the first time.
In the previous article, we concluded that it's best to start using a static analyzer by accurately configuring it for the target project. This not only helps optimize the analyzer's performance, but also reduces the rate of false positives.
Let's go through the main configuration options for the analyzer. We'll break it down on the example of using the PVS-Studio plugin for Visual Studio.
Note. You can find the analyzer settings in this menu: Extensions > PVS-Studio > Options.
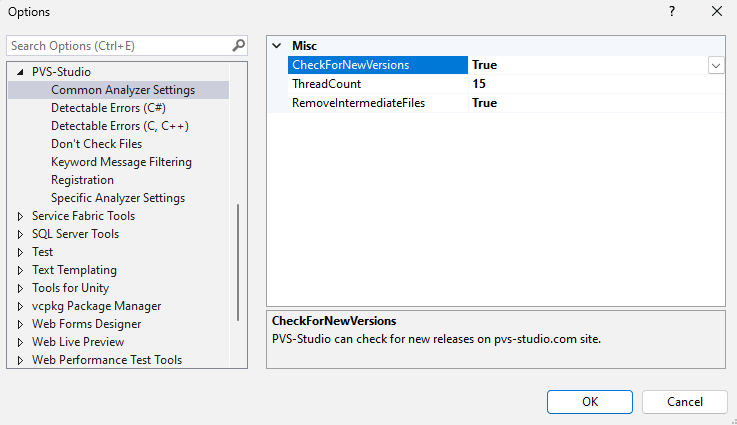
The first section is Common Analyzer Settings. This tab specifies general analyzer settings that are independent of the analysis module being used. Let's look at the settings:
Check For New Versions. If True, the analyzer will automatically check for a new version.
ThreadCount (the number of threads). The default value is set to the number of processor cores. Multi-core machines analyze files faster. However, if you need to limit the number of cores, you can specify the maximum number to be used.
RemoveIntermediateFiles. This setting helps preserve the temporary files left behind by the analyzer if any issues are detected in its operation. They're usually of no interest to users, so they're deleted immediately after the analysis. However, in some cases (for example, to send them to us), it may be useful to keep these files.
For more information about Common Analyzer Settings, please refer to the documentation.
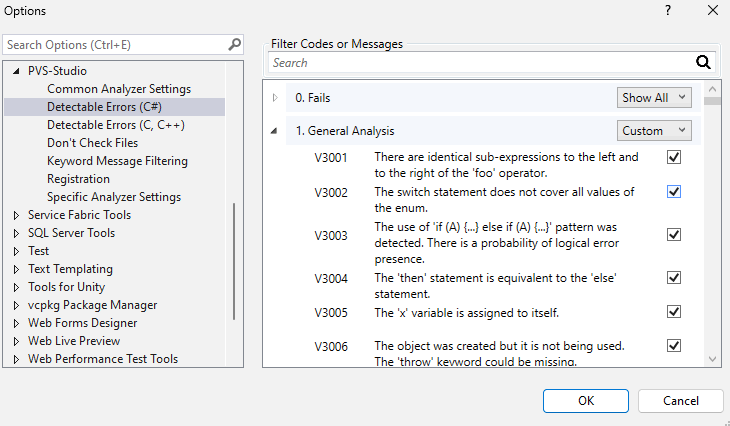
This section enables you to choose which warnings to include in the analyzer report.
In some cases, it's beneficial to disable warnings from specific diagnostic rules or entire groups of diagnostic rules. For example, if the diagnostic rules in the "Optimization" group are irrelevant to you, you can hide the entire group of warnings or disable specific rules.
There are the following warning groups:
For more information about Detectable Errors, please refer to the documentation.
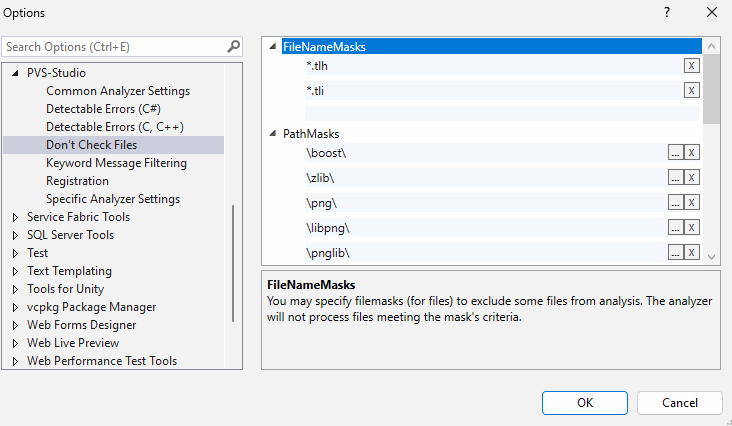
This setting section enables you to exclude files and folders from the analysis using masks. The analyzer won't check files that meet the conditions.
This allows you to enhance analysis quality and performance by excluding unnecessary files that may not be directly related to the project, such as auto-generated files. Common excluded directories and extensions are specified by default.
For more details on using masks to exclude files from the analysis, please refer to the documentation.
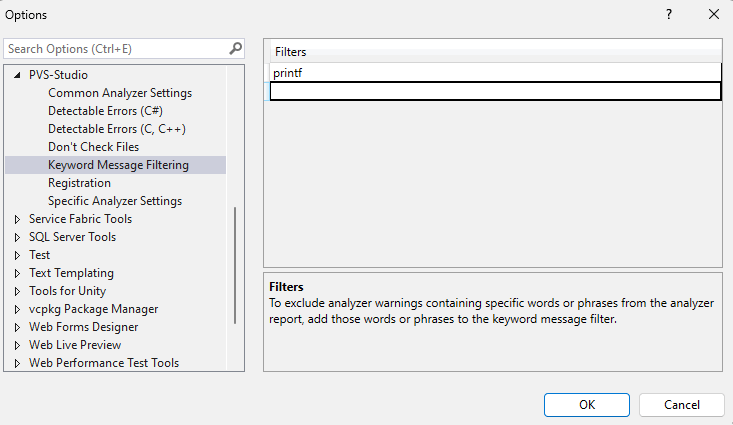
This section enables you to exclude warnings from the analyzer report using keywords.
For example, you're certain that the warnings related to printf in your project are false positives and that there's no issue. Then, you can add the printf keyword to the filter, and all messages containing that value will be filtered out (without having to restart the analysis).
For more information about Keyword Message Filtering, please refer to the documentation.
This setting page enables you to enter your license information to activate the analyzer. If this has already been done, you can view basic license information, such as its details, the license type, and remaining license period.
For information on licensing terms, see this page.
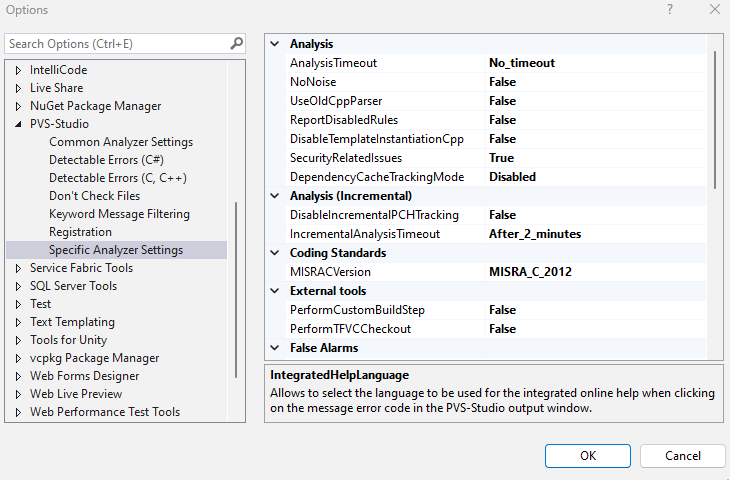
This section includes various additional analyzer settings for more precise configuration of the tool to the project specifics.
For example, in the Analysis category, you can set an analysis time limit or disable "noisy" diagnostic rules. In the Coding Standards section, you can configure the coding standard version. In the Interface category, you can switch the documentation language or enable the off-line version. There are also various interface settings.
You can learn more about these and other types of settings in the documentation.
Now, let's move on to running the analysis, which isn't too complicated :)
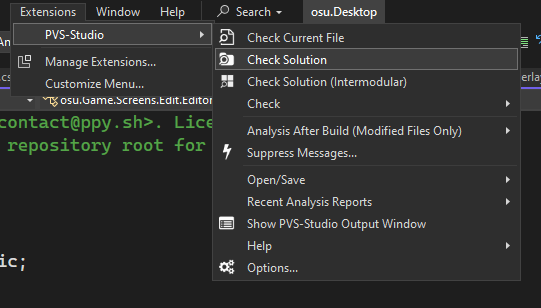
The PVS-Studio plugin provides options for analyzing entire solutions, individual projects, or files.
Important note! For the project analysis to work correctly, the project being checked must compile.
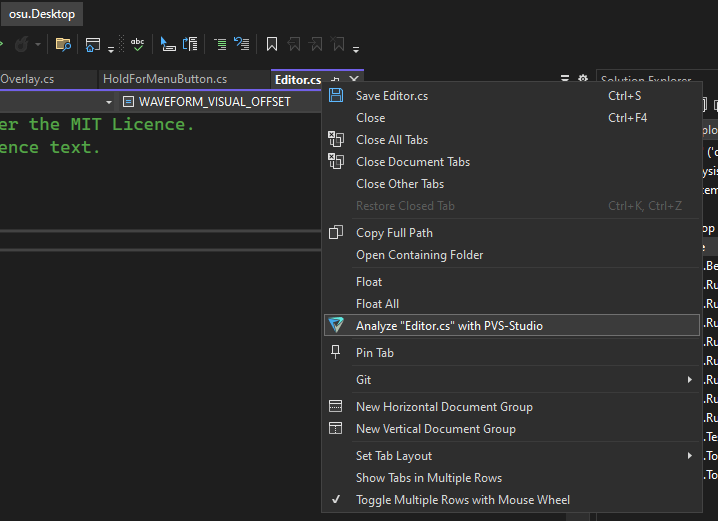
The plugin menu is just one way to check a file. You can also run the analysis from either the file context menu or the file header context menu in the editor.
After a brief wait, depending on the size of the project, you'll receive the analyzer report:
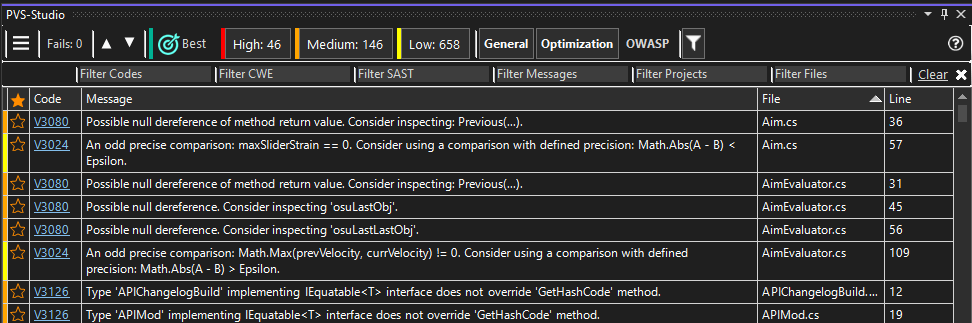
You can do the following here:
Where is the best place to start when using the tool for the first time, though?
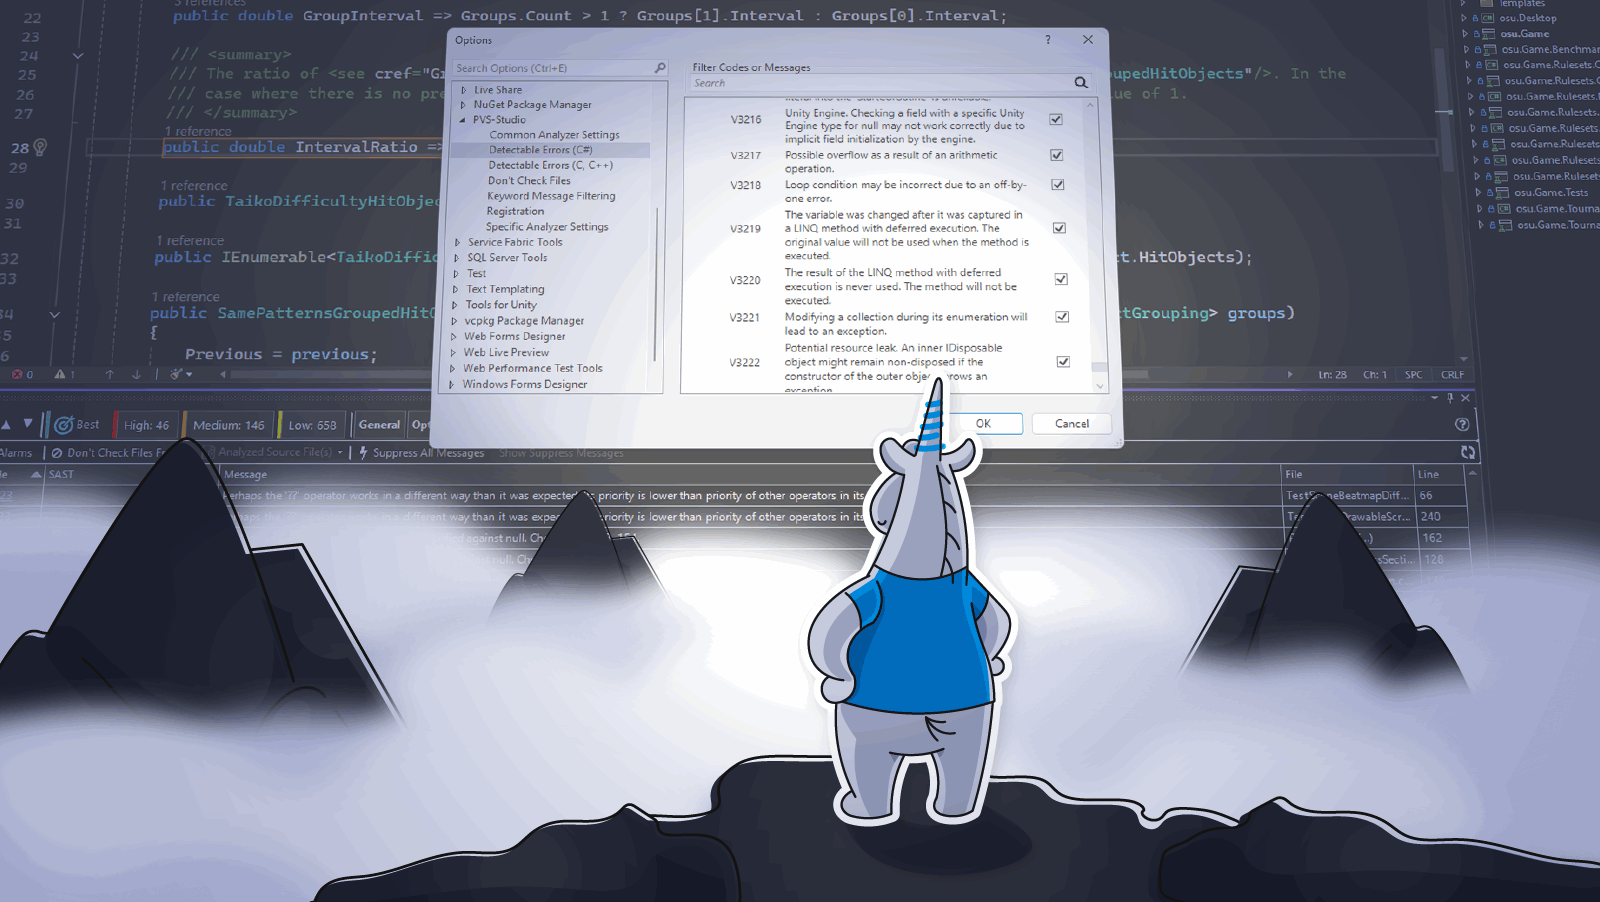
If you're new to static analysis tools and want to see what they can do, try the Best Warnings mechanism. It's specifically designed for your first introduction to PVS-Studio static analyzer.
This mechanism highlights the most significant and reliable warnings in the report for your project. To display ten most interesting warnings, click the Best button:
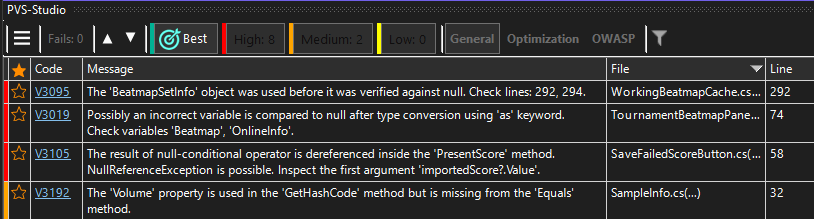
That's it! You now have ten warnings that can help you make an educated guess about the usefulness of the remaining analyzer messages.
Stay tuned for more information on working with reports and warnings in the following article!
Note. To make the wait easier, feel free to look through the documentation for our tool. It covers all the main topics in more detail.
If you have any questions about the analyzer configuration or how the tool works, please ask them in the comments section below the article or via the feedback form.
0
0
0

0