People increasingly start optimizing the process of finding code errors using static analyzers. Nowadays, we can choose from a variety of products to view analysis results. This post covers the ways how to view an analyzer report in the most stylish and feature-rich IDE among multifunctional ones – VSCode. The SARIF format and a special plugin for it allow us to perform our task. Keep reading to find out about this. Let's get going!

I wrote this article at the request of our reader who left a comment on the previous article about SARIF. These posts form some kind of an article series on SARIF :) So if interested to learn more where and how you can use this format (or anything else), then drop your wishes in comments.
SARIF (Static Analysis Results Interchange Format) is a JSON-based static analysis results exchange format for the output of static analysis tools. It is meant to interact with other tools: IDEs, integrated code checking analysis tools (such as SonarQube), continuous integration systems, etc.
That is, before this interchange format, static analyzers worked like this:
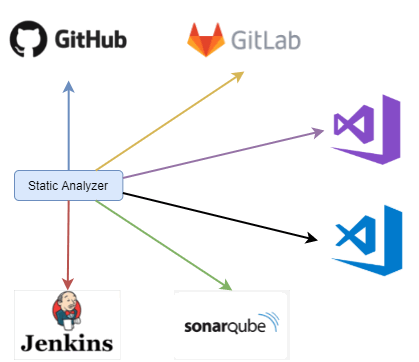
Each product has its own standard to adjust to. Agree, it's not very convenient. By introducing SARIF, we get a different picture:

In a perfect world, it's enough to get a report in this format. Next you can open\use it in any program\system that handles static analysis results.
SARIF is a unified format. You can get a SARIF report using different static analyzers and tools. In this case, we use the PVS-Studio analyzer and PlogConverter – the report format conversion utility. The PVS-Studio team develops both tools.
To get the SARIF report, I picked a simple and interesting example of a C# source code fragment to check:
using System;
using System.Collections.Generic;
using System.Linq;

namespace SarifTest
{
    class Program
    {
        static void Main(string[] args)
        {
            var start = Convert.ToInt64(args[0]);
            var end = Convert.ToInt64(args[1]);
            ToString(start, end);
        }

        static string ToString(long start, long end)
        {
            if (end == long.MinValue)
            {
                if (start == long.MinValue)
                    return string.Format("[long.MinValue..long.MaxValue]", end);
                else
                    return string.Format("[{0}..long.MaxValue]", start);
            }
            else if (start == long.MinValue)
            {
                return string.Format("[long.MinValue..{0})", end);
            }
            else
            {
                return string.Format("[{0}..{1})", start, end);
            }
        }

        static int Formula42(int? coefficientA, int? coefficientB)
        {
            var data = new List<int>();
            if (coefficientA != null)
                data.Add(Formula42(coefficientA.Value));
            else if (coefficientB != null)
                data.Add(Formula42(coefficientA.Value));
            return data.SingleOrDefault();
        }

        static private int Formula42(int coefficient)
        {
            return coefficient;
        }


        static int CrazyCalculations()
        {
            var value = 10;
            value = value++;
            return value;
        }
    }
}
By the way, one of the errors in this example is based on the real error from the ILSpy project.
We use the PVS-Studio analyzer for the check. Using the "PVS-Studio_Cmd.exe" console utility, we start the analysis by running the command:
"C:\Program Files (x86)\PVS-Studio\PVS-Studio_Cmd.exe" \
-t "D:\Use_SARIF_Example\BestProjectCpp.sln" \
-o "D:\Use_SARIF_Example\results.plog"
Let's consider the command line in detail. The "-t" flag is required. It allows you to specify an object to check (sln or csproj/vcxproj file). The "-o" flag is responsible for the path to the file where the analysis results are written.
I forgot to mention that the analyzer requires a license to work. If you don't have it, you can get a trial version by clicking here.
We now have an output report in the PVS-Studio analyzer format. This is an output file with the ".plog" extension. We need to convert it to the SARIF format. For this, we use the PlogConverter utility.
PlogConverter is an open-source utility designed to convert PVS-Studio analyzer reports from one format to another. It is described in more detail in the documentation.
Let's convert the analyzer report to the SARIF format.
"C:\Program Files (x86)\PVS-Studio\PlogConverter.exe" \
"D:\Use_SARIF_Example\results.plog" \
-o "D:\Use_SARIF_Example" -t sarif -n results
That's it, now we have the report. We can move on to setting up VSCode.
Visual Studio Code is a lightweight, free, cross-platform code editor that provides ample customization opportunities. The editor is a kind of constructor that we build using plugins. That is, if we need to write a program in C#, we just download the appropriate plugin. You can do it like this:
It looks as follows:
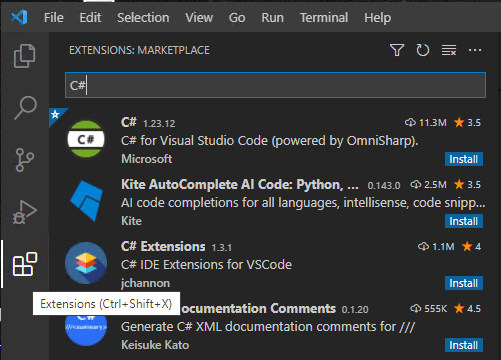
If you don't like the plugin you downloaded, you can disable it or delete. It takes a couple of clicks to do this:
It looks like this:

The plugin for working with SARIF reports can be installed in the same way as the installation of any other plugin. If you don't know how it's done, check out the section above.
As for VSCode, I recommend and use the "SARIF Viewer" plugin. Its installation does not require any additional settings.
Working with the plugin is simple. To begin with, you need to load the report. There are several ways to do this. The first is to choose your SARIF file, right click and select "open with VSCode".
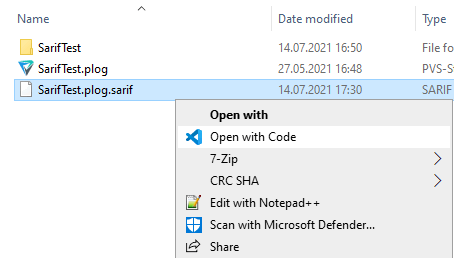
The second way is to open VSCode and open the SARIF file from it.

Third option. Open VSCode, find the Show All Commands bar (Ctrl + Shift + P by default). In the opening window enter sarif and select "SARIF: Show Panel"

In the opening window click "Open SARIF log" and select the SARIF file.
That's it. This was the most difficult part. The report is loaded, and you can start viewing warnings.
After you've loaded the report, you see the following:

Let's cover them one at a time.
The LOCATIONS menu is a list of warnings grouped by file:
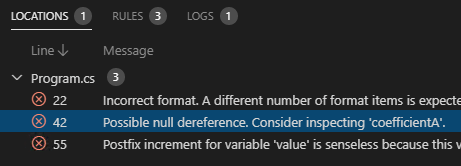
When you click on a message, you move to a problem spot in the code.

Note that all trouble spots are already highlighted with a wavy line. When you hover the cursor over this line, you see a description of the problem.

We can also shift between warnings using a shortcut (Alt + F8).
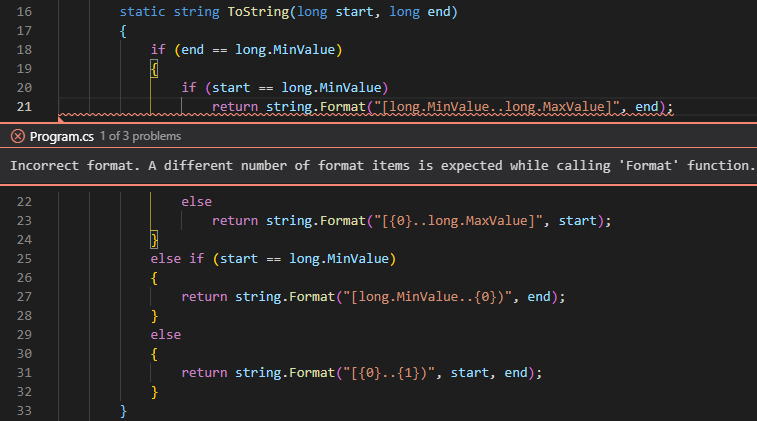
Next, we have the RULES menu. We can view the same messages in it, but grouped by diagnostic rules:
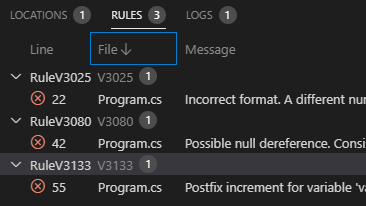
Clicking the message also lets you jump to the code.
The LOGS tab shows opened reports.

Ok, we've looked at all tabs. Please also note that each rule has a description at the bottom:
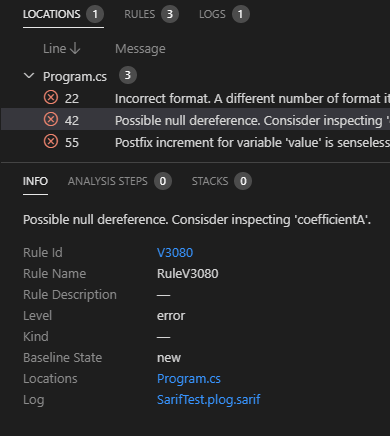
Click on the diagnostic code ("Rule Id" content) to switch to the documentation for this warning.
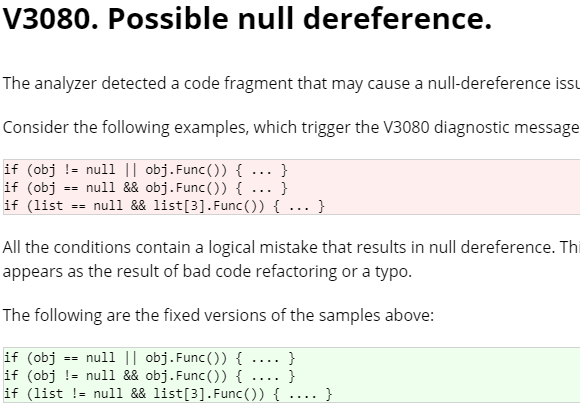
As you can see, the SARIF format allows us to simply and quickly use one more ready-made tool and get the result. Pretty convenient, right?
As for the plugin, I think it's a decent option for viewing static analyzer warnings. Perhaps in the future we'll write our own plugin with blackjack, bells and whistles (as we did recently for CLion). Until then, if you need\want to view static analyzer reports via the VS Code, give this product a try.
Thanks for reading!
0