PVS-Studio is a static code analyzer, that searches for errors and vulnerabilities in programs written in C, C++ and C#. In this article, I am going to uncover the technologies that we use in PVS-Studio analyzer. In addition to the general theoretical information, I will show practical examples of how certain technology allows the detection of bugs.
The reason for writing this article, was my report on the open conference ISPRAS OPEN 2016 that took place in the beginning of December, in the main building of the Russian Academy of Sciences. The subject of the report: "The operation principles of PVS-Studio static code analyzer" (presentation in the pptx format)
Unfortunately, the time for the report was very limited, so I had to come up with a very short presentation, and I couldn't cover all the topics I wanted to cover. And so I decided to write this article, where I will give more details on the approaches and algorithms that we use in the development of the PVS-Studio analyzer.
At the moment, PVS-Studio is, in fact, two separate analyzers, one for C++ and another for C#. Moreover, they are written in different languages; we develop the kernel of C++ analyzer in C++, and the C# kernel - in C#.
However, developing these two kernels, we use similar approaches. Besides this, a number of employees participate in the development of both C++ and C # diagnostics at the same time. This is why I won't separate these analyzers any further in this article. The description of the mechanisms will be the same for both analyzers. Of course, there are some differences, but they are quite insignificant for the analyzer overview. If there is a need to specify the analyzer, I will say if I am talking about the C++ analyzer or C#.
Before I get into the description of the analyzer, I will say a couple of words about our company, and our team.
The PVS-Studio analyzer is developed by the Russian company - OOO "Program Verification Systems". The company is growing and developing solely on profit gained from product sales. The company office is located in Tula, 200 km to the south of Moscow.
At the time of writing this article, the company has 24 employees.

To some people it may seem that one person would be enough to create the analyzer. However, the job is much more complicated and requires a lot of work-years. The maintenance and further development of the product requires even more work-years.
We see our mission in the promoting the methodology of static code analysis. And of course, to get financial reward, developing a powerful tool that allows the detection of a large number of bugs at the earliest stages of development.
To spread the word about PVS-Studio, we regularly check open source projects, and describe the findings in our articles. At the moment, we have checked about 270 projects.
Since the moment we started writing articles we have found more than 10 000 errors, and reported them to the authors of the projects. We are quite proud of this, and I should explain why.
If we divide the number of bugs found by the number of projects, we get quite an unimpressive number: 40 errors per project. So I want to highlight an important point; these 10000 bugs are a side effect. We have never had the goal to find as many errors as possible. Quite often, we stop when we find enough errors for an article.
This shows quite well the convenience, and the abilities, of the analyzer. We are proud that we can simply take different projects and start searching for bugs immediately, almost without the need to set up the analyzer. If it weren't so, we wouldn't be able to detect 10000 bugs just as a side effect of writing the articles.
Briefly, PVS-Studio is:
The C and C++ languages are extremely effective and graceful. But in return they require a lot of attention, and deep knowledge of the subject. This is why static analyzers are so popular among C and C++ developers. Despite the fact that the compilers and development tools are also evolving, nothing really changes. I will explain what I mean by that.
We did a check of the first Cfront compiler, written in 1985 in honor of the 30-year anniversary. If you are interested, you may find more details in the article: "Celebrating the 30-th anniversary of the first C++ compiler: let's find the bugs in it".
There, we found the following bug:
Pexpr expr::typ(Ptable tbl)
{
  ....
  Pclass cl;
  ....
  cl = (Pclass) nn->tp;
  cl->permanent=1;                                    // <= use
  if (cl == 0) error('i',"%k %s'sT missing",CLASS,s); // <= test
  ....
First, the pointer cl is dereferenced, and only then it is verified against NULL.
30 years passed.
Here is the modern Clang compiler, not Cfront. And here is what PVS-Studio detects in it:
....
Value *StrippedPtr = PtrOp->stripPointerCasts();
PointerType *StrippedPtrTy =
  dyn_cast<PointerType>(StrippedPtr->getType());  // <= use
if (!StrippedPtr)                                 // <= test
  return 0;
....
There is a saying: "Bugs. C++ bugs never change". The pointer StrippedPtr is dereferenced first, and then verified against NULL.
The analyzers are extremely helpful for C and C++ languages. This is why we started developing PVS-Studio analyzer for these languages, and will continue doing so. There is a high probability that PVS-Studio won't have less job in the future, as these languages are really popular, and dangerous, at the same time.
Of course, in some regard, C# is more thought-out, and safer than C++. Still, it is not perfect and it also causes a lot of hassle for programmers. I'll give only one example, because it is a topic for a separate article.
Here is our old good buddy - the error we described before. A fragment from the project PowerShell:
....
_parameters = new Dictionary<string, ParameterMetadata>(
  other.Parameters.Count,                          // <= use
  StringComparer.OrdinalIgnoreCase);
if (other.Parameters != null)                      // <= test
....
First, the reference other.Parameters is used to get the property Count, and only then verified against null.
As you can see, in C# the pointers are now called references, but it didn't really help. If we touch upon the topic of typos, they are made everywhere, regardless of the language. In general, there is a lot to do in C#, so we continue developing this direction.
For now we don't have exact plans on what language we want to support next. We have two candidates: Objective-C and Java. We are leaning more towards Java, but it is not decided yet.

Before speaking about the inner structure of PVS-Studio, I should briefly state what you won't find there.
PVS-Studio has nothing to do with the Prototype Verification System (PVS). It's just a coincidence. PVS-Studio is a contraction of 'Program Verification Systems' (OOO "Program Verification Systems").
PVS-Studio does not use formal grammar for the bug search. The analyzer works on a higher level. The analysis is done on the basis of the derivation tree.
PVS-Studio does not use the Clang compiler to analyze C/C++ code; we use Clang to do the preprocessing. More details can be found in the article: "A few words about interaction between PVS-Studio and Clang". To build the derivation tree, we use our own parser that was based on the OpenC++ library, which has been quite forgotten now in the programming world. Actually there is almost nothing left from this library and we implement the support of new constructions ourselves.
When working with C# code we take Roslyn as the basis. The C# analyzer of PVS-Studio checks the source code of a program, which increases the quality of the analysis compared with binary code analysis (Common Intermediate Language).
PVS-Studio does not use the string matching and regular expressions. This way, is a dead-end. This approach has so many disadvantages that it's impossible to create a more or less qualitative analyzer based on it, and some diagnostics cannot be implemented at all. This topic is covered in more details in the article "Static analysis and regular expressions".
To ensure high quality in our static analysis results, we use advanced methods of source code analysis for the program and its control flow graph: let's see what they are.
Note. Further on, we'll have a look at several diagnostics, and take a look at the principles of their work. It is important to note that I deliberately omit the description of those cases when the diagnostic should not issue warnings, so as not to overload this article with details. I have written this note for those who didn't have any experience in the development of an analyzer: don't think that it's as simple as it may seem after reading the material below. It is only 5% of the task to create the diagnostic. It's not hard for the analyzer to complain about suspicious code, it's much harder to not complain about the correct code. We spend 95% of our time "teaching" the analyzer to detect various programming techniques, which may seem suspicious for the diagnostic, but in reality they are correct.
Pattern-based analysis is used to search for fragments in the source code that are similar to known error containing code. The number of patterns is huge, and the complexity of their detection varies greatly.
Moreover, in some cases, the diagnostics use empirical algorithms to detect typos.

For now, let's consider two simplest cases that are detected with the help of the pattern-based analysis. The first simple case:
if ((*path)[0]->e->dest->loop_father != path->last()->e->....)
{
  delete_jump_thread_path (path);
  e->aux = NULL;
  ei_next (&ei;);
}
else
{
  delete_jump_thread_path (path);
  e->aux = NULL;
  ei_next (&ei;);
}
PVS-Studio warning: V523 The 'then' statement is equivalent to the 'else' statement. tree-ssa-threadupdate.c 2596
The same set of actions is performed regardless of the condition. I think everything is so simple that it requires no special explanation. By the way, this code fragment is not taken from a student's coursework, but from the code of the GCC compiler. The article "Finding bugs in the code of GCC compiler with the help of PVS-Studio" describes those bugs we found in GCC.
Here is the second simple case (the code is taken from the FCEUX project):
if((t=(char *)realloc(next->name,strlen(name+1))))PVS-Studio warning: V518 The 'realloc' function allocates strange amount of memory calculated by 'strlen(expr)'. Perhaps the correct variant is 'strlen(expr) + 1'. fceux cheat.cpp 609
The following erroneous pattern gets analyzed. Programmers know that when they allocate memory to store a string, it is necessary to allocate the memory for a character, where the end of line character will be stored (terminal null). In other words, programmers know that they must add +1 or +sizeof(TCHAR). But sometimes they do it rather carelessly. As a result, they add 1 not to the value, which returns the strlen function, but to a pointer.
This is exactly what happened in our case. strlen(name)+1 should be written instead of strlen(name+1).
There will be less memory allocated than is necessary, because of such an error. Then we'll have the access out of the allocated buffer bound, and the consequences will be unpredictable. Moreover, the program can pretend that it works correctly, if the two bytes after the allocated buffer aren't used thanks to mere luck. With a worse-case scenario, this defect can cause induced errors that will show up in a completely different place.
Now let's have a look at the analysis of the medium complexity level.
The diagnostic is formulated like this: we warn that after using the as operator, the original object is verified against null instead of the result of the as operator.
Let's take a look at a code fragment taken from CodeContracts:
public override Predicate JoinWith(Predicate other)
{
  var right = other as PredicateNullness;
  if (other != null)
  {
    if (this.value == right.value)
    {
PVS-Studio warning: V3019 Possibly an incorrect variable is compared to null after type conversion using 'as' keyword. Check variables 'other', 'right'. CallerInvariant.cs 189
Pay attention, that the variable other gets verified against null, not the right variable. This is clearly a mistake, because further the program works with the right variable.
And in the end - here is a complex pattern, related to the usage of macros.
The macro is defined in such a way that the operation precedence inside the macro is higher than the priority outside of the macro. Example:
#define RShift(a) a >> 3
....
RShift(a & 0xFFF) // a & 0xFFF >> 3
To solve this problem we should enclose the a argument in the parenthesis in the macro (it would be better to enclose entire macro too), then it will be like this:
#define RShift(a) ((a) >> 3),Then the macro will be correctly expanded into:
RShift(a & 0xFFF) // ((a & 0xFFF) >> 3)The definition of the pattern looks quite simple, but in practice the implementation of the diagnostic is quite complicated. It's not enough just to analyze only "#define RShift(a) a >> 3". If warnings are issued for all strings of this kind, there will be too many of them. We should have a look at the way the macro expands in every particular case, and try to define the situations where it was done intentionally, and when the brackets are really missing.
Let's have a look at this bug in a real project; FreeBSD:
#define  ICB2400_VPINFO_PORT_OFF(chan) \
  (ICB2400_VPINFO_OFF +                \
   sizeof (isp_icb_2400_vpinfo_t) +    \
  (chan * ICB2400_VPOPT_WRITE_SIZE))
....
off += ICB2400_VPINFO_PORT_OFF(chan - 1);
PVS-Studio warning: V733 It is possible that macro expansion resulted in incorrect evaluation order. Check expression: chan - 1 * 20. isp.c 2301
The type inference based on the semantic model of the program, allows the analyzer to have full information about all variables and statements in the code.
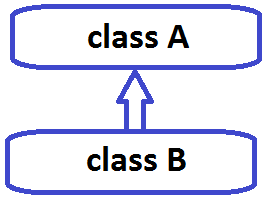
In other words, the analyzer has to know if the token Foo is a variable name, or the class name or a function. The analyzer repeats the work of the compiler, which also needs to know the type of an object and all additional information about the type: the size, signed/unsigned type; if it is a class, then how is it inherited and so on.
This is why PVS-Studio needs to preprocess the *.c/*.cpp files. The analyzer can get the information about the types only by analyzing the preprocessed file. Without having such information, it would be impossible to implement many diagnostics, or, they will issue too many false positives.
Note. If someone claims that their analyzer can check *.c/*.cpp files as a text document, without complete preprocessing, then it's just playing around. Yes, such an analyzer is able to find something, but in general it's a mere toy to play with.
So, information about the types is necessary both to detect errors, and also so as not to issue false positives. The information about classes is especially important.
Let's take a look at some examples of how information about the types is used.
The first example demonstrates that information about the type is needed to detect an error when working with the fprintf function (the code is taken from the Cocos2d-x project):
WCHAR *gai_strerrorW(int ecode);
....
#define gai_strerror gai_strerrorW
....
fprintf(stderr, "net_listen error for %s: %s",
        serv, gai_strerror(n));
PVS-Studio warning: V576 Incorrect format. Consider checking the fourth actual argument of the 'fprintf' function. The pointer to string of char type symbols is expected. ccconsole.cpp 341
The function frintf receives the pointer of the char * type as the fourth argument. It accidentally happened so that the actual argument is a string of the wchar_t * type.
To detect this error, we need to know the type that is returned by the function gai_strerrorW. If there is no such information, it will be impossible to detect the error.
Now let's examine an example where data about the type helps to avoid a false positive.
The code "*A = *A;" will be definitely considered suspicious. However, they analyzer will be silent if it sees the following:
volatile char *ptr;
....
*ptr = *ptr;  // <= No V570 warning
The volatile specifier gives a hint that it is not a bug, but the deliberate action of a programmer. The developer has to "touch" this memory cell. Why is it needed? It's hard to say, but if he does it, then there is a reason for it, and the analyzer shouldn't issue a warning.
Let's take a look at an example of how we can detect a bug, based on knowledge about the class.
The fragment is taken from the CoreCLR project.
struct GCStatistics : public StatisticsBase {
....
virtual void Initialize();
virtual void DisplayAndUpdate();
....
GCStatistics g_LastGCStatistics;
....
memcpy(&g_LastGCStatistics, this, sizeof(g_LastGCStatistics));
PVS-Studio warning: V598 The 'memcpy' function is used to copy the fields of 'GCStatistics' class. Virtual table pointer will be damaged by this. cee_wks gc.cpp 287.
It's acceptable to copy one object into another using the memcpy function, if the objects are POD-structures. However, there are virtual methods in the class, which means that there is pointer to a virtual methods table. It's very dangerous to copy this pointer from one object to another.
So, this diagnostic is possible due to the fact that we know that the variable of the g_LastGCStatistics is a class instance, and that this class isn't a POD-type.
Symbolic execution allows the evaluation of variable values that can lead to errors, and perform range checking of values. Sometimes we call this a mechanism of virtual values evaluation: see the article "Searching for errors by means of virtual values evaluation".
Knowing the probable values of the variables, we can detect errors such as:
Let's see how we can find various errors, knowing the probable values of the variables. Let's start with a code fragment taken from the QuantLib project:
Handle<YieldTermStructure> md0Yts() {
  double q6mh[] = {
    0.0001,0.0001,0.0001,0.0003,0.00055,0.0009,0.0014,0.0019,
    0.0025,0.0031,0.00325,0.00313,0.0031,0.00307,0.00309,
    ........................................................
    0.02336,0.02407,0.0245 };               // 60 elements
  ....
  for(int i=0;i<10+18+37;i++) {             // i < 65
    q6m.push_back(
      boost::shared_ptr<Quote>(new SimpleQuote(q6mh[i])));
PVS-Studio warning: V557 Array overrun is possible. The value of 'i' index could reach 64. markovfunctional.cpp 176
Here the analyzer has the following data:
Having this data, the V557 diagnostic detects the array index out of bounds during the execution of the q6mh[i] operation.
Now let's look at a situation where we have division by 0. This code is taken from the Thunderbird project.
static inline size_t UnboxedTypeSize(JSValueType type)
{
  switch (type) {
  .......
  default: return 0;
  }
}
Minstruction *loadUnboxedProperty(size_t offset, ....)
{
  size_t index = offset / UnboxedTypeSize(unboxedType);
PVS-Studio warning: V609 Divide by zero. Denominator range [0..8]. ionbuilder.cpp 10922
The UnboxedTypeSize function returns various values, including 0. Without checking that the result of the function may be 0, it is used as the denominator. This can potentially lead to division of the offset variable by zero.
The previous examples were about the range of integer values. However, the analyzer handles values of other data types, for example, strings and pointers.
Let's look at an example of incorrect handling of the strings. In this case, the analyzer stores the information that the whole string was converted to lower or uppercase. This allows us to detect the following situations:
string lowerValue = value.ToLower();
....
bool insensitiveOverride = lowerValue == lowerValue.ToUpper();
PVS-Studio warning: V3122 The 'lowerValue' lowercase string is compared with the 'lowerValue.ToUpper()' uppercase string. ServerModeCore.cs 2208
The programmer wanted to check if all the string characters are uppercase. The code definitely has some logical error, because all the characters of this string were previously converted to lowercase.
So, we can talk on and on about the diagnostics, based on the data of the variable values. I'll give just one more example related to the pointers and memory leaks.
The code is taken from the WinMerge project:
CMainFrame* pMainFrame = new CMainFrame;
if (!pMainFrame->LoadFrame(IDR_MAINFRAME))
{
  if (hMutex)
  {
    ReleaseMutex(hMutex);
    CloseHandle(hMutex);
  }
  return FALSE;
}
m_pMainWnd = pMainFrame;
PVS-Studio warning: V773 The function was exited without releasing the 'pMainFrame' pointer. A memory leak is possible. Merge merge.cpp 353
If the frame could not be loaded, the function exits. At the same time, the object, whose pointer is stored in the pMainFrame variable, doesn't get destroyed.
The diagnostics work as follows. The analyzer remembers that the pointer pMainFrame stores the object address, created with the new operator. Analyzing the control flow graph, the analyzer sees a return statement. At the same time, the object wasn't destroyed and the pointer continues referring to a created object. Which means that we have a memory leak in this fragment.
Method annotations provides more information about the used methods than can be obtained by analyzing only their signatures.
We have done a lot in annotating the functions:
Let's see how a memcmp function is annotated in the C++ analyzer kernel:
C_"int memcmp(const void *buf1, const void *buf2, size_t count);"
ADD(REENTERABLE | RET_USE | F_MEMCMP | STRCMP | HARD_TEST |
    INT_STATUS, nullptr, nullptr, "memcmp",
    POINTER_1, POINTER_2, BYTE_COUNT);
A brief explanation of the annotation:
The annotations data is used by many diagnostics. Let's take a look at some of the errors that we found in the code of applications, thanks to the annotation for the memcmp function.
An example of using the INT_STATUS annotation. The CoreCLR project
bool operator()(const GUID& _Key1, const GUID& _Key2) const
{
  return memcmp(&_Key1, &_Key2, sizeof(GUID)) == -1;
}
V698 Expression 'memcmp(....) == -1' is incorrect. This function can return not only the value '-1', but any negative value. Consider using 'memcmp(....) < 0' instead. sos util.cpp 142
This code may work well, but in general, it is incorrect. The function memcmp returns values 0, greater and less than 0. Important:
Thus, there is no guarantee that such code is well-behaved. At any moment the comparison may start working incorrectly. This may happen during the change of the compiler, changes in the optimization settings, and so on.
The flag INT_STATUS helps to detect one more kind of an error. The code of Firebird project:
SSHORT TextType::compare(ULONG len1, const UCHAR* str1,
ULONG len2, const UCHAR* str2)
{
  ....
  SSHORT cmp = memcmp(str1, str2, MIN(len1, len2));
  if (cmp == 0)
    cmp = (len1 < len2 ? -1 : (len1 > len2 ? 1 : 0));
  return cmp;
}
PVS-Studio. V642 Saving the 'memcmp' function result inside the 'short' type variable is inappropriate. The significant bits could be lost breaking the program's logic. texttype.cpp 3
Again, the programmer works inaccurately, with the return result of the memcmp function. The error, is that the type size is truncated; the result is placed into a variable of the short type.
Some may think that we are just too picky. Not in the least. Such sloppy code can easily create a real vulnerability.
One such mistake, was the root of a serious vulnerability in MySQL/MariaDB in versions earlier than 5.1.61, 5.2.11, 5.3.5, 5.5.22. The reason for this was the following code in the file 'sql/password.c':
typedef char my_bool;
....
my_bool check(...) {
  return memcmp(...);
}
The thing is, that when a user connects to MySQL/MariaDB, the code evaluates a token (SHA from the password and hash) that is then compared with the expected value of memcmp function. But on some platforms the return value can go beyond the range [-128..127] As a result, in 1 out of 256 cases the procedure of comparing hash with an expected value always returns true, regardless of the hash. Therefore, a simple command on bash gives a hacker root access to the volatile MySQL server, even if the person doesn't know the password. A more detailed description of this issue can be found here: Security vulnerability in MySQL/MariaDB.
An example of using the BYTE_COUNT annotation. The GLG3D project
bool Matrix4::operator==(const Matrix4& other) const {
  if (memcmp(this, &other, sizeof(Matrix4) == 0)) {
    return true;
  }
  ....
}
PVS-Studio warning: V575 The 'memcmp' function processes '0' elements. Inspect the 'third' argument. graphics3D matrix4.cpp 269
The third argument of the memcmp function is marked as BYTE_COUNT. It is supposed that such an argument should not be zero. In the given example the third actual parameter is exactly 0.
The error is that the bracket is misplaced there. As a result, the third argument is the expression sizeof(Matrix4) == 0. The result of the expression is false, i.e. 0.
An example of using the markup POINTER_1 and POINTER_2. The GDB Project:
static int
psymbol_compare (const void *addr1, const void *addr2,
int length)
{
  struct partial_symbol *sym1 = (struct partial_symbol *) addr1;
  struct partial_symbol *sym2 = (struct partial_symbol *) addr2;
  return (memcmp (&sym1->ginfo.value, &sym1->ginfo.value,
sizeof (sym1->ginfo.value)) == 0
          && .......
PVS-Studio warning: V549 The first argument of 'memcmp' function is equal to the second argument. psymtab.c 1580
The first and second arguments are marked as POINTER_1 and POINTER_2. Firstly, this means that they must not be NULL. But in this case, we are interested in the second property of the markup: these pointers must not be the same, the suffixes _1 and _2 show that.
Because of a typo in the code, the buffer &sym1->ginfo.value is compared with itself. Relying on the markup, PVS-Studio easily detects this error.
An example of using the F_MEMCMP markup.
This markup includes a number of special diagnostics for such functions as memcmp and __builtin_memcmp. As a result, the following error was detected in the Haiku project:
dst_s_read_private_key_file(....)
{
  ....
  if (memcmp(in_buff, "Private-key-format: v", 20) != 0)
    goto fail;
  ....
}
PVS-Studio warning: V512 A call of the 'memcmp' function will lead to underflow of the buffer '"Private-key-format: v"'. dst_api.c 858
The string "Private-key-format: v" has 21 symbols, not 20. Thus, a smaller amount of bytes is compared than should be.
Here is an example of using the REENTERABLE markup. Frankly speaking, the word "reenterable" does not entirely depict the essence of this flag. However, all our developers are quite used to it, and don't want to change it for the sake of some beauty.
The essence of the markup is in the following. The function doesn't have any state, or any side effects; it doesn't change the memory, doesn't print anything, does not remove the files on the disc. That's how the analyzer can distinguish between correct and incorrect constructions. For example, code such as the following is quite workable:
if (fprintf(f, "1") == 1 && fprintf(f, "1") == 1)The analyzer will not issue any warnings. We are writing two items to the file, and the code cannot be contracted to:
if (fprintf(f, "1") == 1) // incorrectBut this code is redundant, and the analyzer will be suspicious about it, as the function cosf doesn't have any state and doesn't write anything:
if (cosf(a) > 0.1f && cosf(a) > 0.1f)Now let's go back to the memcmp function, and see which error we managed to find in PHP with the help of the markup we spoke of earlier:
if ((len == 4) /* sizeof (none|auto|pass) */ &&
    (!memcmp("pass", charset_hint, 4) ||
     !memcmp("auto", charset_hint, 4) ||
     !memcmp("auto", charset_hint, 4)))
PVS-Studio warning: V501 There are identical sub-expressions '!memcmp("auto", charset_hint, 4)' to the left and to the right of the '||' operator. html.c 396
It is checked twice that the buffer has the "auto" word. This code is redundant, and the analyzer assumes it has an error. Indeed, the comment tells us that comparison with the string "none" is missing here.
As you can see, using the markup, you can find a lot of interesting bugs. Quite often, the analyzers provide the possibility of annotating the functions themselves. In PVS-Studio, these opportunities are quite weak. It has only several diagnostics that you can use to annotate something. For example, the diagnostic V576 to look for bugs in the usage of the format output functions (printf, sprintf, wprintf, and so on).
We deliberately don't develop the mechanism of user annotations. There are two reasons for this:
I'll briefly summarize the information about the technologies we use. PVS-Studio uses:
Based on these technologies the analyzer can identify the following classes of bugs in C, C++ and C# programs:
Conclusion. PVS-Studio is a powerful tool in the search for bugs, which uses an up-to-date arsenal of methods for detection.

Yes, PVS-Studio is like a superhero in the world of programs.
The development of an analyzer is impossible without constant testing of it. We use 7 various testing techniques in the development of PVS-Studio:
This article was written in order to promote the methodology of static analysis. I think that readers might be interested to know not just about the results of the analyzer work, but also about the inner workings. I'll try writing articles on this topic from time to time.
Additionally, we plan to take part in various programming events, such as conferences and seminars. We will be glad to receive invitations to various events, especially those that are in Moscow and St. Petersburg. For example, if there is a programmer meeting in your institute or a company, where people share their experience, we can come and make a report on an interesting topic. For instance, about modern C++; or about the way we develop analyzers, about typical errors of programmers and how to avoid them by adding a coding standard, and so on. Please, send the invitations to my e-mail: karpov [@] viva64.com.
Finally, here are some links:
0