It seemed that long forum debates about methods of measuring algorithm's running time, functions to use and precision that should be expected were over. Unfortunately, we have to return to this question once again. Today we will discuss the question how we should measure speed of a parallel algorithm.
I want to say right away that I will not give you a concrete recipe. I myself have faced the issue of measuring parallel algorithms' speed only recently, so I am not an expert in this question. So, this post is rather a research article. I will appreciate if you share your opinions and recommendations with me. I think we will manage the problem together and make out an optimal solution.
The task is to measure the running time of a fragment of user code. I would use the following class to solve this task earlier:
class Timing {
public:
  void StartTiming();
  void StopTiming();
  double GetUserSeconds() const {
    return double(m_userTime) / 10000000.0;
  }
private:
  __int64 GetUserTime() const;
  __int64 m_userTime;
};

__int64 Timing::GetUserTime() const {
  FILETIME creationTime;
  FILETIME exitTime;
  FILETIME kernelTime;
  FILETIME userTime;
  GetThreadTimes(GetCurrentThread(),
                 &creationTime, &exitTime,
                 &kernelTime, &userTime);
  __int64 curTime;
  curTime = userTime.dwHighDateTime;
  curTime <<= 32;
  curTime += userTime.dwLowDateTime;
  return curTime;
}

void Timing::StartTiming() {
  m_userTime = GetUserTime();
}

void Timing::StopTiming() {
  __int64 curUserTime = GetUserTime();
  m_userTime = curUserTime - m_userTime;
}
This class is based on the GetThreadTimes function that allows you to separate running time of user code from running time of system functions. The class is intended for estimate of running time of a thread in user mode, so we use only the returned parameter lpUserTime.
Now consider a code sample where some number is calculated. We will use the Timing class to measure the running time.
void UseTiming1()
{
  Timing t;
  t.StartTiming();
  unsigned sum = 0;

  for (int i = 0; i < 1000000; i++)
  {
    char str[1000];
    for (int j = 0; j < 999; j++)
      str[j] = char(((i + j) % 254) + 1);
    str[999] = 0;
    for (char c = 'a'; c <= 'z'; c++)
      if (strchr(str, c) != NULL)
        sum += 1;
  }

  t.StopTiming();
  printf("sum = %u\n", sum);
  printf("%.3G seconds.\n", t.GetUserSeconds());
}
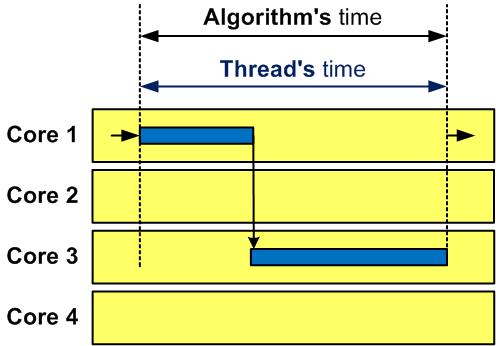
Being presented in this form, the timing mechanism behaves as it was expected and gives, say, 7 seconds on my machine. The result is correct even for a multi-core machine since it does not matter which cores will be used while the algorithm is running (see Figure 1).

Figure 1 - Work of one thread on a multi-core computer
Now imagine that we want to use capabilities of multi-core processors in our program and estimate benefits we will get from parallelizing the algorithm relying on the OpenMP technology. Let's parallelize our code by adding one line:
#pragma omp parallel for reduction(+:sum)
for (int i = 0; i < 1000000; i++)
{
  char str[1000];
  for (int j = 0; j < 999; j++)
    str[j] = char(((i + j) % 254) + 1);
  str[999] = 0;
  for (char c = 'a'; c <= 'z'; c++)
    if (strchr(str, c) != NULL)
      sum += 1;
}
The program now prints the running time 1.6 seconds. Since we use a 4-core computer, I feel like saying "Hurray! We've got a 4-time speed-up and timing confirms this".
But really it is not so good: we are not measuring the running time of the algorithm. We are measuring the running time of the main thread instead. In this case, the measuring seems reliable because the main thread was working for the same time as the secondary threads. Let's carry out a simple experiment: we will explicitly specify 10 threads to be used instead of 4:
#pragma omp parallel for reduction(+:sum) num_threads(10)Logic says that this code must work for about the same time as the code parallelized into 4 threads. We have a four-core processor, so we should expect that a larger number of threads will cause only slowdown. Instead, we will see the result about 0.7 seconds.
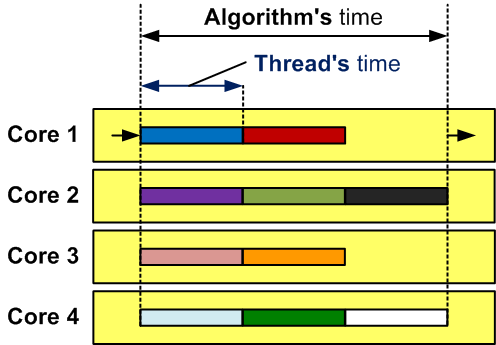
This is an expected result although we wanted to get quite a different thing. We created 10 threads. Each of them was working for about 0.7 seconds. It is time of the main thread, whose running time is measured with the Timing class, ran for. As you can see, this method cannot be used to measure speed of programs with parallel code fragments. Let's make it clearer by presenting it graphically in Figure 2.

Figure 2 - This is how work of 10 threads might look on a four-core computer
Of course, we may well use the time() function but its resolution is low and it will not allow you to separate the running time of user code from that of system code. There may be other processes influencing the time, which may also significantly distort timing.
A favorite timing function of many developers is QueryPerformanceCounter. Let's measure speed using this function. In a simple form, the timing class looks this way:
class Timing2 {
public:
  void StartTiming();
  void StopTiming();
  double GetUserSeconds() const {
    return value;
  }
private:
  double value;
  LARGE_INTEGER time1;
};

void Timing2::StartTiming()
{
  QueryPerformanceCounter(&time1);
}

void Timing2::StopTiming()
{
  LARGE_INTEGER performance_frequency, time2;
  QueryPerformanceFrequency(&performance_frequency);
  QueryPerformanceCounter(&time2);
  value = (double)(time2.QuadPart - time1.QuadPart);
  value /= performance_frequency.QuadPart;
}
Unfortunately, we cannot do so on a multi-core computer anymore. :) Let's read the description of this function in MSDN:
On a multiprocessor computer, it should not matter which processor is called. However, you can get different results on different processors due to bugs in the basic input/output system (BIOS) or the hardware abstraction layer (HAL). To specify processor affinity for a thread, use the SetThreadAffinityMask function.
Let's improve the code and tie the main thread to one core:
class Timing2 {
public:
  void StartTiming();
  void StopTiming();
  double GetUserSeconds() const {
    return value;
  }
private:
  DWORD_PTR oldmask;
  double value;
  LARGE_INTEGER time1;
};

void Timing2::StartTiming()
{
  volatile int warmingUp = 1;
  #pragma omp parallel for
  for (int i=1; i<10000000; i++)
  {
    #pragma omp atomic
    warmingUp *= i;
  }

  oldmask = SetThreadAffinityMask(::GetCurrentThread(), 1);

  QueryPerformanceCounter(&time1);
}

void Timing2::StopTiming()
{
  LARGE_INTEGER performance_frequency, time2;
  QueryPerformanceFrequency(&performance_frequency);
  QueryPerformanceCounter(&time2);
  SetThreadAffinityMask(::GetCurrentThread(), oldmask);

  value = (double)(time2.QuadPart - time1.QuadPart);
  value /= performance_frequency.QuadPart;
}
Readers might ask what for we need a strange loop that does nothing. Contemporary processors reduce their frequency at low load. This loop preliminarily increases the processor's speed to the maximum and therefore increases the precision of speed measurement a bit. Additionally, we are warming up all the available cores.
The timing method we have shown involves the same drawback: we cannot separate the running time of user code from that of system code. If there are other tasks running on a core at the same time, the result might also be rather inaccurate. But it seems to me that this method still can be applied to a parallel algorithm unlike GetThreadTimes.
Let's measure the results of Timing and Timing2 classes at various numbers of threads. For this purpose, the OpenMP-directive num_threads(N) is used. Let's arrange the data in a table shown in Figure 3.

Figure 3 - Algorithm's running time in seconds measured with functions GetThreadTimes and QueryPerformanceCounter on a four-core machine
As you may see, as long as the number of threads does not exceed the number of cores, the GetThreadTimes function gives us a result similar to that of the QueryPerformanceCounter function, which makes you think that measurement is correct. But if there are more threads, you cannot rely on its result.
Unfortunately, the program prints varying values from launch to launch. I do not know how to make measuring more accurate and correct. So I am waiting for your feedback and methods of correct timing of parallel algorithms.
You may download the program text here (a project for Visual Studio 2005).
0