
Our website uses cookies to enhance your browsing experience.


The task of familiarizing programmers with the sphere of developing parallel applications is getting more and more urgent. This article is a brief introduction into creation of multi-thread applications based on OpenMP technology. The approaches to debugging and optimization of parallel applications are described.
VivaMP support had been canceled in the year 2014. If you have any questions, feel free to contact our support.
In this article we discuss OpenMP technology whose main value is the possibility of improving and optimizing the already created code. OpenMP standard is a set of specifications for paralleling code in an environment with shared memory. OpenMP can be used if this standard is supported by the compiler. Besides, you need absolutely new tools for the debugging stage when errors are detected, localized and corrected and optimization is performed.
A debugger for sequential code is a tool which a programmer knows very well and uses very often. It allows you to trace changes of variables' values when debugging a program in single-stepping mode with the help of advanced user interface. But in case of debugging and testing of multi-thread applications everything is different, in particular creation of multi-thread applications becomes the main area in creating effective applications.
Debugging of a sequential program is based on that the level of predictability of initial and current program's states is determined by the input data. When a programmer debugs multi-thread code he usually faces absolutely unique problems: in different operation systems different planning strategies are used, the computer system's load changes dynamically, processes' priorities can be different etc. Precise reconstruction of the program's state at a certain moment of its execution (a trivial thing for sequential debugging) is very difficult in case of a parallel program because of its undetermined behavior. In other words, behavior of processes launched in the system, in particular their execution and waiting for execution, deadlocks and the like, depends on random events occurring in the system. What to do? It is obvious that we need absolutely different means for debugging parallel code.
As parallel computer systems have become a common thing on consumer market, demand for means of debugging multi-thread applications has increased greatly. We will consider debugging and increase of performance of a multi-thread application based on OpenMP technology. The full program text, separate fragments from which we will consider further, is given in Appendix 1 at the end of the article.
Let's consider sequential code of 'Function' function given in Listing 1 as an example. This simple subprogram calculates values of some mathematical function with one argument.
double Function(int N)
{
  double x, y, s=0;
  for (int i=1; i<=N; i++) {
    x = (double)i/N;
    y = x;
    for (int j=1; j<=N; j++) {
      s += j * y;
      y = y * x;
    };
  };
  return s;
}
When calling this function with N argument equal 15000, we'll get 287305025.528.
This function can be easily paralleled with the help of OpenMP standard's means. Let's add only one string before the first operator for (Listing 2).
double FunctionOpenMP(int N)
{
  double x, y, s=0;
  #pragma omp parallel for num_threads(2)
  for (int i=1; i<=N; i++) {
    x = (double)i/N;
    y = x;
    for (int j=1; j<=N; j++) {
      s += j * y;
      y = y * x;
    };
  };
  return s;
}
Unfortunately, the code we've created is incorrect and the result of the function is in general undefined. For example, it can be 298441282.231. Let's consider possible causes.
The main cause of errors in parallel programs is incorrect work with shared resources, i.e. resources common for all launched processes, and in particular - with shared variables.
This program is successfully compiled in Microsoft Visual Studio 2005 environment and the compiler even doesn't show any warning messages. However it is incorrect. To understand this you should recall that variables in OpenMP-programs are divided into shared, existing as single copies and available for all the threads, and private, localized in a concrete process. Besides, there is a rule saying that by default all the variables in parallel regions of OpenMP are shared save for parallel loops' indexes and variables defined inside these parallel regions.
From the example above it is obvious that x, y and s variables are shared what it absolutely incorrect. s variable should be shared as it is the adder in the given algorithm. But when working with x or y each process calculates their next value and writes it into the corresponding variable (x or y). And in this case the result depends on the sequence of executing the parallel threads. In other words, if the first thread calculates x value, writes it into x variable and after the same operations are performed by the second thread, tries to read the value of x variable it will get the value written into it by the last thread, i.e. the second one. Such errors, when program operation depends on the sequence of executing different code sections, are called race condition or data race ("race" condition or "race" of computing threads; it means that unsynchronized memory accesses occur).
To search such errors we need special program means. One of them is Intel Thread Checker. This program is provided as a module for Intel VTune Performance Analyzer profiler adding to already existing means for working with multi-thread code. Intel Thread Checker allows you to detect both the errors described above and many other defects, for example, deadlocks (points of mutual lock of computational threads) and memory leaks.
When Intel Thread Checker is installed, a new project category will appear in New Project dialog of Intel VTune Performance Analyzer application - Threading Wizards (wizards for working with threads), among which there will be Intel Thread Checker Wizard. To launch an example, you should select it and point the path to the executed program in the next wizard's window. The program will be executed and the profiler will collect all data about the application's operation. An example of such information provided by Intel Thread Checker is shown on Figure 1.
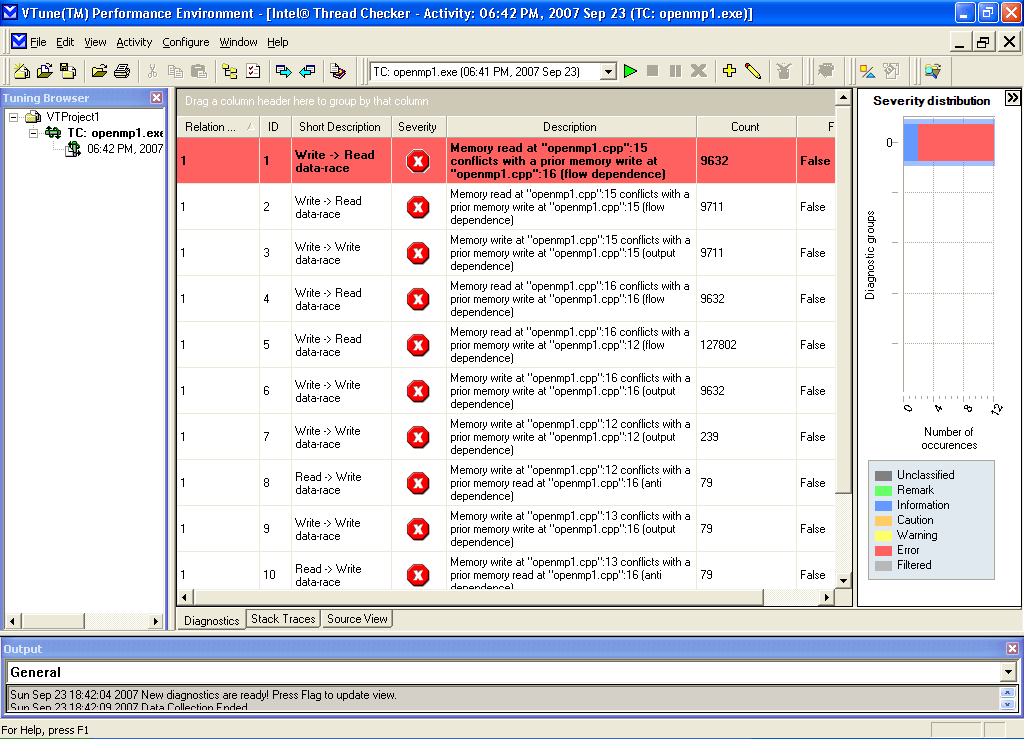
Figure 1 - a lot of critical errors were detected during Thread Checker's operation
As we see, the number of errors is large even for such a small program. Thread Checker groups the detected errors simultaneously estimating how critical they are for program operation and provides their description increasing the programmer's labor effectiveness. Besides, on Source View inlay there is program code of the application where the sections with the errors are marked (Figure 2).

Figure 2 - Analysis of multi-thread code by Intel Thread Checker
We should mention that Intel Thread Checker cannot detect errors in some cases. This occurs when the code rarely gets control or is executed on a system with a different architecture. Errors can be also missed when the set of input text data differs greatly from the data processed by the program when used by end users. All this doesn't allow us to be sure that there are no errors in a multi-thread program when it is tested by dynamic analysis means the results of which depend on the environment and time of its execution.
But there is another tool and it is good news for OpenMP developers. This tool is VivaMP offering an alternative approach to verifying parallel programs. VivaMP is built according the principle of static code analyzer and allows you to test the application code without launching it. To learn more about VivaMP tool visit the developers' site.
VivaMP's scopes of use:
VivaMP analyzer integrates into Visual Studio 2005/2008 environment and provides simple interface for testing applications (Figure 3).
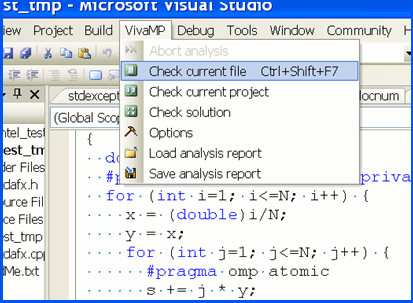
Figure 3 - Launch of VivaMP tool, integrated into Visual Studio 2005
If we launch VivaMP for our example we'll get a message about errors in 4 different strings where incorrect modification of variables occurs (Figure 4).
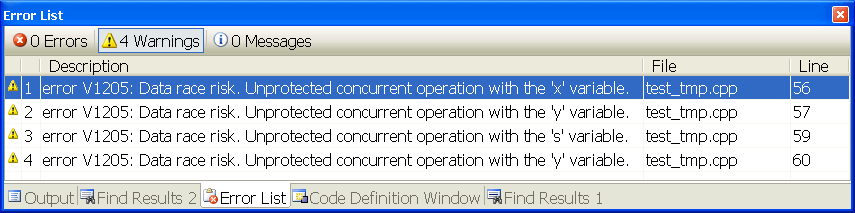
Figure 4 - The result of VivaMP static analyzer's operation
Of course, static analysis also has some disadvantages as well as dynamic analysis. But being used together these methodologies (Intel Thread Checker and VivaMP tools) supplement each other very well. And used together they serve rather a safe method of detecting errors in multi-thread applications.
The above described error of writing into x and y variables detected by Intel Thread Checker and VivaMP tools can be easily corrected: you only need to add one more directive into '#pragma omp parallel for' construction: private (x, y). Thus, these two variables will be defined as private and there will be separate copies of x and y in each computational thread. But you should also keep in mind that all the threads save the calculated result by adding it to s variable. Such errors occur when one computational thread tries to write some value into shared memory and simultaneously the second thread performs reading. In the given example it can lead to an incorrect result.
Let's consider s += j*y instruction. Originally it is suggested that each thread add the calculated result to the current value of s variable and then the same operations are executed by all the other threads. But in some cases the two threads begin to execute s += j*y instruction simultaneously, that is each of them first reads the current value of s variable, then adds the result of j*y multiplication to this value and writes the final result into s variable.
Unlike reading operation which can be implemented in parallel mode and is quite quick, the writing operation is always sequential. Consequently, if the first thread writes the new value first, the second thread, having performed the writing operation after that, will erase the result of the first thread's calculations because the both computational threads read one and the same value of s variable and begin to write their data into it. In other words, the value of s variable which will be written into shared memory by the second thread doesn't consider the results of calculations performed by the first thread at all. You can avoid such a situation by making sure that at any moment only one thread is allowed to execute s += j*y operation. Such operations are called indivisible or atomic. When we need to point the compiler that some instruction is atomic we use #pragma omp atomic construction. The program code in which the described operations are corrected is shown in Listing 3.
double FixedFunctionOpenMP(int N)
{
  double x, y, s=0;
  #pragma omp parallel for \
          private(x,y) num_threads(2)
  for (int i=1; i<=N; i++) {
    x = (double)i/N;
    y = x;
    for (int j=1; j<=N; j++) {
      #pragma omp atomic
      s += j * y;
      y = y * x;
    };
  };
  return s;
}
Having recompiled the program and analyzed it once again in Thread Checker, we'll see that it doesn't contain critical errors. Only two messages are shown telling that the parallel threads end when reaching return operator in MathFunction function. In the given example it is alright because only the code inside this function is paralleled. VivaMP static analyzer won't show any messages on this code at all as it is absolutely correct from its viewpoint.
But some work still remains. Let's see if our code has really become more effective after paralleling. Let's measure the execution time for three functions: 1 - sequential, 2 - parallel incorrect, 3 - parallel correct. The results of this measuring for N=1500 are given in Table 1.
|
Function |
Result |
Execution time |
|---|---|---|
|
Sequential variant of the function |
287305025.528 |
0.5781 seconds |
|
Incorrect variant of the parallel function |
298441282.231 |
2.9531 seconds |
|
Correct variant of the parallel function using atomic directive |
287305025.528 |
36.8281 seconds |
Table 1 - Results of functions' operation
What do we see in the table? The parallel variant of the incorrect function works slower in several times. But we are not interested in this function. The problem is that the correct variant works even more than 60 times slower. Do we need such parallelism? Of course not.
The reason is that we have chosen a very ineffective method of solving the problem of summing the result in s variable by using atomic directive. This approach leads to that the threads wait for each other very often. To avoid constant deadlocks when executing atomic summing operation we can use the special directive reduction. reduction option defines that the variable will get the combined value at the exit from the parallel block. The following operations are permissible: +, *, -, &, |, ^, &&, ||. The modified variant of the function is shown in Listing 4.
double OptimizedFunction(int N)
{
  double x, y, s=0;
  #pragma omp parallel for private(x,y) \
          num_threads(2) reduction(+: s)
  for (int i=1; i<=N; i++) {
    x = (double)i/N;
    y = x;
    for (int j=1; j<=N; j++) {
      s += j * y;
      y = y * x;
    };
  };
  return s;
}
In this case we'll get the function's variant not only correct but of higher performance as well (Table 2). The speed of calculations has almost doubled (more exactly, it has increased in 1.85 times) what is a good result for such functions.
|
Function |
Result |
Execution time |
|---|---|---|
|
Sequential variant of the function |
287305025.528 |
0.5781 seconds |
|
Incorrect variant of the parallel function |
298441282.231 |
2.9531 seconds |
|
Correct variant of the parallel function using atomic directive |
287305025.528 |
36.8281 seconds |
|
Correct variant of the parallel function using reduction directive |
287305025.528 |
0.3125 seconds |
Table 2 - Results of functions' operation
In conclusion I would like to point out once again that an operable parallel program not always can be effective. And although parallel programming provides many ways to increase code effectiveness it demands attention and good knowledge of the used technologies from the programmer. Fortunately, there exist such tools as Intel Thread Checker and VivaMP which greatly simplify creation and testing of multi-thread applications. Dear readers, I wish you good luck in mastering the new field of knowledge!
#include "stdafx.h"
#include <omp.h>
#include <stdlib.h>
#include <windows.h>
class VivaMeteringTimeStruct {
public:
  VivaMeteringTimeStruct()
    { m_userTime = GetCurrentUserTime(); }
  ~VivaMeteringTimeStruct()
    { printf("Time = %.4f seconds\n", GetUserSeconds()); }
  double GetUserSeconds();
private:
  __int64 GetCurrentUserTime() const;
  __int64 m_userTime;
};
__int64 VivaMeteringTimeStruct::GetCurrentUserTime() const
{
  FILETIME creationTime, exitTime, kernelTime, userTime;
  GetThreadTimes(GetCurrentThread(), &creationTime,
                 &exitTime, &kernelTime, &userTime);
  __int64 curTime;
  curTime = userTime.dwHighDateTime;
  curTime <<= 32;
  curTime += userTime.dwLowDateTime;
  return curTime;
}
double VivaMeteringTimeStruct::GetUserSeconds()
{
  __int64 delta = GetCurrentUserTime() - m_userTime;
  return double(delta) / 10000000.0;
}
double Function(int N)
{
  double x, y, s=0;
  for (int i=1; i<=N; i++) {
    x = (double)i/N;
    y = x;
    for (int j=1; j<=N; j++) {
      s += j * y;
      y = y * x;
    };
  };
  return s;
}
double FunctionOpenMP(int N)
{
  double x, y, s=0;
  #pragma omp parallel for num_threads(2)
  for (int i=1; i<=N; i++) {
    x = (double)i/N;
    y = x;
    for (int j=1; j<=N; j++) {
      s += j * y;
      y = y * x;
    };
  };
  return s;
}
double FixedFunctionOpenMP(int N)
{
  double x, y, s=0;
  #pragma omp parallel for private(x,y) num_threads(2)
  for (int i=1; i<=N; i++) {
    x = (double)i/N;
    y = x;
    for (int j=1; j<=N; j++) {
      #pragma omp atomic
      s += j * y;
      y = y * x;
    };
  };
  return s;
}
double OptimizedFunction(int N)
{
  double x, y, s=0;
  #pragma omp parallel for private(x,y) \
          num_threads(2) reduction(+: s)
  for (int i=1; i<=N; i++) {
    x = (double)i/N;
    y = x;
    for (int j=1; j<=N; j++) {
      s += j * y;
      y = y * x;
    };
  };
  return s;
}
int _tmain(int , _TCHAR* [])
{
  int N = 15000;
  {
    VivaMeteringTimeStruct Timer;
    printf("Result = %.3f  ", Function(N));
  }
  {
    VivaMeteringTimeStruct Timer;
    printf("Result = %.3f  ", FunctionOpenMP(N));
  }
  {
    VivaMeteringTimeStruct Timer;
    printf("Result = %.3f  ", FixedFunctionOpenMP(N));
  }
  {
    VivaMeteringTimeStruct Timer;
    printf("Result = %.3f  ", OptimizedFunction(N));
  }
  return 0;
}
0
0
0
0