
Our website uses cookies to enhance your browsing experience.

How to simplify the process of bug fixing and prevent vulnerable code from being released? Use quality control tools. We will use PVS-Studio to search for errors and vulnerabilities, and DefectDojo will help us handling a report. In this article, we are going to discuss how to use these tools together.
PVS‑Studio is a static code analyzer that finds errors and potential vulnerabilities in projects written in C, C++, C#, and Java.
DefectDojo is a DevSecOps system for tracking errors and vulnerabilities. It provides features for handling reports, including the ability to memorize false positives and delete duplicate warnings. DefectDojo can integrate with JIRA, saves metrics, and builds graphs of their changes.
With the new PVS-Studio report format for DefectDojo, you can take full advantage of the platform's features when handling analysis results and managing the error fixing process.
You can get the PVS-Studio installer and a trial key here. The installation process for different environments is described in the documentation:
You can install DefectDojo in several ways: for example, use a Docker image, obtain it as a SaaS, or deploy it locally. Visit this page if you want to learn more about installation methods.
Let's see how to install DefectDojo using docker-compose.yml.
To do this, we need at least Docker 19.03.0 and Docker Compose 1.28.0.
First, we are going to clone the DefectDojo GitHub repository.
git clone https://github.com/DefectDojo/django-DefectDojo.gitAfter that, go to the django-DefectDojo directory and run the Docker image build. To run docker-compose, add the '--profile' and '--env-file' parameters.
In this case, I use a combination of PostgreSQL and RabbitMQ. The docker-compose run command looks like this:
docker-compose --profile postgres-rabbitmq ^
  --env-file .\docker\enviroment\postgres-rabbitmq.env up
Once the containers are started, you can access DefectDojo from an administrator account. To get the administrator password, use one of the following commands:
docker-compose logs initializer | grep "Admin password:"or
docker-compose logs initializer | find "Admin password:"By default, DefectDojo is deployed on port 8080. You can change it in the docker-compose.yml file.
In order for the PVS-Studio report to operate properly in DefectDojo, we need to edit the 'local_settings.py' file. In our case, this file should be located in the /docker/extra_settings/ directory. In 'local_settings.py', add the following line:
HASHCODE_FIELDS_PER_SCANNER=
{"PVS-Studio Scan (Generic Findings Import)":["unique_id_from_tool"]}.
Enabling this setting helps DefectDojo to understand which field in the report to use for identifying duplicate messages.
You also need to enable 'False positive history' in the DefectDojo settings. It ensures that information about false positives is retained between reports.
Now that DefectDojo is deployed, it needs to be configured to work with projects and reports. We are using the COVID-19 CovidSim Model, an open-source project written in C++, to test if everything works properly.
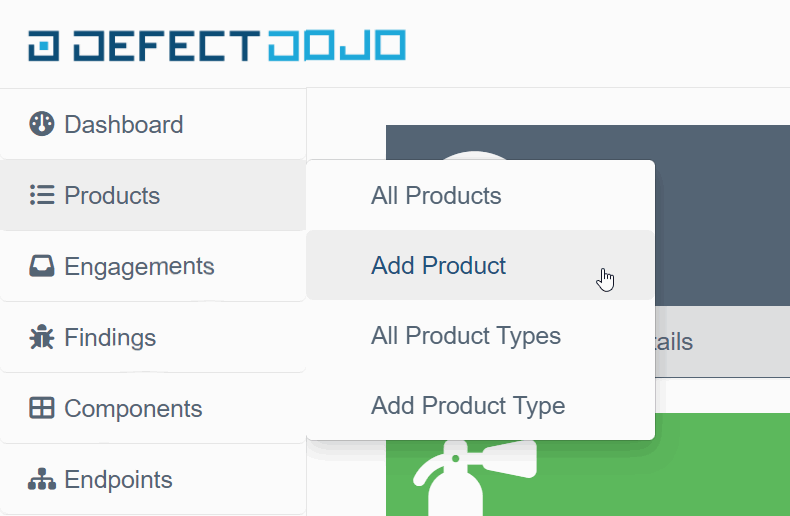
First, create a Product in DefectDojo: 'Products'->'Add Product'.
Then, fill out the project information. For the test, I filled in only the mandatory fields and transferred the project description from its GitHub repository.
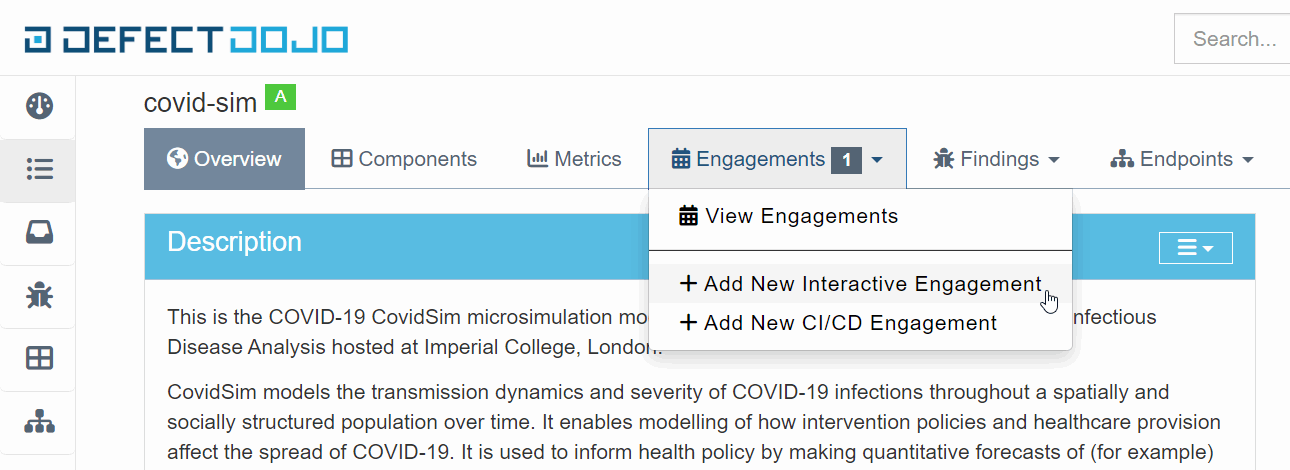
Now add a new engagement to the created Product. It's the main entity into which the analyzer report will be loaded. We are going to work with it.
There are two kinds of engagements in DefectDojo: Interactive and CI/CD. You can also transfer information from the CI/CD system, such as the build number, to the second one. This choice doesn't affect the report handling.
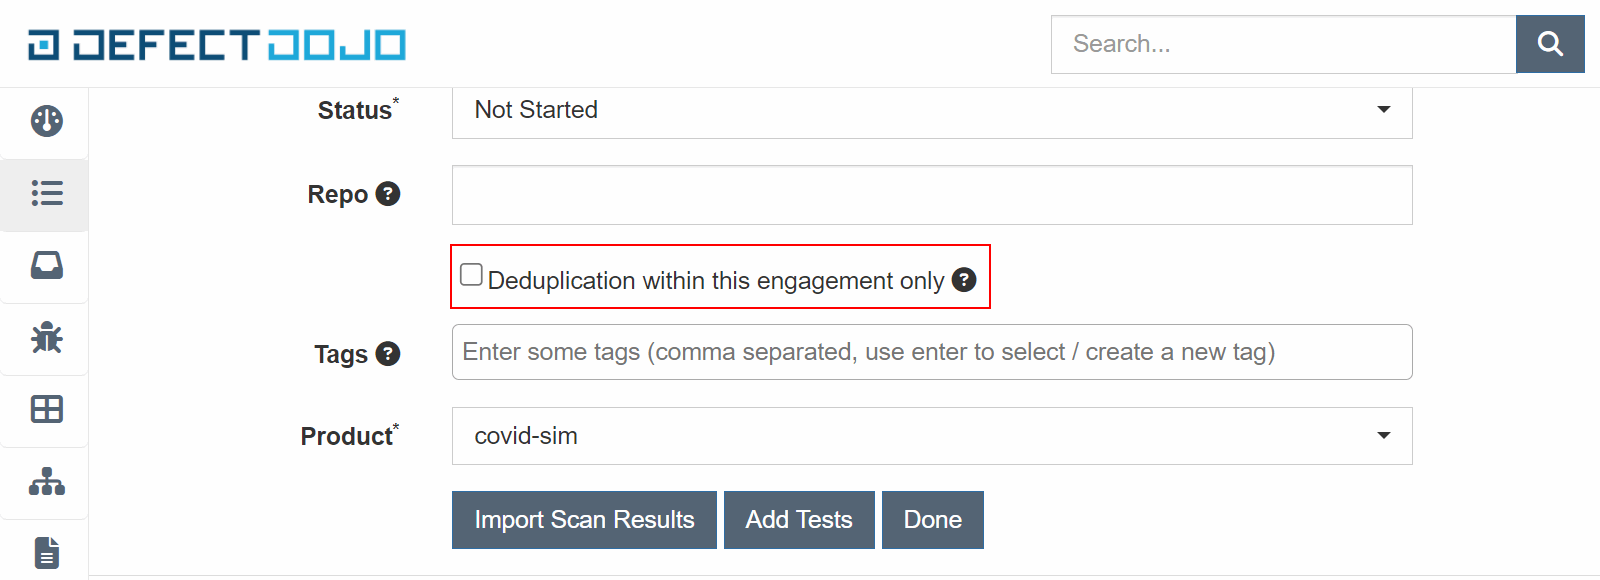
It's worth mentioning that there are several options for handling the analysis results. One of them is creating a new engagement for each new report. In this case, make sure that the 'Deduplication within this engagement only' setting is disabled. If you leave it enabled, the information about warnings that have already been marked will disappear when a new report is uploaded.
In this example, I am uploading all reports to one engagement. DefectDojo is a flexible tool, it allows you to customize the workflow to your needs.
To automate the process of checking and uploading a report to DefectDojo, I created a small Jenkins task. Let's take a closer look.
The first step is to deploy the covid-sim project and a Python helper script to Jenkins. To do this, let's add the following steps to the pipeline:
stage('Checkout'){
  steps{
    dir('defectdojo'){
      checkout([
        $class: 'GitSCM',
        branches: [[name: 'main']],
        userRemoteConfigs:
   [[url: 'https://github.com/viva64/DefectDojo-QualityGate.git']]
      ])
    }
    dir('covid-sim'){
      checkout([
        $class: 'GitSCM',
        branches: [[name: 'master']],
        userRemoteConfigs: [[url: 'https://github.com/mrc-ide/covid-sim.git']]
      ])
    }
  }
}
The next step is to run the project check. Let's add the following step to the script:
stage('Analyze'){
  steps{
    dir('covid-sim'){
      bat"""
        PVS-Studio_Cmd.exe -t covid-sim.sln
        IF %ERRORLEVEL% == 256 SET /A \"ERRORLEVEL=0\"
        EXIT /B %ERRORLEVEL%
      """
    }
  }
}Note. The analysis may run differently depending on the operating system and the programming language of the project being analyzed. You can consult the PVS‑Studio documentation to find the guidelines on how to run the analysis specifically for your case.
The exit code 256 of the PVS-Studio_Cmd.exe utility indicates that potential errors have been detected in the project. This step will create the 'covid-sim.plog' report in the project directory.
After the report is received, we need to convert it to a special format. Let's add a conversion step to our pipeline:
stage('Convert'){
  steps{
    dir('covid-sim'){
      bat """
        PlogConverter.exe -t DefectDojo -a GA:1,2,3 covid-sim.plog
      """
    }
  }
}
The command uses the following parameters:
The DefectDojo format is available in PlogConverter that comes with PVS-Studio 7.26. You can learn more about the conversion utility in the documentation.
This step will create the 'covid-sim.plog.defectdojo.json' report. That's what we need to upload to DefectDojo. To make it possible, let's add the following step to the pipeline:
stage('Upload report'){
  steps{
    dir('covid-sim'){
      bat"""
        curl -X POST ^
        -H Authorization:"Token 44ac826dc4f3b6add1161dab11b49402618efaba" ^
        -F scan_type="Generic Findings Import" ^
        -F file=@covid-sim.plog.defectdojo.json ^
        -F engagement=6 ^
        -H Content-Type:multipart/form-data ^
        -H accept:application/json ^
        http://localhost:8080/api/v2/import-scan/
      """
    }
  }
}
Specify the path to the report in the 'file' parameter. In the 'engagement' parameter, specify the number of the engagement to which the report will be loaded.
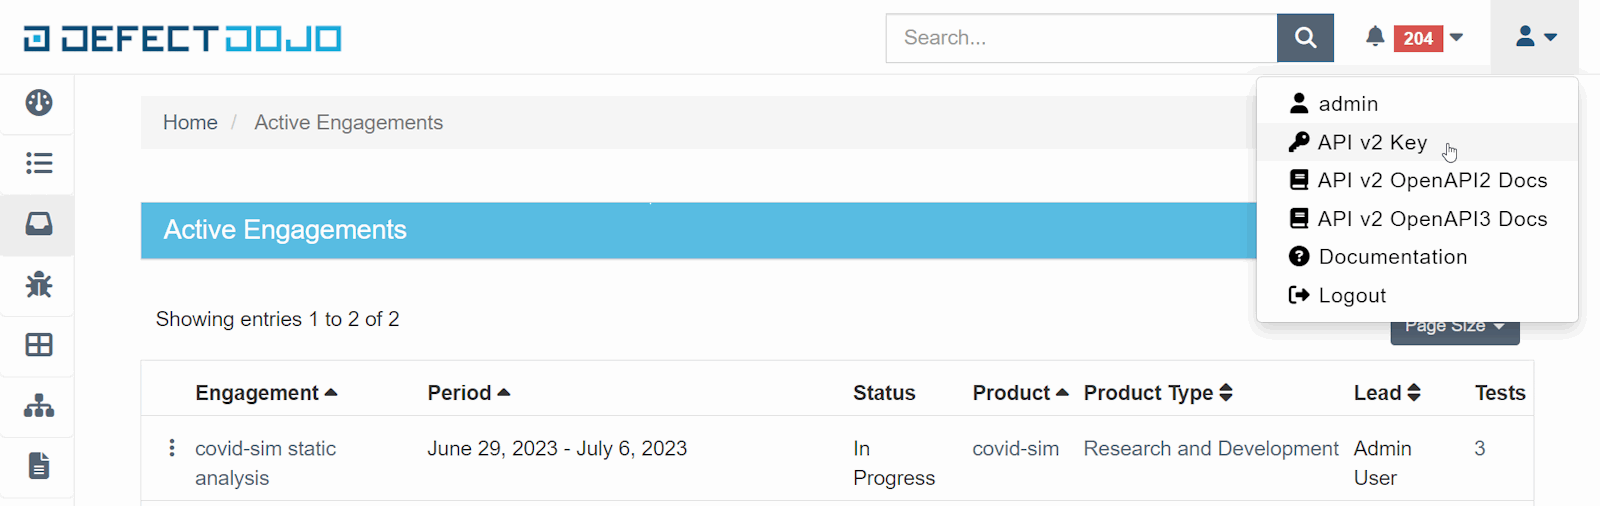
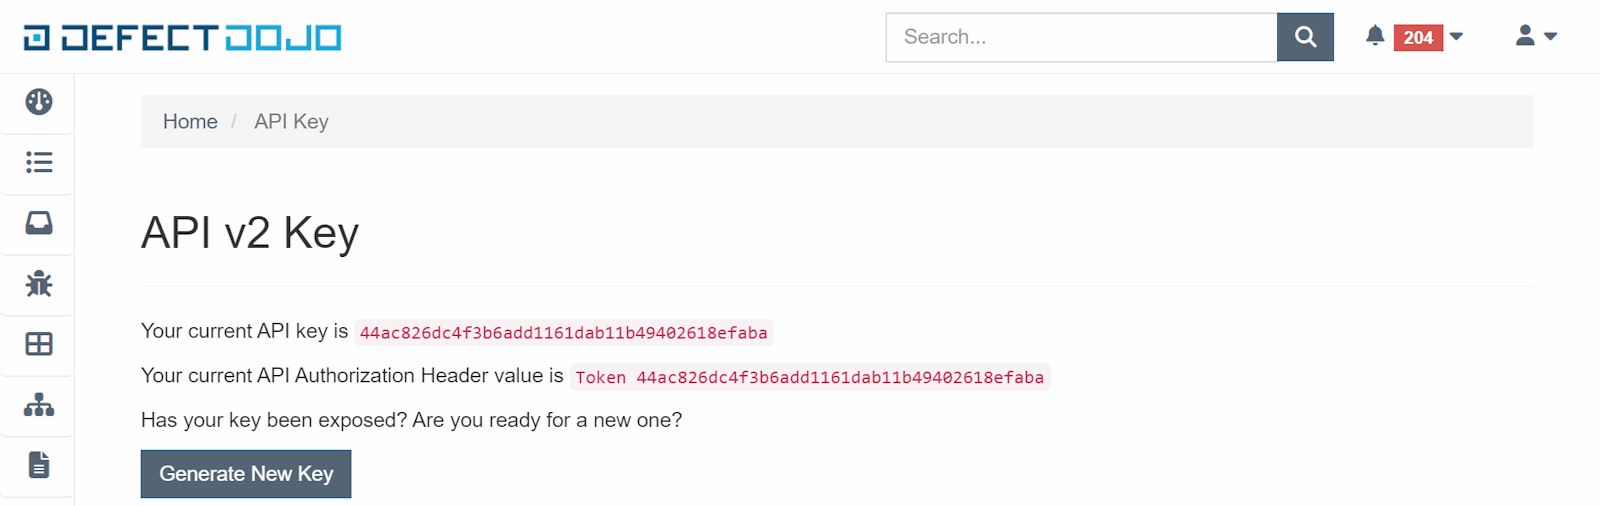
The token for this command can be obtained from the API v2 Key page.
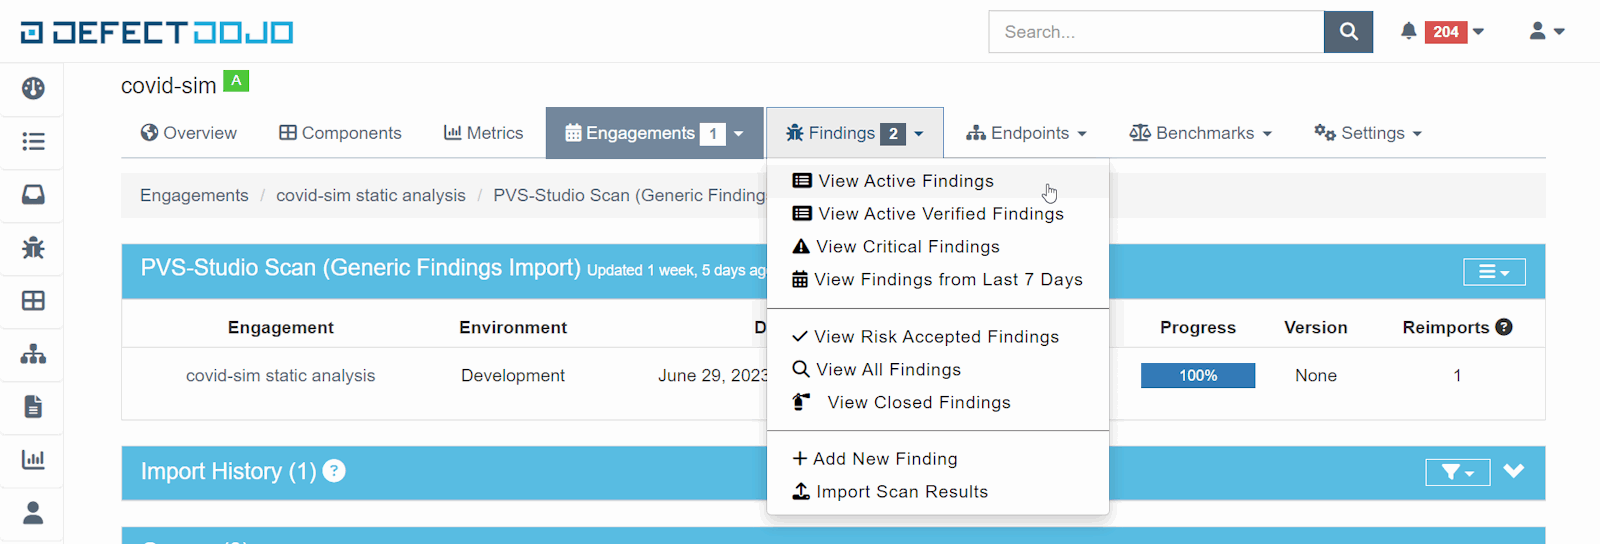
Upon completion of the previous step, the report should appear in the specified engagement.
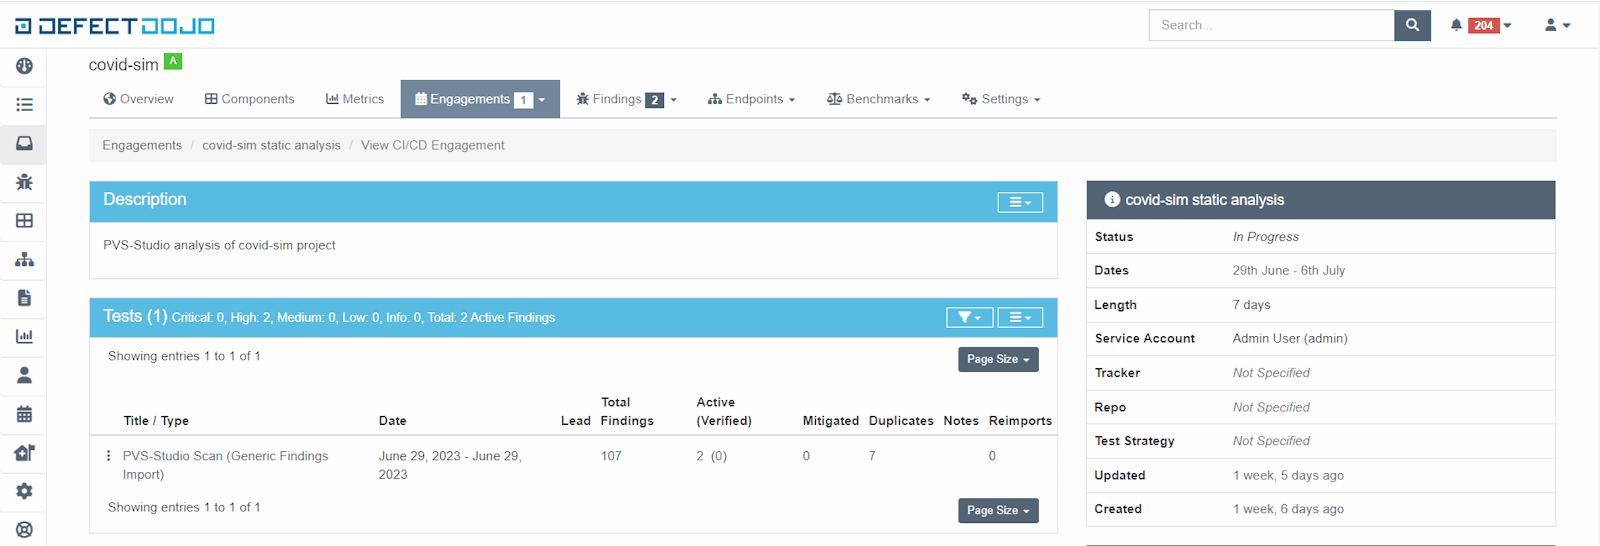
The last uploaded report is the first in the list (if there are no other types of reports in the engagement). Click the report to open a page with a list of analyzer warnings.
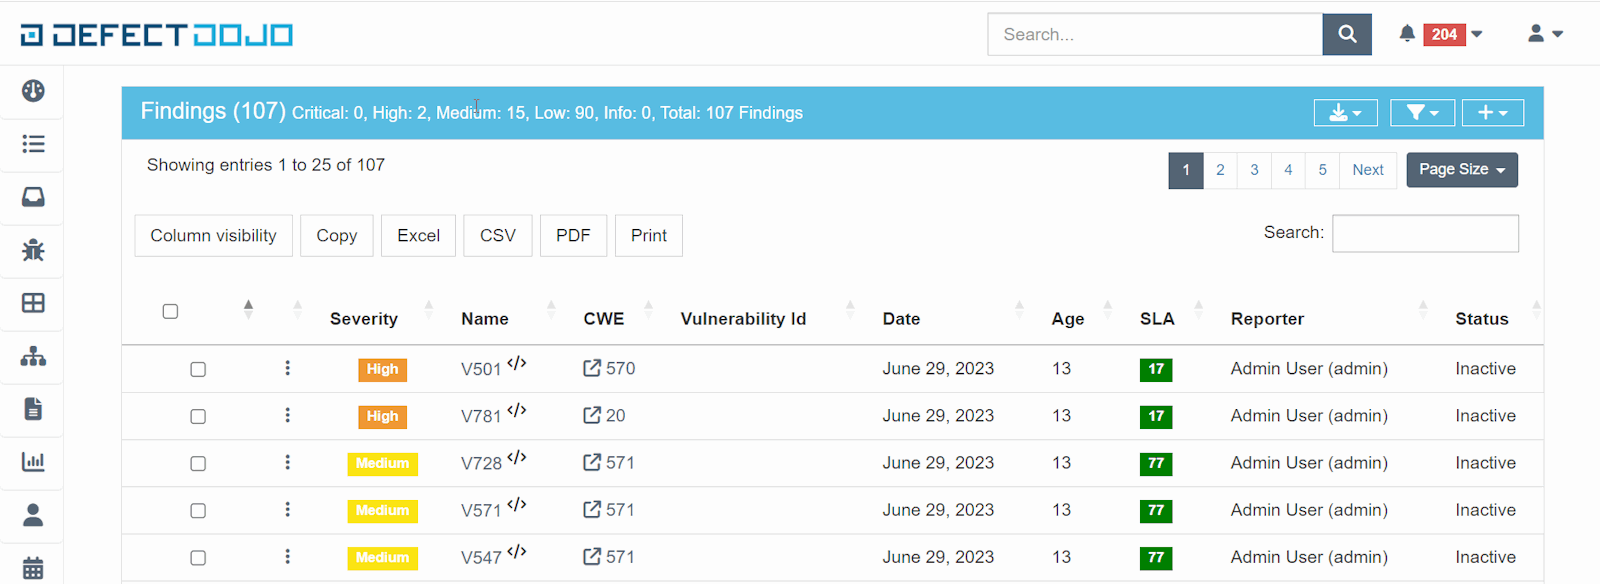
DefectDojo supports filtering and sorting warnings by various parameters including certainty levels, the CWE number, status, etc.
Click the 'Name' field to open a warning description.
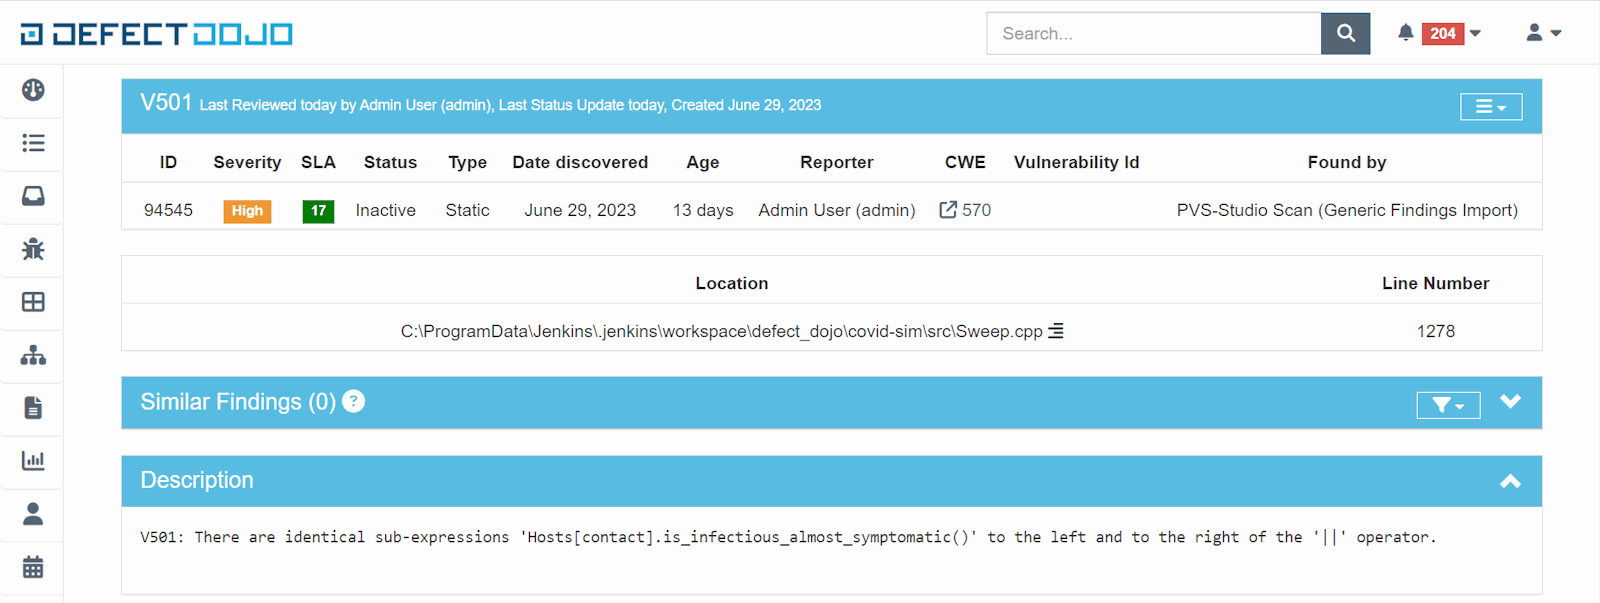
There you can find a detailed description of the error and its location.
All messages will have the 'Inactive' status once the report is uploaded. When you start working with a warning, change its status to 'Active'. You will then be able to find this message in the 'Findings' tab.
After checking the warning, mark it as either 'Verified' and 'Mitigated' if you fixed the error, or 'False Positive' if the warning was false.
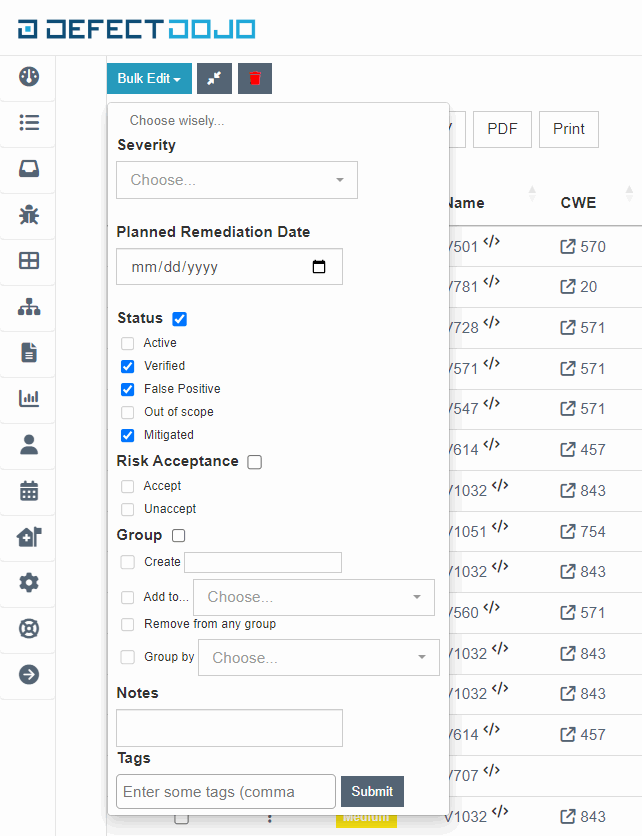
Let's label several warnings as false. The check statistics will be displayed on the engagement description page.

DefectDojo is a flexible tool that can be customized to fit your needs. This allows it to be integrated into custom processes. DefectDojo has an API that you can use to automate and customize your work. Let's look at how to implement a mechanism like Quality Gate using an API.
Quality Gate indicates whether the project's code complies with the threshold values of metrics. Code quality and code security are inseparable. Quality Gate prevents code that fails to comply with standards from being implemented.
I wrote a small Python script to implement Quality Gate. You can find and download it here. The script retrieves the latest uploaded report from the provided engagement, determines the number of warnings by certainty levels, and compares it with the reference value.
Let's add a new step to the Jenkins pipeline to automate the Quality Gate check.
stage('Quality Gate'){
  steps{
    dir('defectdojo'){
      sleep(time:10,unit:"SECONDS")
      bat """
        python ./qualitygate.py --engagement 1 ^
                         --critical 0 --high 10 ^
                         --medium 50 --low 250
      """
    }
  }
}
As we can see from the example above, the pipeline step will fail if the report contains at least one Critical warning or more than 10 High, 50 Medium, 250 Low warnings.
The delay before executing the script is necessary because we uploaded the report, and the DefectDojo server needs time to process it.
Set the DD_HOST and DD_API_TOKEN environment variables so that the script can work. To do this, add an environment block to the pipeline.
environment {
  DD_HOST = 'http://localhost:8080/'
  DD_API_TOKEN='44ac826dc4f3b6add1161dab11b49402618efaba'
}As we have seen, setting up the PVS-Studio report in DefectDojo is quite simple. This allows us to easily handle the warnings issued by the analyzer and manage their fixing.
If you have read this article and now want to use these tools together, you can download the analyzer and find out more about DefectDojo.
0
0
0

0