Our website uses cookies to enhance your browsing experience.
Accept
to the top
close form

Fill out the form in 2 simple steps below:

Your contact information:

Step 1
Congratulations! This is your promo code!

Desired license type:

Step 2
Team license
Enterprise license
** By clicking this button you agree to our Privacy Policy statement
close form
Request our prices
New License
License Renewal
--Select currency--
USD
EUR
* By clicking this button you agree to our Privacy Policy statement

close form
Free PVS‑Studio license for Microsoft MVP specialists
* By clicking this button you agree to our Privacy Policy statement

close form
To get the licence for your open-source project, please fill out this form
* By clicking this button you agree to our Privacy Policy statement

close form
I am interested to try it on the platforms:
* By clicking this button you agree to our Privacy Policy statement

close form
check circle
Message submitted.

Your message has been sent. We will email you at


If you do not see the email in your inbox, please check if it is filtered to one of the following folders:

  • Promotion
  • Updates
  • Spam

Webinar: Evaluation - 05.12

>
>
PVS-Studio: 2 features for a quick start

PVS-Studio: 2 features for a quick start

Dec 08 2022

In this note I'll share with you some tips on how to easily start using PVS-Studio. Let's explore these two use cases: when you try the analyzer for the first time and when you integrate it into your project.
1013_2Features/image1.png

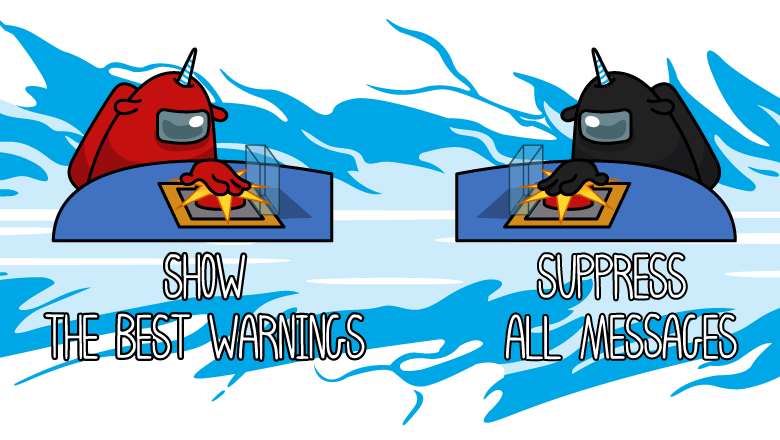
Trying PVS-Studio for the first time? View the most interesting warnings

So, what do I expect when running the analyzer on a project for the first time? Primarily, I expect the analyzer to detect some interesting errors. However, there can be two extremes:

  • The analyzer found nothing.
  • The analyzer issued too many warnings.

Let's take a look at both of these cases.

#1. You have enabled all necessary diagnostics and the analysis has completed successfully, but PVS-Studio still finds nothing? This is a good case, but it's worth noting that a single check is usually not enough.

Try to run a project analysis regularly for a period of time. As the result, the analyzer will be able to detect the issues that the team has not yet found and fixed. This way you can fully evaluate the tool's value.

I recommend you find out more on this topic in this brief note.

#2. Let's imagine a situation when the analyzer issues dozens, or even thousands of warnings. If only we could view just the interesting ones... The solution is the "Best warnings" filter. I'll explain it in a few words.

The "Best warnings" filter selects the most interesting warnings among all the other ones: these warnings should be diverse and report real errors in code.

You can enable this filter with a simple click, and immediately view a selection of the most interesting warnings. There are no more than 10 of them there.

The "Best warnings" filter is available in the "C and C++ Compiler Monitoring UI" tool, as well as in PVS-Studio plugins for:

  • Visual Studio;
  • Rider;
  • CLion;
  • IntelliJ IDEA.

We collected more information about "Best Warnings" in the documentation.

**

I'd like to answer these possible questions in advance:

  • "Best warnings" is not a new feature: it has been available since PVS-Studio 7.15. But what's new in PVS-Studio 7.22?
  • The warnings in the "Best warnings" list are not so impressive. What's the matter?

You can find the answers under the spoilers.

  • Now the filter is available not only in Visual Studio, but also in JetBrains Rider, CLion, IntelliJ IDEA, and in C and C++ Compiler Monitoring UI.
  • We changed the interface: now you can find the filter's button on the main panel. If necessary, you can hide the button via the plugin settings.
  • We adjusted the "weights" of the diagnostics to enhance their selection.

The algorithm is not perfect. Please contact us if you didn't like the list of warnings or if false positives got into it. We'll try to fix it.

If you didn't like the resulting list try looking at warnings of "High" and "Medium" levels from the analyzer's full report. You may find something interesting there.

Integrating the analyzer into the project? Disable warnings for legacy code

I decided to integrate PVS-Studio in an old project with a large amount of legacy code. I ran the analyzer and got hundreds of warnings. What's next? How can my team spot a new warning and correct an error if the total number of warnings changes from 673 to 674? The answer is — suppress warnings for legacy code.

The action algorithm is the following:

  • Hide all current warnings to make them a technical debt. Now the analyzer issues 0 warnings.
  • Monitor the new analyzer warnings. Fix them as soon as they appear. This way we control the quality and security of the code.

Use the baselining mechanism to suppress warnings for legacy code.

Summary

Making it easy to use PVS-Studio:

  • if you try the analyzer for the first time, see the most interesting warnings. The "Best warnings" filter will help you (documentation);
  • if you integrate PVS-Studio into the development process, disable warnings for legacy code. The baselining mechanism will help you (documentation).

I also recommend looking through this article. It answers many questions related to the analyzer's first start.

You can download the latest version of PVS-Studio here.

Popular related articles


Comments (0)

Next comments next comments
close comment form