
Our website uses cookies to enhance your browsing experience.

I decided to take a look at the new Intel VTune Amplifier XE 2011 beta and write an article with an example of using it. However, the emphasis was partly moved from using Amplifier to testing it while writing the article, but it's good too. I hope that Intel developers will take account of my feedback and bring modifications into the next version of the tool. And will criticize both themselves and others at all :).

I will start a bit from afar, otherwise there will be questions why I needed code that I had to optimize. While developing the static C++ code analyzer, I often encounter exotic fragments of programs. What only don't programmers invent! Even such compilers as Visual C++ or Intel C++ crash from time to time when trying to cope with some intricate stuff.
Our PVS-Studio static analyzer has one weak point related to definition of object types. For instance, we have a construct:
typedef int A;
typedef A B;
B myValue;
and we need to "resolve" the type of B to know that it's just int. There are certainly no problems with such samples and everything works right. But there are sometimes rather intricate cases. Look at this code sample demonstrating the source of various troubles:
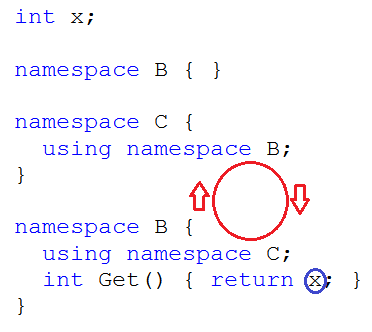
When trying to find out the type of the X variable, we will look for it in namespace B and fail to find it there. Then we will see that we should look in namespace C. But it's absent there either. Now we should go back to namespace B... Right, infinity loop. Of course, it's a simple case and there are no problems with it too. But let's add typedef, templates or derived classes. Sometimes you may get amazingly complicated things, not purposely. It is especially noticeable in code containing templates.
Unfortunately, the PVS-Studio tool sometimes entered an infinity loop at especially "lucky constructs" and committed suicide 5 minutes later to be able to go on processing of other files. This is a very rare yet unpleasant situation. Certainly we fix errors but new issues appear. And it's not always possible to find out what code the user has that causes such problems. We decided to refuse obtaining the type of some object instead of complete timer termination of the analyzer's work if an infinity loop occurs. It's better to skip one variable than a whole file.
Here occurs an interesting issue of theory and practice incompatibility. Theoretically, we should write so that there are no errors. You may even reprove us a bit: developers of a static analyzer, authors of papers where they tell how to write without errors - and they themselves can't implement correct parsing of variable types! Well, yes, we can't. And not only we. Tasks referring to C++ code compilation are extremely difficult. So we have to turn from debates about the beautiful and lofty matter to making patches just in case.
We made a simple yet effective termination mechanism. If we get a pointer to a encoded type we have processed before while obtaining an object type, the analyzer stops. At first we just created a class containing a set of pointers in std::set<const void*> *m_pGuardPointers. If the set already has a particular pointer, it means that it's time to stop.
I wasn't surprised when the program's performance dropped several times. I expected such a consequence. I even didn't measure the speed because its slow-down was obvious and the reason clear. Usually the depth of type is not large and it's just silly to use heavy artillery in such cases:
typedef long LONG;
LONG x;
We wrote right away a class of the following kind (cited in an abridged form):
class CPointerDuplacateGuard
{
  static const size_t QuickMaxSize = 10;
  const void *m_ptrs[QuickMaxSize];
  size_t m_index;
  std::set<const void*> *m_pGuardPointers;
public:
  CPointerDuplacateGuard();
  CPointerDuplacateGuard(const CPointerDuplacateGuard *parent);
  ...
};
In the beginning, we save and search for pointers in a usual array of 10 items and only then we create and begin to use the set. The situation improved much, but still it was several times slower than without this mechanism.
It was at that moment I decided that we must have a look at Intel VTune Amplifier XE 2011 beta. A very good occasion, you know. A profiler is right on the place here: it will help to answer the question if the performance drop relates only to std::set or it's because of regular checks of the pointer in itself. If the main performance drop is caused by std::set, we should increase the QuickMaxSize value. This will postpone the use of std::set for an emergency. If the reason lies in the algorithm itself, we must think further.
I want to say right away that I didn't have enough patience for making out Intel VTune Amplifier XE 2011 beta. It incredibly slows down the work. Although I have a rather powerful system (4 cores, 8 Gbytes of memory), simple moving throughout the code is performed with lags if the Intel VTune Amplifier XE 2011 beta window is opened. Note that Intel VTune Amplifier XE 2011 itself doesn't do anything. To be more exact, it loads the processor but doesn't write what its business is about. Not to sound unfounded, I attach screenshots.
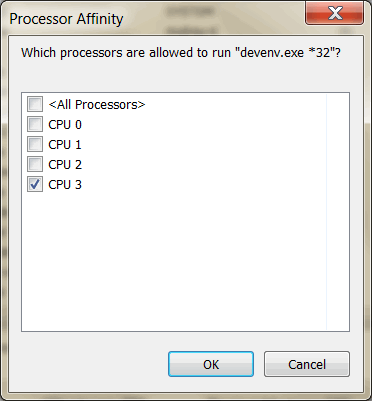
For more clarity, I assigned devenv.exe to the 4th core.
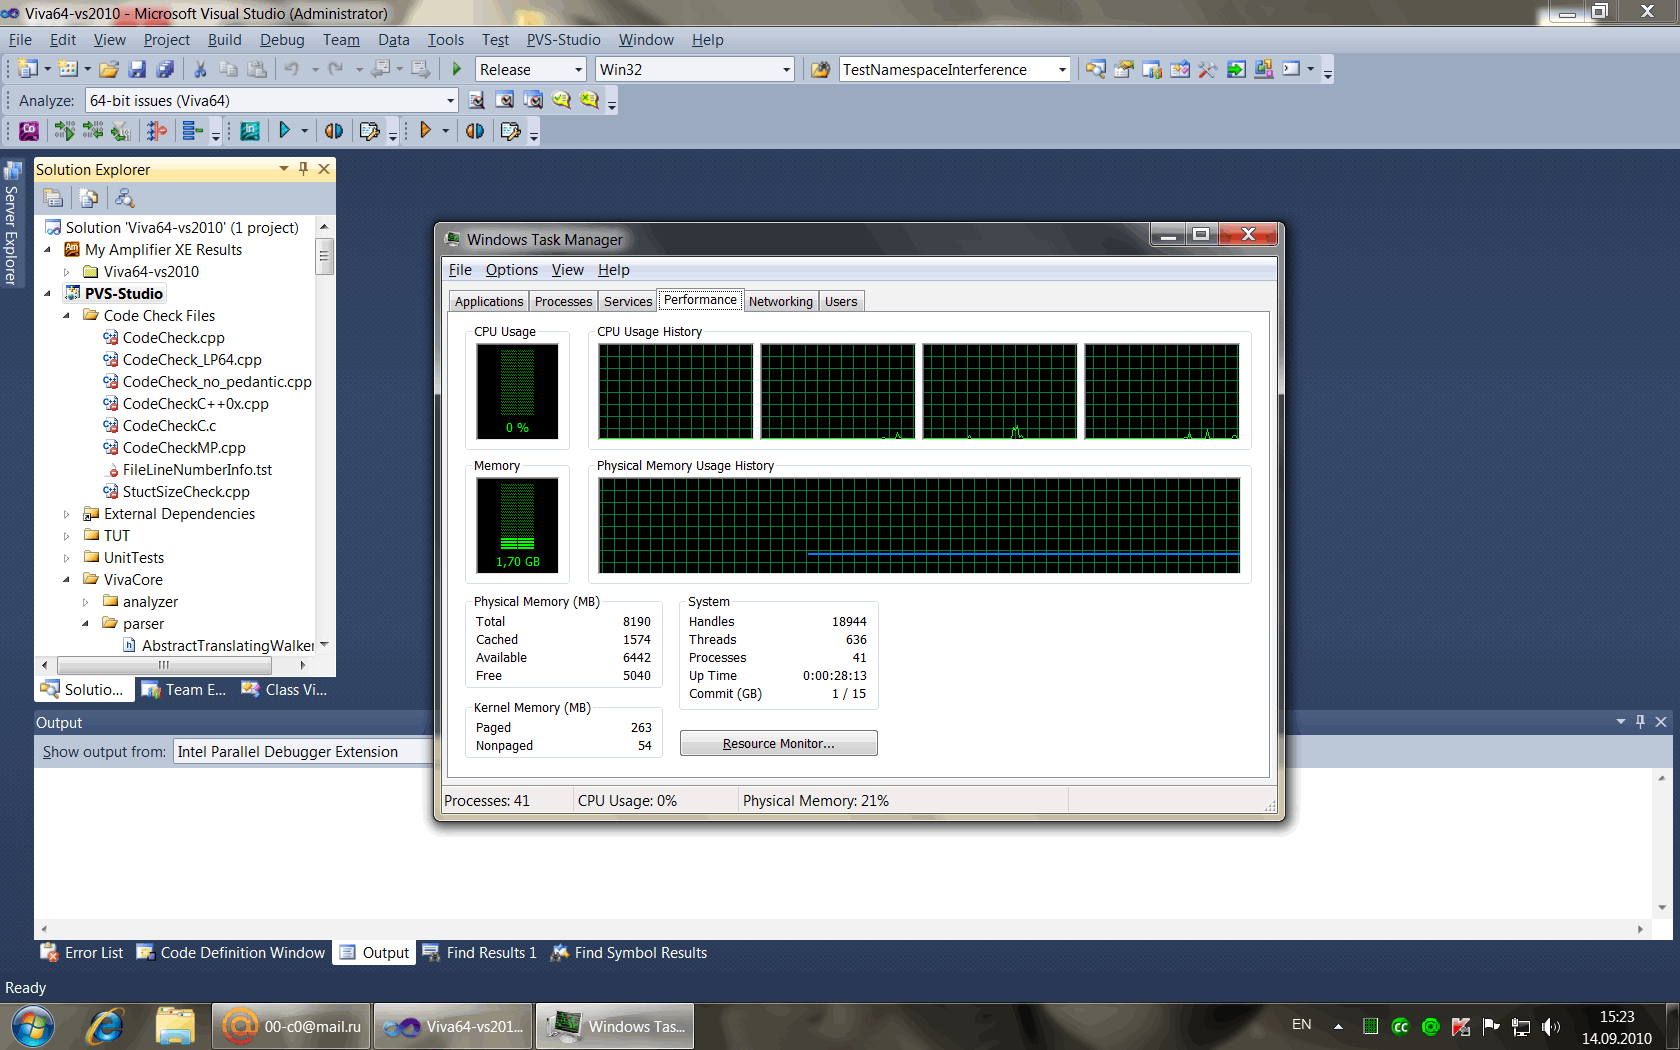
So, I have my project opened now and nothing happens. You may see on the picture that the load of the fourth core is about zero:
Now I simply launch Intel VTune Amplifier XE 2011. I only launch it! I don't analyze the project - I simply do nothing. But the fourth core is loaded completely:
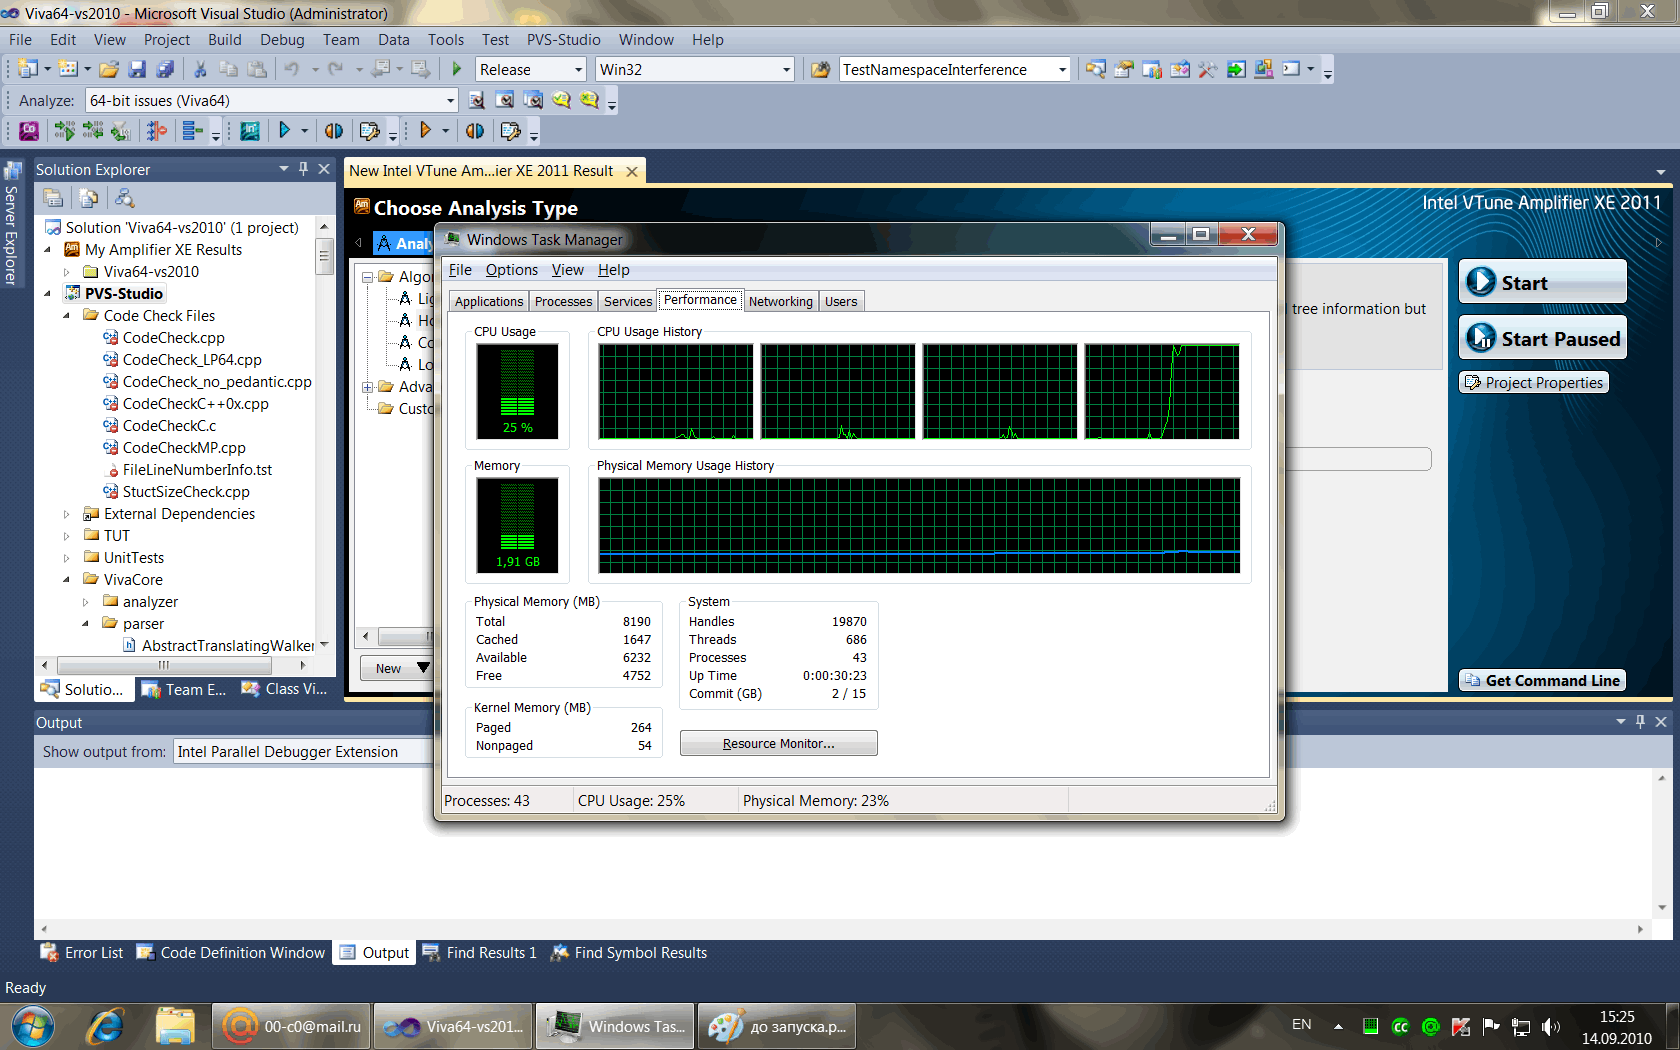
It gets uncomfortable to work at once. The environment starts lagging everywhere. If I close the Intel VTune Amplifier XE 2011 window, the lags disappear and the core load drops back almost to zero. Perhaps Intel VTune Amplifier XE 2011 does perform some useful work. But I don't know what work. If it really does, it must be somehow reflected at least. I felt that there was some error.
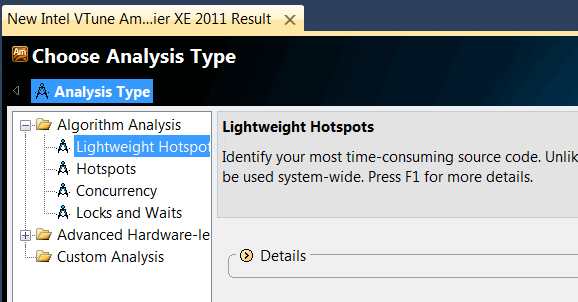
Lags did not stop me and I set to investigating our program. At first I chose the analysis mode that didn't collect information about the call stack but allowed me to understand what functions took most time:
Analysis was performed as expected:

And I got a useful result:
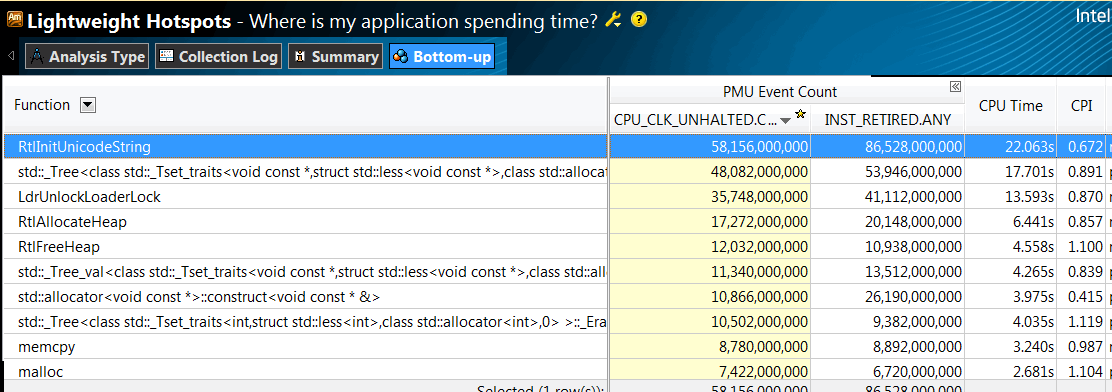
Most time is spent in std::_Tree, in functions of memory allocation and release. A programmer will understand at once that it is std::set the main slow-down is related to.
If you launch Amplifier in the Hotspot mode, the bottleneck will become much more evident:
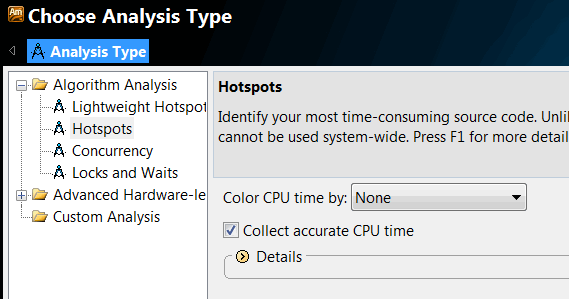
On launching the program in this mode, I could look through the call stack. However, my first launch in this mode failed. I had been warned that everything would be slower with the "Collect accurate CPU time" option checked. But it turned out to be too slow. When I clicked the button to open stack for the first function, I didn't manage to get the result (I was waiting for 15 minutes).
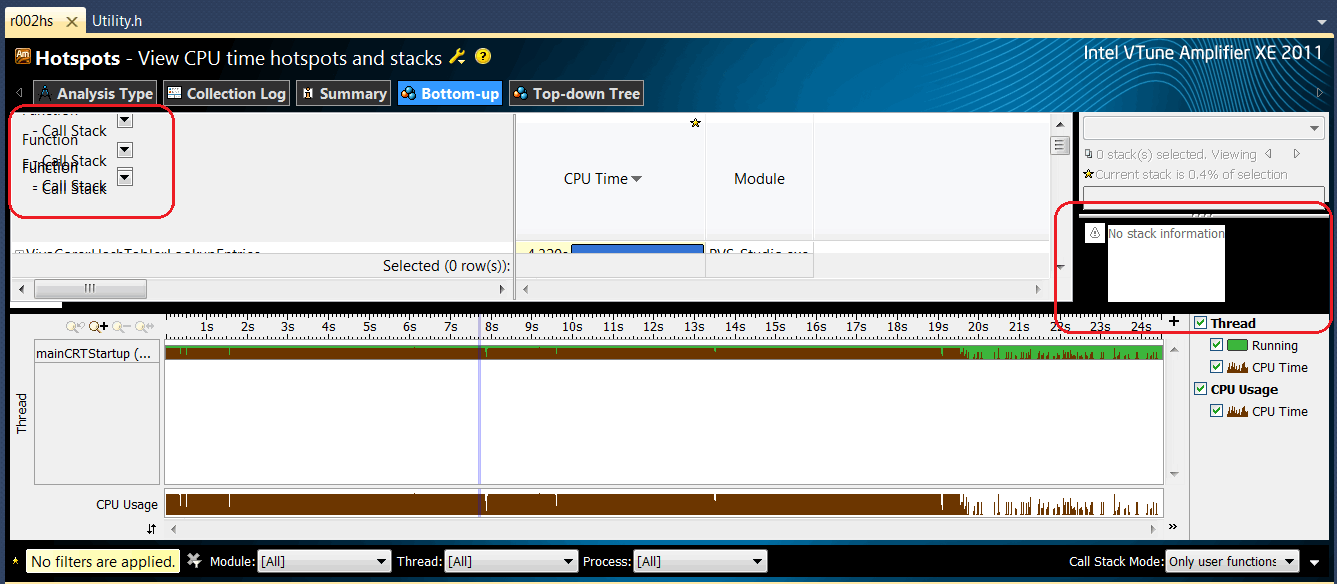
But the launch with this option unchecked showed me the necessary information. Still there is one thing that spoils the whole good impression. The tool is great what its functionality is concerned, but its interface is ugly. Everything is constantly sliding apart without redrawing and gets blurred. It's inconvenient and unpleasant to use the tool:
Well, it was not only the appearance that disappointed me. For some reason, the tool sometimes sent me to a wrong code fragment.
But still I managed to get the necessary result. It turned out that performance rises up to nearly the same level if you set the array's value to 64. The new subsystem brings almost no slow-down into the work. The correction looks as follows:
static const size_t QuickMaxSize = 64;
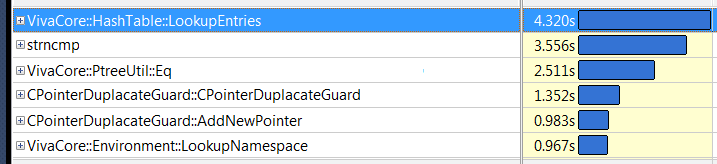
Amplifier confirms it. Now there are quite different functions that come into the picture, for instance, strncmp:
There is no happiness in the world of programs. Errors and drawbacks are all around us - both in our PVS-Studio and everywhere. It doesn't mean that we mustn't struggle against them, but it's a great step to admit at least common complexity of programs and that errors do exist.
This post seems to contain some criticism about the Intel VTune Amplifier tool. Maybe this subject is a burning issue for me as developer - they offer you another program that must make the world better but when you start working with it, you understand that more money was spent on marketing and nice pictures rather than quality control. Really, how can it be a good profiler that lags itself? A shoemaker without shoes. :)
I hope that the developers will fix this or at least most issues in the Release version. The tool itself is rather powerful. But, unfortunately, I can't recommend it for use yet. Surely, it's not very good to write such things in the Intel blog but it's frank at least. I hope the developers will appreciate it.
0
0
0
0