I experimented with Intel Parallel Inspector in memory-error diagnosis mode. I can say that I liked the product and the work it does. I was especially impressed by perfect integration into Visual Studio and full support of 64-bit projects—which Bounds Checker users will appreciate.
Mostly, I experimented with the Viva64 project and managed to find one rather serious error.
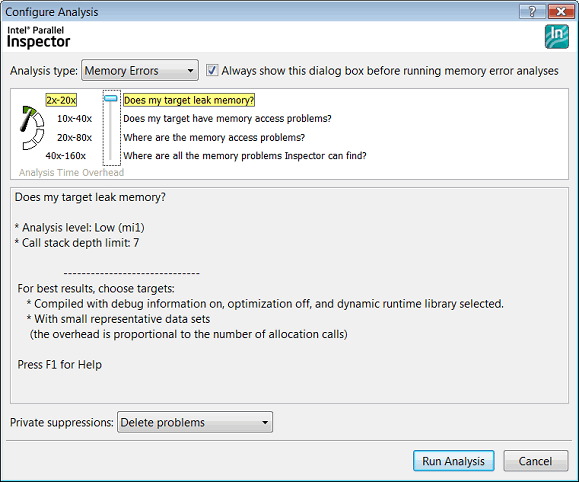
I liked the graphical interface of the Parallel Inspector launch mode settings very much—it is simple and clear:

I liked the indicator showing how much the current analysis type can slow down a program's execution. I liked this approach, the design and clearness of what to expect so much that I decided to check this indicator's accuracy on Viva64 project. Of course, the sampling is unrepresentative, but the check was still very interesting. Here are the results of launching the 64-bit debug-version of Viva64:
|
Launch mode |
Expected slowdown, according to the Parallel Inspector scale |
Actual slowdown when testing the Viva64 project |
|---|---|---|
|
Without Parallel Inspector |
No slowdown |
(1.23 sec) – No slowdown |
|
"Does my target leak memory?" |
By 2 - 20 times |
(17.70 sec) – by 14.4 times |
|
"Does my target have memory access problems?" |
By 10 - 40 times |
(72.57 sec) – by 59 times |
|
"Where are the memory access problems?" |
By 20 - 80 times |
(70.80 sec) – by 57.6 times |
|
"Where are all the memory problems Inspector can find?" |
By 40 - 160 times |
(404.82 sec) - by 329.1 times |
I think that the slowdown estimate is pretty close for cases when there is no information about the project. In the last mode, the figures I got exceeded the expected result. However, the Viva64 analyzer, compared to an average program, has a lot of memory allocation operations. Viva64 needs them when building and analyzing the syntax tree. So an increase in slowing, as compared to the estimate, is expected.
Using Intel Parallel Inspector leads to slowdowns, but they do not worry me. I consider them natural and not even that significant for a dynamic analysis tool that offers these features. However, it's a good thing to remember that it can be best to avoid running this tool for a program in real time. A more efficient approach would be to use packet launches or automated testing systems that will run at night and click all the buttons in an application. This way, you will not need to worry that the response may take minutes or hours.
All in all, I found Intel Parallel Inspector very useful and highly recommend it.
0