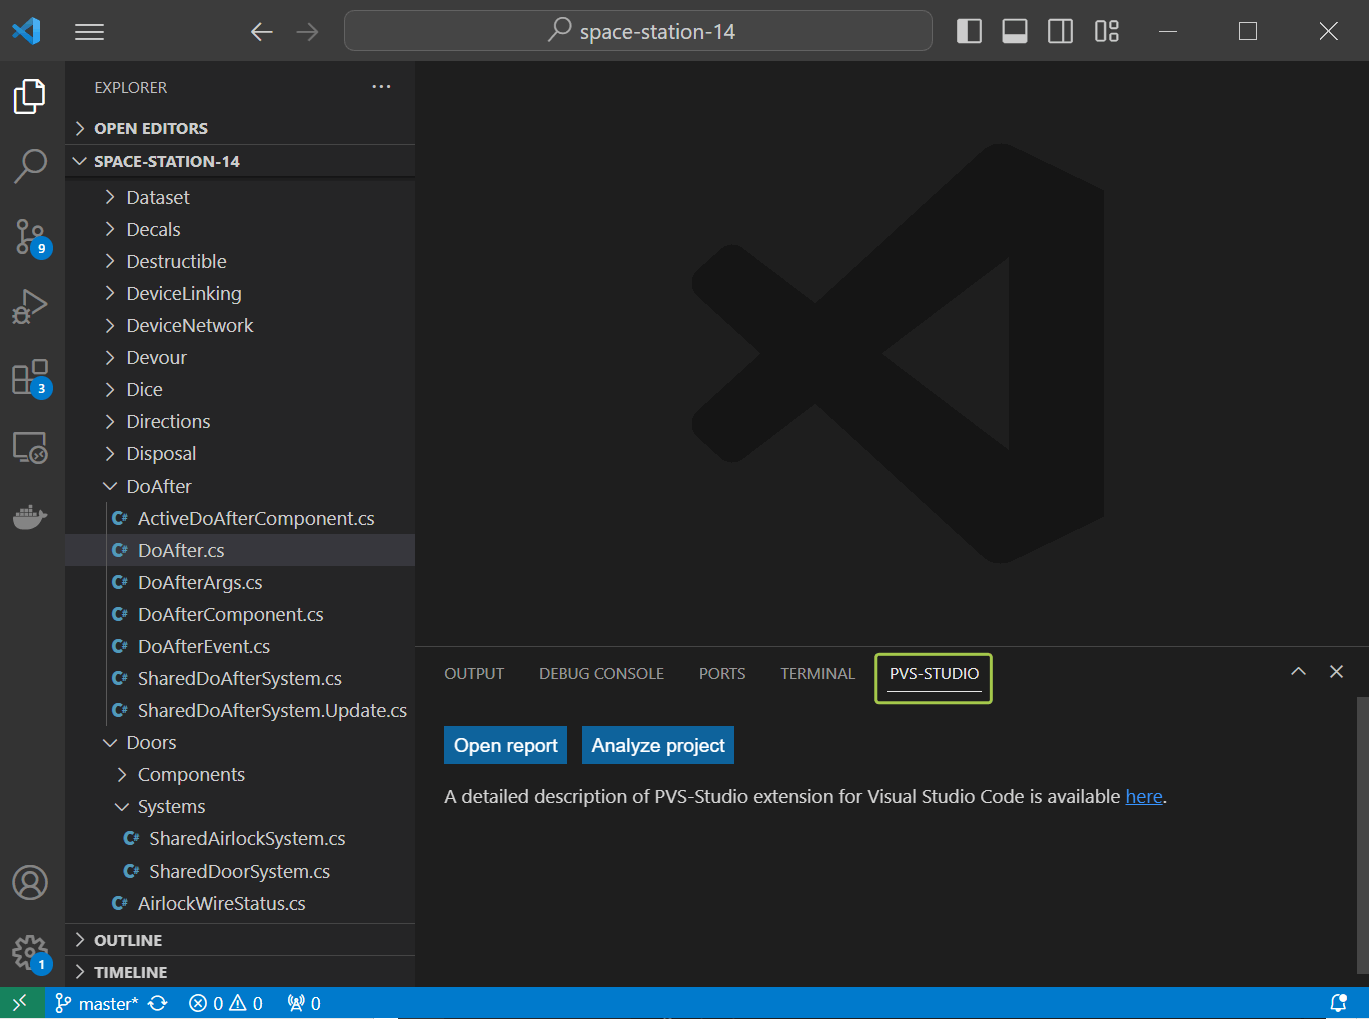


VS Code is a code editor that many developers are familiar with. Adding different extensions to enhance the programming experience is one of its main features. Now one of them helps find errors more efficiently not only in C, C++ but in C# code.

Today, the dev community has many common approaches for enhancing code quality. Developers follow the code design principles and adopt various programming practices, such as code review and unit testing, in the development process. Moreover, tools for detecting errors and vulnerabilities in code are rapidly gaining their popularity. The PVS-Studio static analyzer of C, C++, C# and Java code is an example of such a tool. This analyzer is easy to use and can be integrated into various IDEs (as well as into VS Code) via special extensions. These extensions help developers easily run the analysis and efficiently handle its results.
I've reviewed the PVS-Studio extension for Visual Studio Code earlier. Since then, the PVS-Studio team has added several new features:
In this article, using the example of the .NET project analysis, I'll show you how easy it is to find errors with the PVS-Studio extension for VS Code!
Before running the analysis, you need to check whether the PVS-Studio analyzer for your programming language and the PVS-Studio extension for VS Code are installed. If they aren't, you can consult the installation instructions from the previous article about this extension.
First, open the folder with the solution. You can run the analysis of the entire solution — just click the Analyze project button in the PVS-Studio window. This window is usually located at one of the tabs in the VS Code bottom pane.

If the PVS-Studio window is hidden, you can show it by executing the 'Show window' command in the command palette (Ctrl + Shift + P).
What if you need to analyze only certain code files or projects? In this case, you can follow one of the new ways to run the analysis, for example, via the File Explorer context menu.
You can find other ways in the documentation.
The first time you analyze the .NET solution, you'll see the following message:
Clicking the Edit button will open the .jsonc file. You can specify optional analysis parameters similar to some arguments of the analyzer console version.
After reviewing this file, run the analysis again. Now the analyzer may prompt you to select the solution (.sln) in the command palette. The solution includes the analyzed files or projects (in case there is more than one solution in the open directory). After that, the analysis will be run, and the PVS-Studio window will look as follows:
By the end of the analysis, you'll have a complete list of warnings. Since I have been analyzing only a few files from the solution, there is not so many of them.
The plugin has several filters and features that make it easier to handle the analysis results. You can learn more about them in the documentation.
Among the warnings received, there are two that are especially notable. Let's take a look at the warnings and the code they point to. Double-click one of the selected warnings. As a result, the analyzer will display the code in the editor.
The PVS-Studio warning: V3142 Unreachable code detected. It is possible that an error is present. SharedDoAfterSystem.cs: 52.
This warning points to line 52 and indicates that the following code is unreachable.
You won't have to think long and hard because the following warning will clearly indicate the cause of the problem.
The PVS-Studio warning:V3022. Expression is always true. Probably the '&&' operator should be used here. SharedDoAfterSystem.cs: 49.
Let's take a look at the conditional expression on line 49. According to the warning, the expression is always true. We can easily see that the args.NewMobState field is checked for inequality with two values: MobState.Dead and MobState.Critical via the OR operator. As a result, the second check is always true if the first check is false, and vice versa.
This error causes the OnStateChanged method to always terminate with a return on line 50, and all the following code is never executed.
When you review warnings and fix errors, it's worth suppressing false-positive or minor warnings. So, they won't distract developers in later analyses.
To do this, you need to select the warnings in the table (you can select them all at once using "Ctrl + A"), open the context menu, and select the Mark as a False Alarm or Add selected messages to suppression file options. You can also use these options by clicking the lightning icon button in the upper-right corner of the PVS-Studio window.
The first function is different from the second one: it adds the comment such as //-V[Warning Code] to the first line of code pointed by the warning to suppress it. However, the second function stores information about suppressed warnings in a special file.
Note that it's preferable to use Mark as a False Alarm to suppress unnecessary warnings.
Adding warnings to the suppression file is a handy way to put technical debt aside and focus on the quality of new code.
In this case, the standard scenario for using the feature is as follows.
You can learn more about it here: "How to introduce a static code analyzer in a legacy project and not to discourage the team".
I hope I've shown you that the PVS-Studio extension is an easy-to-use and handy tool to be integrated in the development process. In conclusion, I'd like to note that the extension is being worked on, and in the future versions, Java developers will be able to use it for checking their projects too. However, that's a story for another article.
Let me remind you that you can download the PVS-Studio extension for VS Code from the official website.
Clean code and successful projects to you! See you in the next articles!