
Last time, we discussed common approaches to detecting vulnerabilities in applications. This time, we'll take a more down-to-earth look at how we've implemented these mechanisms in our static analyzer for Java code.

This is a two-part series of articles, and the first one has been out for a while. It covers the theoretical foundations of building SAST tools to support taint analysis. To better understand the content of this article, I recommend that you catch up on the previous one first. This time, we'll take a closer look at how the recently released taint-mechanism works in PVS-Studio for Java code.
Before we begin, let's remember where we left off in the last article. At that time, I made a list of analyzer mechanisms needed to analyze tainted data. Here they are:
Which of these things have we done, which have not yet been successful, and which did we not want to do?
We won't dwell on the AST for too long. PVS-Studio has been supporting Java for many years, so naturally it includes AST. In our earlier article, we described how to create it and mentioned that the analyzer is based on the Spoon parsing framework. So, we use its tree. This is a rough visualization of how it parses the code to calculate the factorial.
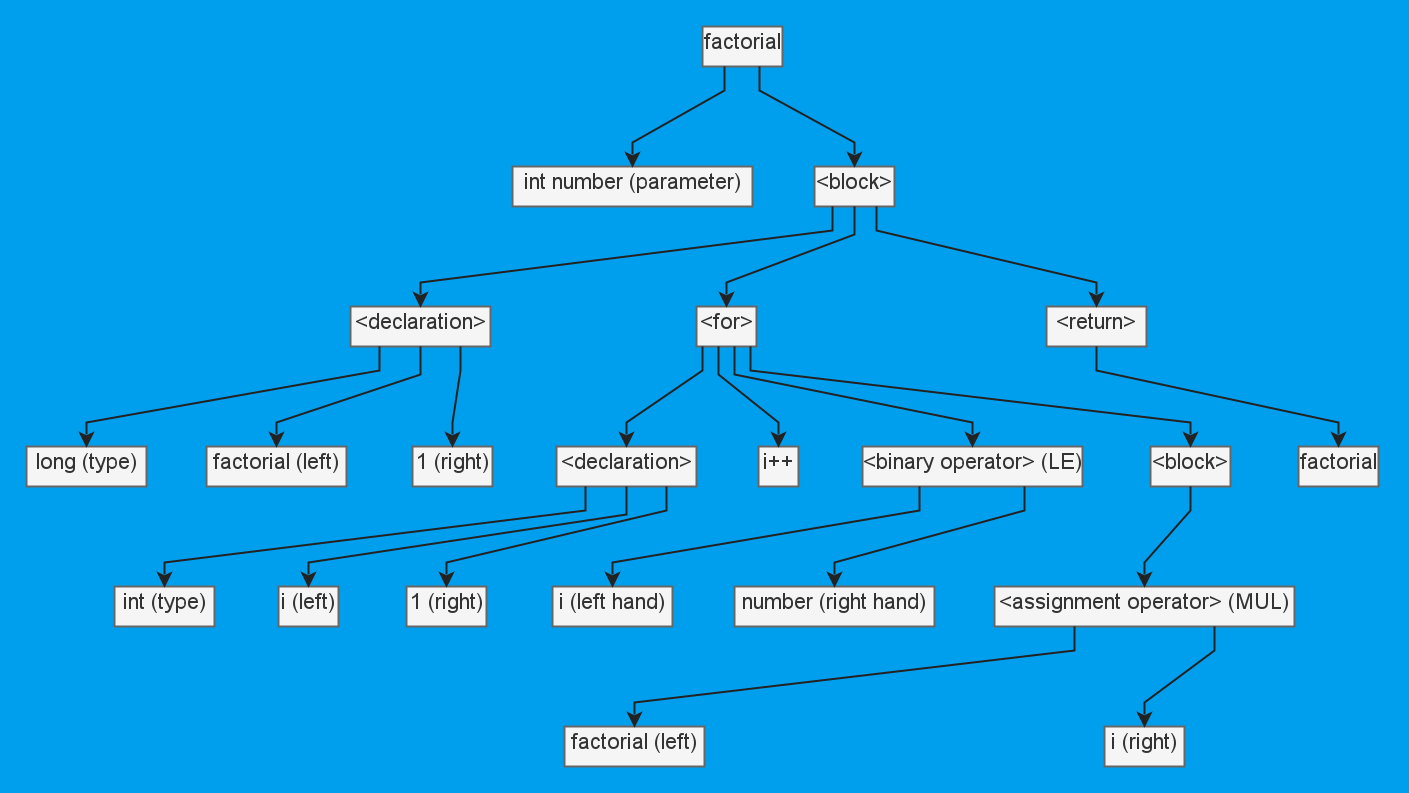
public static long factorial(int number) {
    long factorial = 1;
    for (int i = 1; i <= number; i++) {
        factorial *= i;
    }
    return factorial;
}Annotations present an interesting paradox. On the one hand, they're up and running, and on the other, we have yet to create them. To better understand how annoying this is, take a look at an example of annotations for an SQL injection:
Class("java.sql.Statement")
  - Function("execute", varArgs)
      .Set(FunctionClassification::SqlInjectionSink)
  - Function("executeUpdate", varArgs)
      .Set(FunctionClassification::SqlInjectionSink)
  - Function("executeQuery", varArgs)
      .Set(FunctionClassification::SqlInjectionSink)
  - Function("executeLargeUpdate", varArgs)
      .Set(FunctionClassification::SqlInjectionSink)
  - Function("addBatch", varArgs)
      .Set(FunctionClassification::SqlInjectionSink)
;
I hope you've grasped the main issue: this code isn't written in Java, but in C++. I won't elaborate on how difficult it is for Java programmers to support code in this language.
Let's talk about the more fundamental issues we face now:
It's also an insane piece of legacy code that surprises you every time you work with it. We've accidentally broken annotations several times while developing the new module, and these pitfalls are frustrating.
Anyway, we've already made the only (in)correct decision to port this thing to Java. This may cause some issues, like the lack of a performance-wise alternative to bit flags in Java, but these are solvable difficulties. However, rewriting will help us resolve the issues mentioned above and also immediately support user annotations, which the C# and C++ analyzers already have.
Following the famous principle that "the best code is the one that hasn't been written", the story is short here, too. I mentioned earlier that the analyzer is based on the Spoon framework. Fortunately for us, the prototype control flow was already there. It covered most of the scenarios we needed and could produce such pretty pictures with minimal tweaking:
Well, we got through it easily, so let's move on.
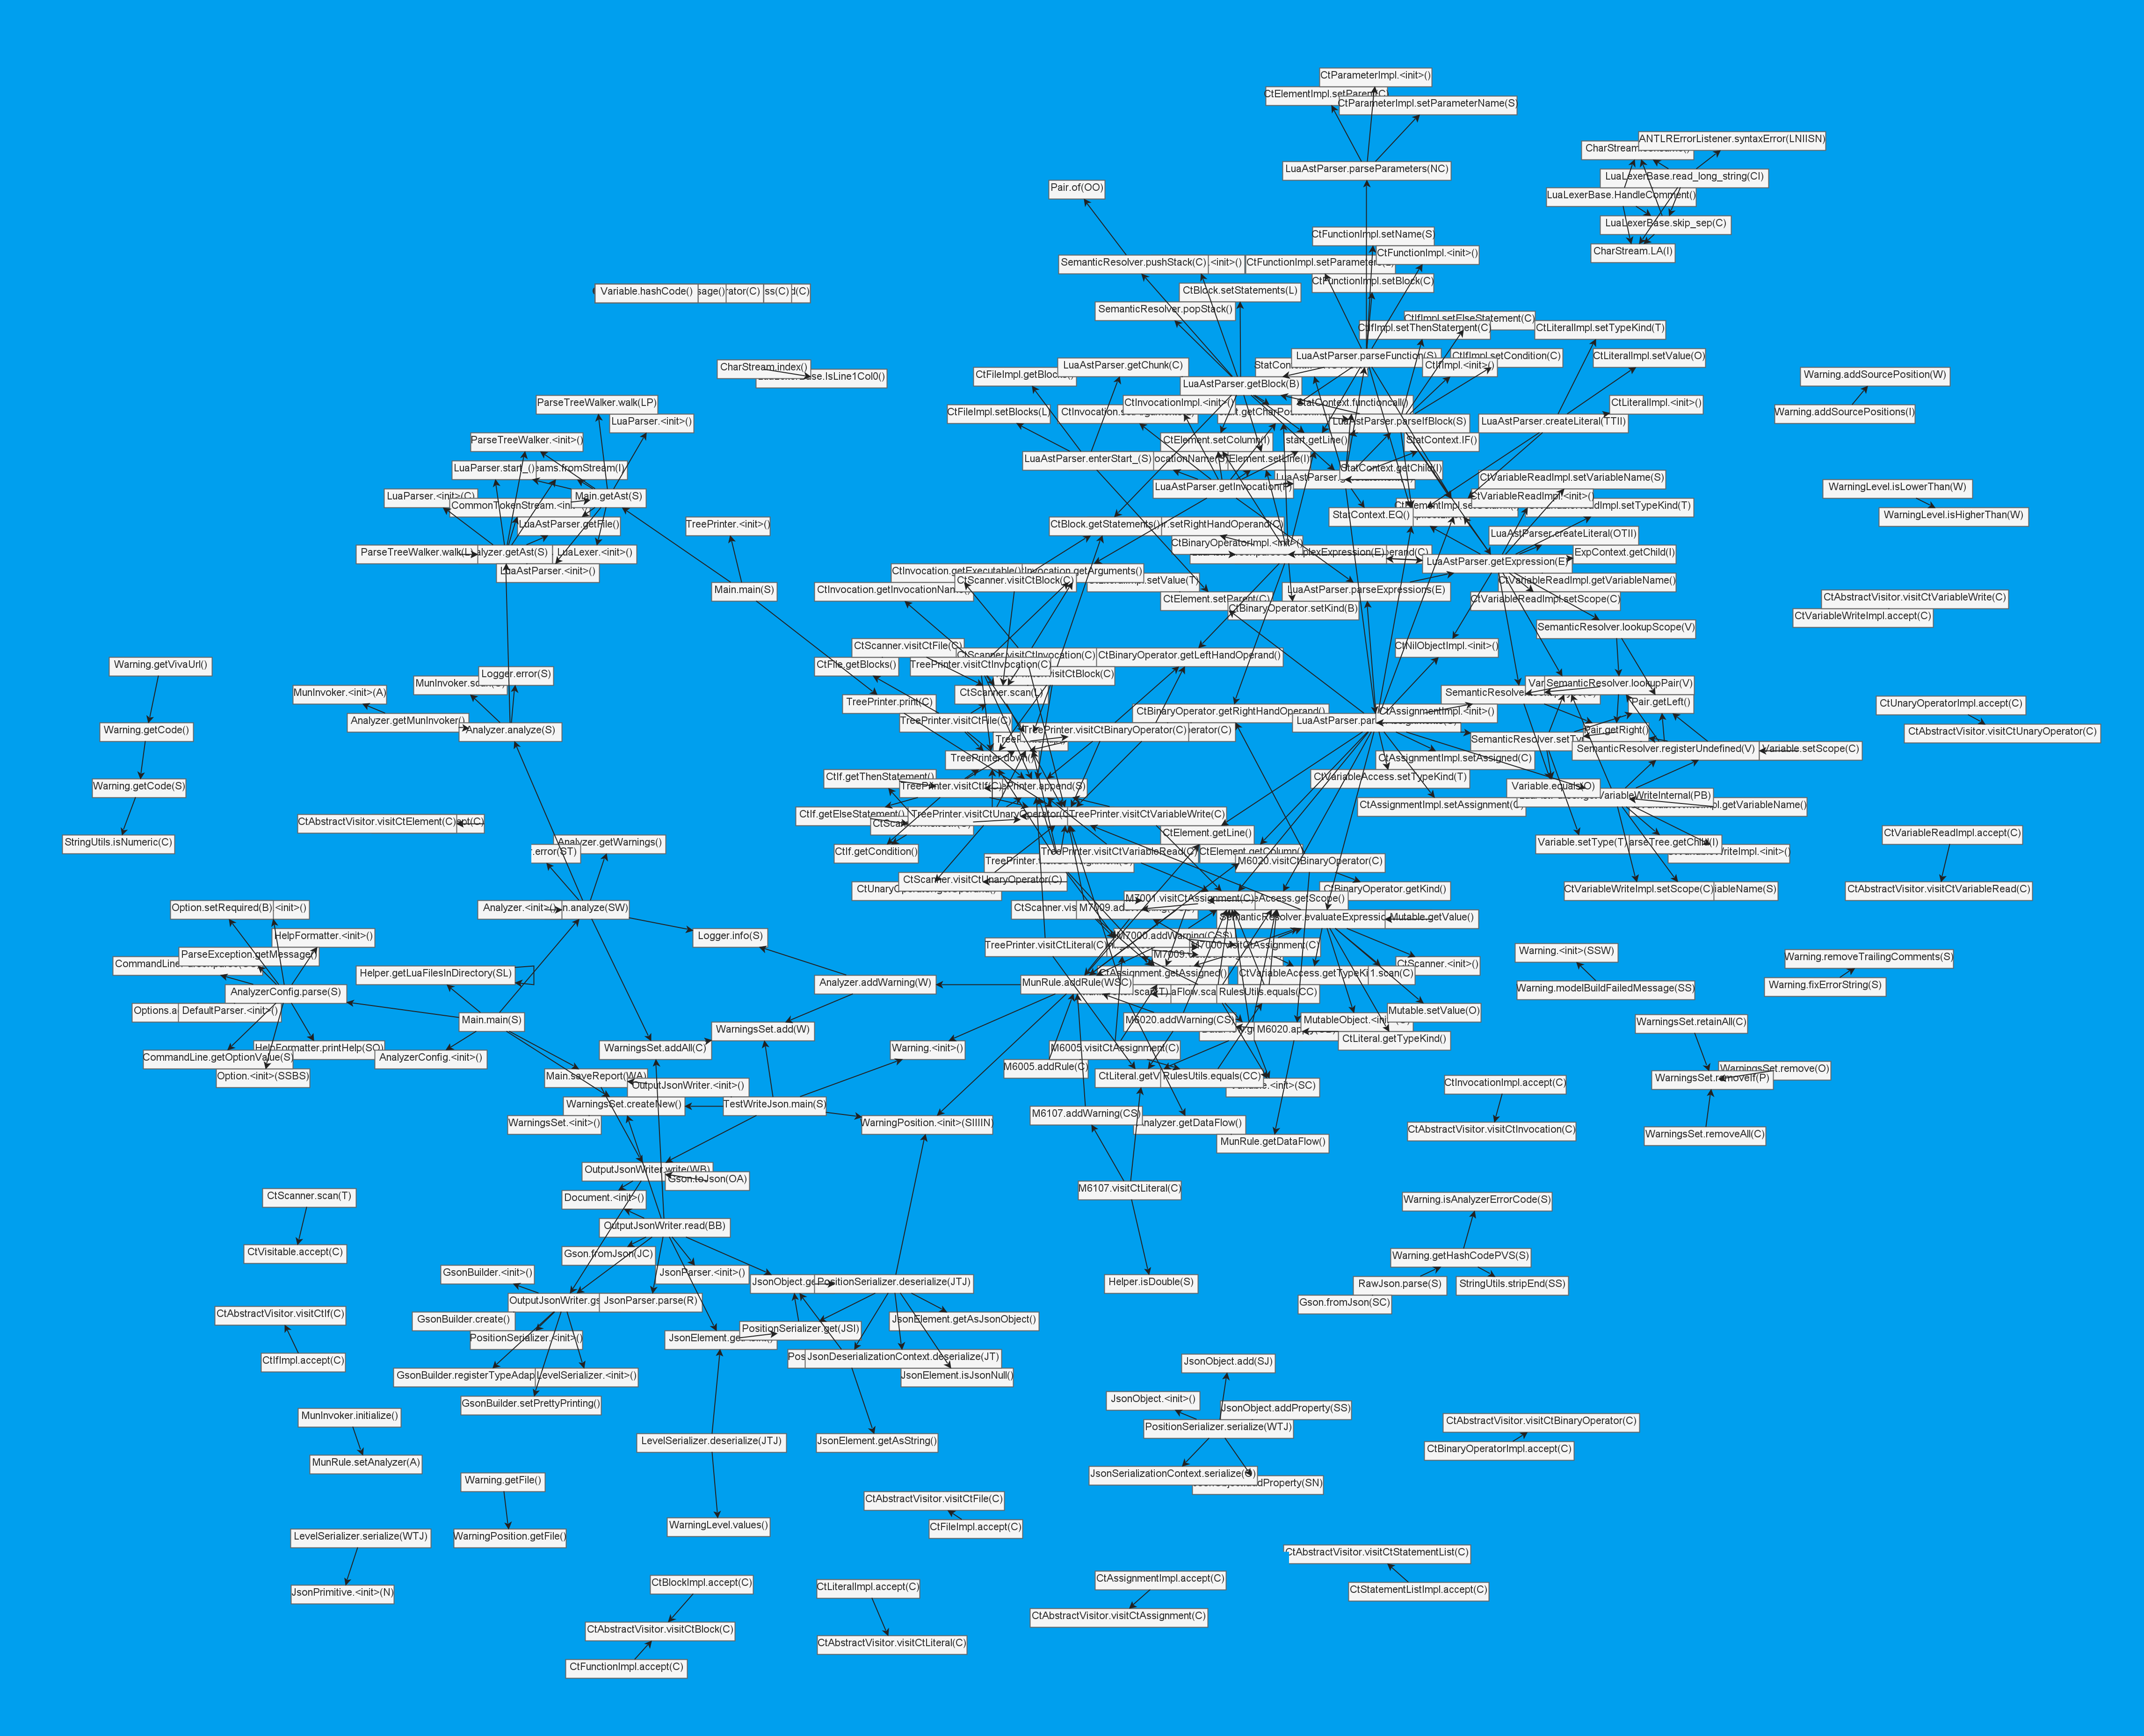
A mechanism for creating a call graph was next in order. Since our analyzer already has an AST, the task becomes simple: we just need to traverse the whole tree and get all the calls from the method bodies. To illustrate this, here's the image (it's clickable) we created for the previous article on the Lua analyzer:
There's an issue with this graph: you may notice some parts that aren't connected to the main cluster in the image. Our approach at the current stage doesn't consider polymorphism in any way, as it's more difficult than it seems.
How did we resolve this issue? We haven't yet. Last time, I skipped over this topic for the sake of brevity, but now I'm ready to tell you about our plans.
We're now working to the "connect only if 100% sure which method is called" extreme, as you can see in the image above. So, the connection happens only when a method that has some implementation is called, meaning it doesn't belong to an interface or abstract class. In the case of inheritance, a connection is made but only in reverse—when calling a method on super.
For now, I think we should start at the opposite extreme and add every possible connection. The two main principles here are:
With Spoon, as with method calls, we can get a superclass type, but we can't do the opposite. So, what do we do when we lack information? We build another graph, of course!
On a more serious note, we really need a structure that can always tell us what kind of superclasses and what kind of subclasses a type has. Basically, we need a "knows a guy" class. Yes, we can easily do this using a graph as well. We can't call it a tree due to multiple inheritance.
Such a graph may look simple enough:
However, another issue arises here: making connections to all possible methods isn't very wise. Still, we need to start somewhere. My guess is that in certain cases—like static method calls—it's easy not to push it to the extreme. Yet, even this simple case would dramatically complicate things:
var a = new A();
a.method();
Let's say A has the B and C successors. How do we know what type there are if we look only at the second line? The answer is, we don't. The only solution here is to traverse the method body where the code is located, but doing so for every method call may cost too much.
Note that DU-chains can come in handy here, as they enable us to jump directly to the point where the variable was assigned a value for the last time. This may help in simple cases similar to the one above, but we can't interprocedurally determine the type like this for the same reason I described in the last paragraph.
We've touched on CFGs, time to move up an abstraction. DU chains are built directly from CFG nodes, but the edges are chained together for a particular variable that participates in operations within those nodes.
Continuing with the factorial example, here's the chain for the i variable:
The chain starts in the loop counter declaration, it's used in the condition and to calculate the factorial. The chain ends in the increment, where another chain for the single i++ element appears. Since i++ can be decoded as i = i + 1, there's both a use to the right of the assignment and a new chain to the left—each override creates a new chain.
Yes, we've easily handled loops for now: no recursion is allowed in DU chains. This may cause problems when calculating variable values, but the solution is sufficient to detect tainted data.
To trace the data flow in an application, chains connect to each other. For the following code...
public static void taint(String tainted) {
    var notTainted = "str";
    var a = notTainted + tainted;
    var b = "";
    var c = b + a;
    var sql = b + c;
    st.execute(sql);
}
...a chain set like this is built:
The arrows point to the variables for which these chains are made. The same CFG nodes are placed in parallel—they have the same numbers. If this is the top node in the chain (an assignment), then we can see where else the edges go from this node, and these will be their parent chains.
Overall, the two most challenging aspects were:
Since many devs had to struggle with this, our team had an inside joke about the JVM operator back then. The JVM operator runs a Java process and then, putting on a smart face, stares intensively at the profiler.
The second thing I tactfully avoided last time was objects. If we think about it, we'll soon realize that DU chains do almost nothing to help us track object field values.
So far, our analyzer doesn't consider write operations to fields, let alone changes to the state of objects within methods. It considers only changes in the object value, and the chain is built for it.
It might seem that we could just build chains out of object fields, right? No. There's a little issue here:
var a = new A();
a.field = "value";
a = null;
var b = a.field;
The field value wasn't directly changed, but we'd better stop accessing it because an NPE will occur. In our chain for field, the a variable isn't considered. The same thing happens with method calls that change the internal state, only this is even harder to track.
There are also more trivial things: for example, when building a chain, one should look not only at the field, but also at the object to which it belongs. Otherwise, we'll have chains constructed between the same fields of different objects.
How to fix it? I don't know, but I'd appreciate it if you could give me a hint :) I've got some ideas, though.
In the code above, the DU chain for a.field should contain the a = null; node, but if it contains something like var other = a, we don't need to add a connection to that node. We don't consider alias analysis yet. This is a rough example of what the CFG and DU chains for a.field from the example above would look like:
The control flow graph is on the left, and three different chains for field are on the right. The first two consist of just one node, since the values aren't used after they are assigned.
Things get more complicated when it comes to methods that change the object state (setters, for example). However, I think we can leverage the insights from our other analyzers and create a mini-summary of the method using the same annotations. In fact, all we need to know is that the data coming into a method goes into its field (then it can pass tainted data), or that calling a method removes tainted data.
Anyway, this is a topic we have yet to tackle in future releases. As I was writing this, I thought it might deserve a separate article, so stay tuned :)
We had a control flow graph, a def-use graph, a call graph, a hierarchy graph, a traversal graph... Even a graph of graphs, to be honest.
Not that we needed all that for program analysis, but once you start building graphs, it's hard to stop.
In the previous article, I showed an example of a bottom-up traversal—that's exactly how our analysis works. Let's take the code above as an example:
public static void taint(String tainted) {
    var notTainted = "str";
    var a = notTainted + tainted;
    var b = "";
    var c = b + a;
    var sql = b + c;
    st.execute(sql);
}
Here's what we need to do:
java.sql.Statement has execute called, which is a sink;sql is by moving up its DU chain;sql, we see that it depends on b and c, so then we traverse their chains from the bottom to the top;a, notTainted, and tainted;tainted chain, we see that this variable is a public method parameter, i.e. the source.We've written an article on why public methods are sources of tainted data.
I've also avoided the topic of branching. I did this to keep the examples simple and the content light. However, we have to deal with it somehow in the analyzer. Let's leave the SQL injection behind and look at XPath that appeared in PVS-Studio 7.35:
String user = request.getParameter("username");

if (user.contains("'")) {
    return;
}

var xpath = XPathFactory.newInstance().newXPath();

String query = "//users/user[" +
        "username/text() = '%s']" +
        "/data/text()";
query = String.format(query, user);

String result = xpath.evaluate(query, doc);
Here's an issue: with bottom-up analysis, we need to know somehow that the top check stopped execution if the data was tainted. So far, we've resolved this issue in a fairly simple way. Maybe it's even too simple:
For example, in the image below, it's impossible to go from the dangerous left branch to the sink in the right branch. So, there's no vulnerability.
I created this mechanism and, foolishly, without checking the API, initially wrote it to check all possible branches. This caused the following code to become kryptonite for my algorithm:
if (!sql.contains("'"))
    st.execute(sql);
else {
    var str = sql.replace("'", "");
    st.execute(str);
}

if (!sql.contains("\""))
    st.execute(sql);
else {
    var str = sql.replace("\"", "");
    st.execute(str);
}

if (!sql.contains(";"))
    st.execute(sql);
else {
    var str = sql.replace(";", "");
    st.execute(str);
}

if (!sql.contains("--"))
    st.execute(sql);
else {
    var str = sql.replace("--", "");
    st.execute(str);
}

// ....
It goes on like this for 200 lines. Fortunately, we discovered this during testing and fixed with a more efficient algorithm, but this case I remember well.
Above, we've looked at a simple case where the sink and source are in the same method, but this isn't the case most of the time. A value caught in the sink can depend on two things:
This is where the call graph (and in the future, the hierarchy graph) comes into play. Do you remember the title image?
Since we have two levels of graphs (intraprocedural and interprocedural), we need two traversers. The first one traverses the DU chains and sends requests to the second one when the other method needs to be traversed. This happens exactly in the two cases mentioned above. We call this the "down" traversal and the "up" traversal, respectively. This is what it looks like:
So, yes, there really is a graph within a graph :)
The difficulty we faced in the interprocedural analysis was understanding when we get caught in a loop. This can happen either in the case of recursion, or when method calls lock onto each other.
Building the full path of the traversal, with nodes being whole methods, seemed like a logical solution for this.
Firstly, it solves the looping issue, because we already know which nodes we've traversed.
Secondly, we can attach useful meta-information to nodes. This helped us separate the Command and Argument injection.
Thirdly, it would clearly show how tainted data got into the sink. Unfortunately, even though we now store this data, we have no way to display it, and we're not sure how to do it without solely relying on an IDE plugin. Feel free to leave your suggestions in the comments if you have any :)
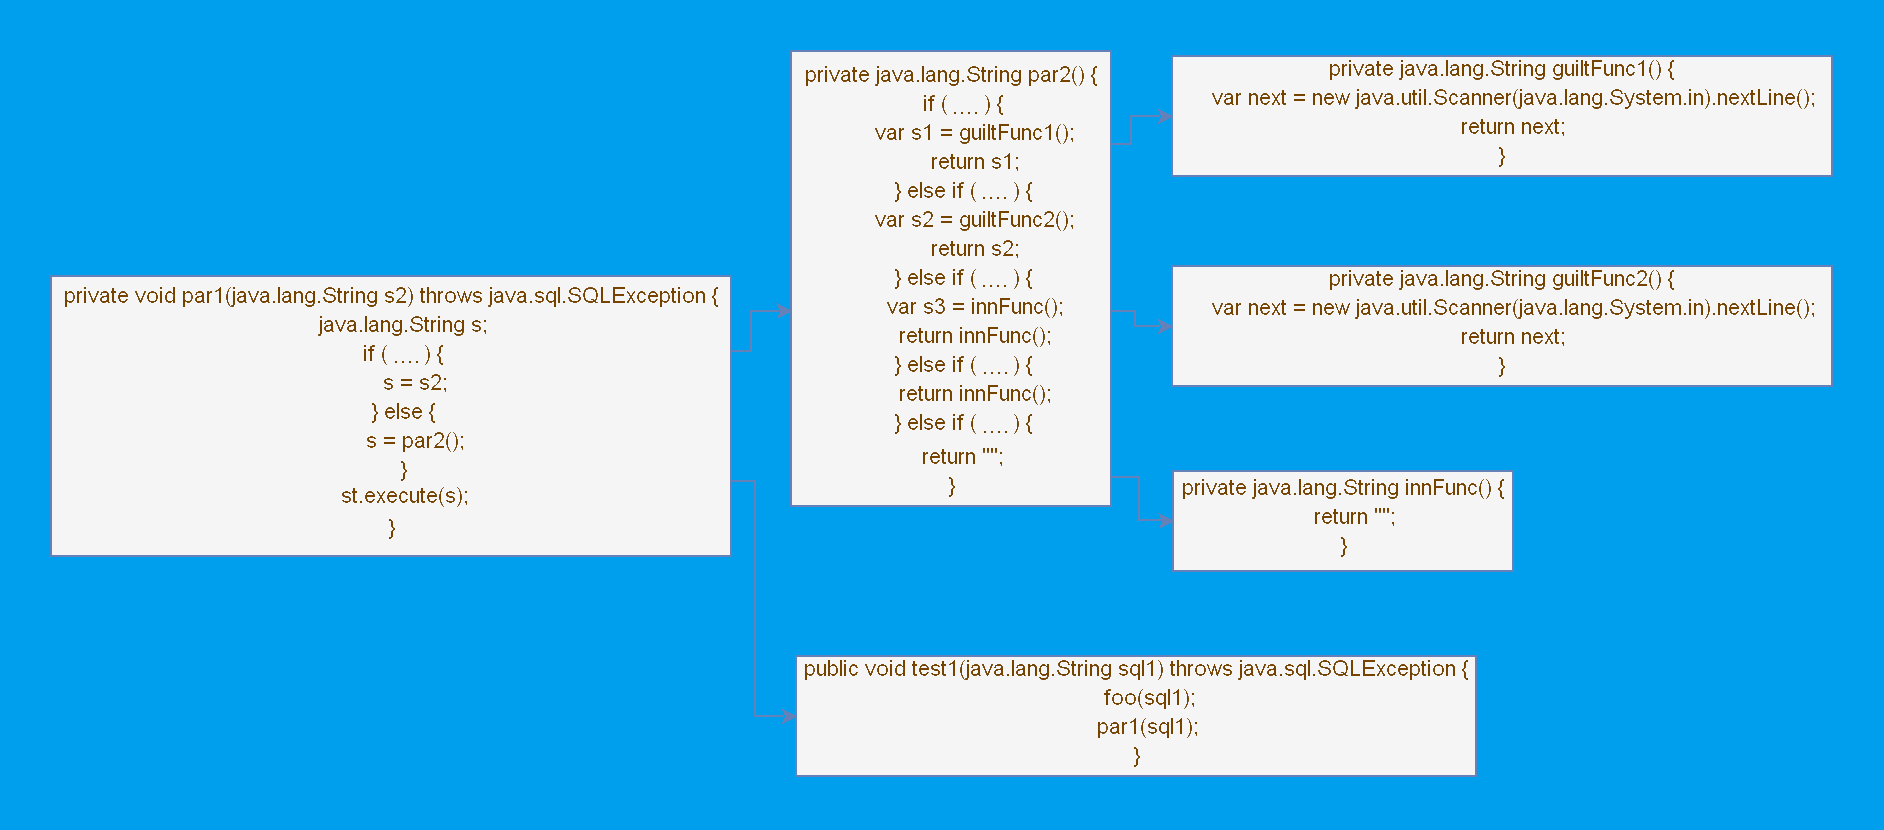
By the way, here's a rather messy visualization of such a traversal:
It's messy because this is a real image that I used to debug the algorithm. However, it's very informative: we can see that the top methods are called from the source par1 (I don't remember what these names mean), and the test1 method, on the contrary, calls it.
In my previous article, I said that it's optional to have both DU chains and an intermediate representation. We didn't go for maximization—we don't have SSA.
We had many discussions within the team about whether it was worth implementing. Still, the simplified view has tangible benefits, and we recently encountered one of the issues caused by its absence. So, the two code lines below are identical:
query = query + string;
query += string;
However, our data flow nodes contain unchanged AST nodes. So, in the second case, it seems that there's no reading of data from query—syntactically, it's missing.
Still, I'm not yet convinced we need it. Yes, there are pros:
Yet, there are some serious cons as well:
All in all, we're still debating, but the cons have won so far.
Thanks to everyone who read both articles of the series. Please feel free to leave your comments, I'd really appreciate the feedback. I'm just plain happy—after the third attempt, I finally figured out how to display DU chains in somewhat understandable way :)
We're now actively developing a taint solution for our Java analyzer. To keep up with us, subscribe to PVS-Studio on X and our monthly article digest. You can try the tool for free here.
And if you feel like following me, you can subscribe to my personal blog.