
Nous utilisons des cookies pour améliorer votre expérience de navigation.
En savoir plus

When PVS-Studio for Linux was released, I tried it on my project and thought it would make a good supplement to other analyzers that I'd already been using.
Note. This article was originally published in Russian on habrahabr.ru. The original and translated versions are posted on our website with the permission of the author.
Since the astrologers have announced an "Integrate PVS-Studio into your favorite IDE" week, I decided to write a small post about my experience of setting up Anjuta DevStudio tool (http://anjuta.org/) to work with the analyzer. Many thanks to Vsevolod Lutovinov for the script he shared and his article Integrating PVS-Studio into Eclipse CDT (Linux) ("Integrating PVS-Studio into Eclipse CDT (Linux)")
I took the script from the original article and slightly modified it to work with projects built with autotools.
pvs-anjuta.sh
#!/bin/sh

# without arguments, the script is called as External Tool,
# and we need to call 'make clean' forcedly:
if [ -z "$1" ]; then
    make clean
fi

# calling from the builder, checking the targets:
if [ "$2" = "clean" ]; then
    make clean
   # we're done here:
    exit
fi

# no 'clean' or the script is called as External Tool -
# start analysis:
TEMPLOG=$(tempfile)

# cleaning up leftovers of 'strace' that may appear in certain cases:
pvs-studio-analyzer trace -- make 2>&1 | sed '/strace: umovestr:/d' -
pvs-studio-analyzer analyze -o "$TEMPLOG"

# removing the obscure line that I get in the converter's output:
RC=$(plog-converter -t errorfile "$TEMPLOG" \
    | sed '/The documentation for all/d' -)
rm -f "$TEMPLOG"
echo "$RC"
After that, open the project you want to check and go to Preferences. In General, switch to the "Installed Plugins" tab and tick the "Tools" plugin.
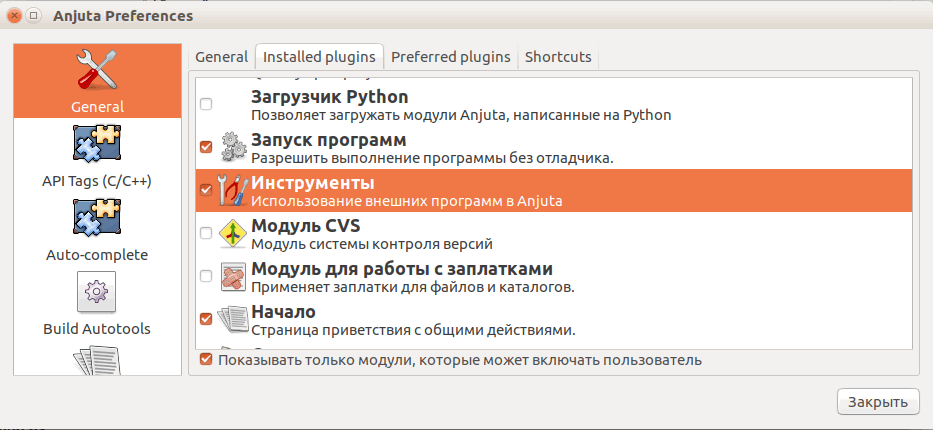
Figure 1 - Anjuta Preferences: Tools
Scroll to the end of the preferences list to the "Tools" option and add a new tool, "PVS-Studio Check".
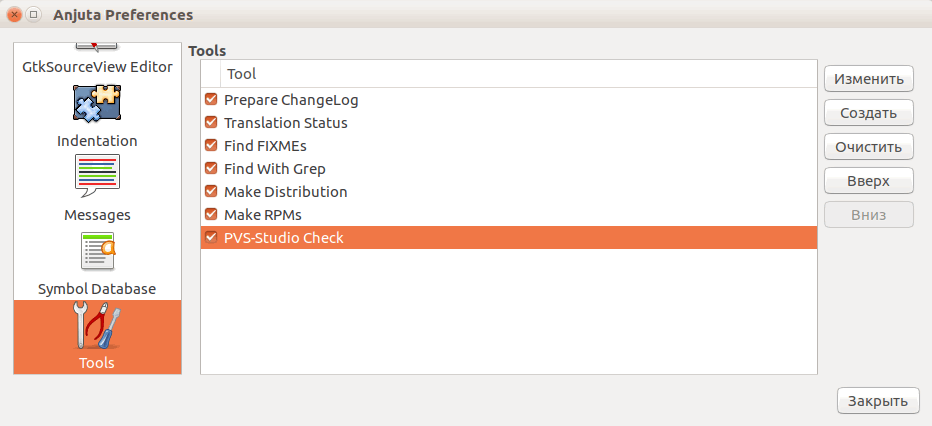
Figure 2 - Tools
Set the tool as shown below

Figure 3 - Tool Editor
Once you've set it up, click on the "PVS-Studio Check" command of the "Tools" menu to start analysis and have the analyzer warnings output in the standard message window. Double-clicking on a warning will take you to the corresponding line.
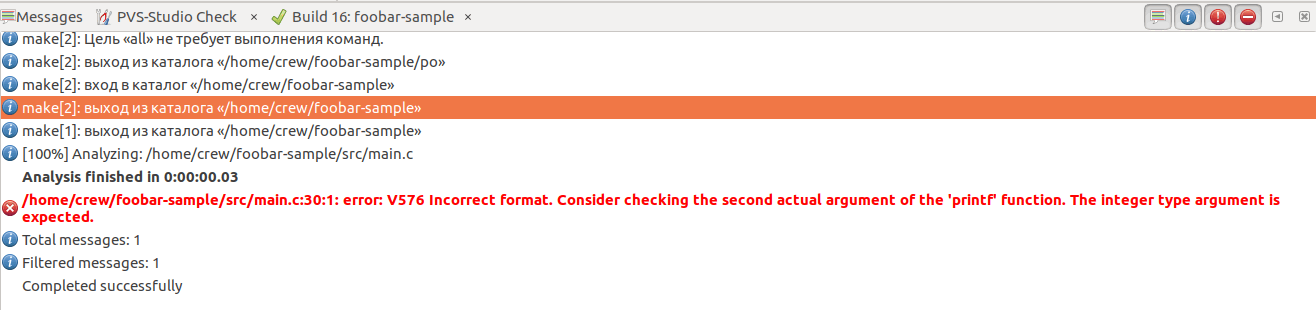
Figure 3 - Example
0
0
0
Français
158